Abstract
Purpose
There are many important diseases whose treatment could be improved by delivering a therapeutic protein to the colon, for example, Clostridium difficile infection, ulcerative colitis and Crohn’s Disease. The goal of this project was to investigate the feasibility of colonic delivery of proteins using multiparticulate beads.
Methods
In this work, bovine serum albumin (BSA) was adopted as a model protein. BSA was spray layered onto beads, followed by coating of an enteric polymer EUDRAGIT® FS 30 D to develop a colonic delivery system. The secondary and tertiary structure change and aggregation of BSA during spray layering process was examined. The BSA layered beads were then challenged in an accelerated stability study using International Council for Harmonization (ICH) conditions. The in vitro release of BSA from enteric coated beads was examined using United States Pharmacopeia (USP) dissolution apparatus 1.
Results
No significant changes in the secondary and tertiary structure or aggregation profile of BSA were observed after the spray layering process. Degradation of BSA to different extents was detected after storing at 25 °C and 40 °C for 38 days. Enteric coated BSA beads were intact in acidic media while released BSA in pH 7.4 phosphate buffer.
Conclusion
We showed the feasibility of delivering proteins to colon in vitro using multiparticulate system.
3. Introduction
Protein therapeutics have gained a larger market share since the 1980’s. Currently, more than 246 protein or peptide therapeutics are on the market, including 47 monoclonal antibodies approved by November 10, 2014 (1, 2). Some of the advantages of protein therapeutics over small molecules include high specificity, high potency and lower potential of adverse effects etc. (3). Some of the disadvantages of protein therapeutics include difficulties in oral delivery, higher cost, instability and immunogenicity (3). Most of the protein therapeutics are administrated parentally because of the therapeutic efficacy of proteins might be reduced due to acidic degradation, enzyme digestion and low permeability through the intestinal epithelial cells in the gastrointestinal (GI) tract. Nevertheless, treatments for intestinal diseases such as Clostridium difficile infection (CDI), ulcerative colitis and Crohn’s Disease would still benefit from an oral delivery system that can target proteins and peptides to the colon, and for these conditions epithelial cell penetration and subsequent absorption may not be required. In addition, even for systemic delivery of protein therapeutics via the colon, site-specific delivery of proteins to the colon is a prerequisite. Kim et al. studied the in vitro release of BSA from chitosan coated pectin beads and found that the system released BSA in simulated colonic medium (4). Xing et al. developed a coated calcium alginate gel beads-entrapped liposome for colon specific delivery of a bee venom peptide (5). Less than 16% bee venom was released in vitro, while in vivo a gamma-scintigraphy study confirmed the bee venom release in the colon at about 4 h after administration in all three volunteers. Zhang, et al. developed a microbeads system layered with chicken yolk antibodies to target C. difficile toxin A (6). However, further examination of the structure and biological activity of the released protein and peptide drugs are necessary to understand the formulation and processing of these formulations.
For solid dosage forms of protein delivery systems, water must be removed from the protein. Typically, this is done by spray drying or lyophilization; however, these methods have some drawbacks. Lyophilization is a long process consuming a lot of energy and labor, while spray drying suffers from low recovering rate compared to lyophilization and spray layering (also referred as spray coating in some literature) (7, 8). As an alternative, we are investigating fluid bed processing for manufacturing dosage forms in which the protein is in the solid state. A multiparticulate delivery system made via fluid bed processing could be an optimal option of manufacturing protein products and for colonic delivery in particular. In addition, the multiparticulate delivery system offers the benefits of an appropriate distribution of drug release, which minimize the dose dumping compared to other dosage forms like tablet or injection (9, 10).
The process of developing a multiparticulate delivery system involves two steps; first the spray layering of a protein onto a carrier and second the enteric coating of the protective polymers to the protein layered beads. Spray layering is a process drying the active ingredients on the surface of a carrier in a fluid bed. It has been performed in drying and layering small molecules for decades. Spray layering is the most important step in creating a multiparticulate delivery system for colon targeting of protein drugs. Yuh-Fun Maa, et al studied the feasibility of spray layering recombinant human deoxyribonuclease (rhDNase) using a bench top fluid bed processor and a laboratory-scale spray coater (11, 12). Aggregation of rhDNase up to 35.0% was observed in both processes. The inlet temperature of fluid bed was 75°C, which was much higher than the onset of aggregation temperature for rhDnase. These studies implied that aggregation and denaturation of proteins are the key Critical Quality Attributes (CQA) that need to be studied.
The goal of this study was to assess the feasibility of a multiparticulate system for colonic delivery of protein therapeutics. For the early stages of developing a colonic delivery system, a cost effective and rapid approach is to use well characterized, readily available and inexpensive protein; especially when the protein of interest is expensive and only limited quantiles are available. Thus, we investigated how spray layering affects BSA stability. To the best of our knowledge, there was no study done to characterize protein conformational change after spray layering and no study done to challenge the protein layered beads in an accelerated stability study. Enteric coating was also applied to protein layered beads to protect the protein from degradation in the upper GI tract. EUDRAGIT® FS 30 D is a dispersion of copolymers (methyl acrylate, methyl methacrylate and methacrylic acid) and will degrade at pH above 7.0, which provides the colonic targeting release of drugs (13–15). We also tested the in vitro release of BSA from enteric coated beads.
4. Materials and Methods
Materials
D-mannitol beads (355–500 micron, NONPAREIL®-108, Lot no.140204) were purchased from Freund Corporation (Shinjuku-ku, Japan). Bovine serum albumin (A9085-25G, Lot no. SLBM9836V, purity >96% by agarose gel electrophoresis) and HPLC grade water were obtained from Sigma Aldrich (St. Louis, MO). Polyvinylpyrrolidone (Kollidon® 30, Lot no. G41216PT0) was a gift from BASF (Tarrytown, NY). EUDRAGIT® FS 30 D (Poly(methyl acrylate-co-methyl methacrylate-co-methacrylic acid) 7:3:1, Lot no. B150165002) and PlasACRYL® T20 (Lot no. PT150402) were a gift from Evonik (Parsippany, USA).
BSA Spray layering
All sub-coating and spray layering was performed using Bosch Solidlab 1 (Previously known as Huttlin Mycrolab) fluid bed system with a 0.6 mm spray nozzle size and a 0.3 L bowel. The layering solution atomization pressure was 0.6 bar and the microclimate air pressure was 0.3 bar. To preheat the beads, the inlet air temperature was set at 45 °C and kept during the layering process; after 20 min, when the product temperature reached ~35 °C, spraying was started; this temperature is well below the melting temperature (~69°C) of BSA (16). During the whole layering process, the product temperature was between 30 °C to 35 °C.
Before spray layering the protein, a 2.5% (w/v) PVP (Kollidon® 30) solution was sprayed at a rate of 0.74 mL/min onto the D-mannitol beads to achieve a sub-coat with a 1% weight gain. The sub-coating was performed to minimize the attrition of mannitol beads during the fluid bed process. Then the BSA spray solution was prepared by mixing BSA (100 mg/mL), PVP 30 (2% w/v) and water in a beaker with a stir bar at very low speed with no vortex for 10 minutes. This solution was sprayed onto the beads with a feed rate of 0.74 mL/min for 30 mins and then the spray rate was increased to 1.0 mL/min. The total time of spraying was 2 h, and 5 grams of BSA were spray layered onto 50 grams of mannitol beads.
Characterization of BSA layered beads
Particle size measurement and mass recovery yield
The particle size distribution of BSA layered beads was measured using static light scattering with a dry powder feeder (Malvern Mastersizer 2000/SCIROCCO 2000). A refractive index of 1.33 for mannitol was used in the Mastersizer 2000 software with Mie scattering model. The vibration feeding rate was 50% and the air pressure was 0.2 bar. The sieve analysis was performed using a sonic sifter (ATM Corporation, Milwaukee). For sieving a 50 g sample was sieved at a tapping amplitude of 80% of full intensity for 5 minutes, followed by weighing the particles on each sieve. Since the starting beads ranged from 355 to 500 microns, any layered beads larger than 710 microns were considered as agglomerates, while any particles smaller than 355 microns were considered as fines. The layering bead yield was calculated as:
BSA loading, loading efficiency and Insoluble aggregates
The BSA layered beads were dissolved in HPLC grade water by shaking at room temperature for 30 mins on an orbital shaker; during shaking the test tubes were gently invert for 10 times at 10 min intervals. The dissolved solution of BSA was measured for protein concentration at 280 nm using A280 nm1 g/L of 0.667 (from supplier Certificate of Analysis of BSA) with a DU 800 UV/Vis Spectrophotometer (Beckman Coulter, Brea, CA) after equilibrating samples to room temperature, and the solvent absorbance was subtracted. The solution was then filtered through a Millex®-GP 0.22 μm PES filter (EMD Millipore, Billerica, MA) and measured for concentration again.
Theoretical drug loading, actual drug loading and loading efficiency were calculated using the following equations:
The insoluble aggregates were calculated based on the difference of protein concentration before and after filtration using the following equation:
The insoluble aggregates in commercial BSA and reconstituted BSA samples were compared using student t test.
Soluble aggregates determination
The filtrate from the reconstituted BSA solution was diluted to 0.5 mg/mL based on UV absorbance and analyzed for soluble aggregates using size exclusion chromatography. A Superose 12 10/300 GL column (Pittsburgh, GE Healthcare) was coupled with AKTA FPLC system. The column was calibrated with a gel filtration standard kit (Biorad #1511901, Hercules, CA), containing thyroglobulin, bovine γ-globulin, chicken ovalbumin, equine myoglobin, and vitamin B12, which covers the molecular weight range from 1,350 to 670,000 kDa. A UV detector was used to quantitate the protein concentration at 280 nm. The raw chromatograph data was exported to the data analysis software OriginPro 9.0 (OriginLab Corporation, Northampton, MA) and fitted into a combination of monomer, dimer and trimer of BSA.
Secondary structure determination
The secondary structure of reconstituted BSA was measured by a circular dichroism (CD) spectrometer JASCO J-810 (Easton, USA). The CD spectrum was collected from 190 nm to 260 nm in a quartz cuvette with 0.05 mm path length. The data pitch was 1 nm and the bandwidth was 1 nm. The scanning rate used was 100 nm/min. Three scans were averaged out. The CD spectrum was fitted into secondary structure components using DichroWeb (17, 18). The algorithm SELCON 3 with reference set 4 was used for analysis of the spectra from 190 nm to 240 nm.
Tertiary structure determination
Derivative-UV spectrum of BSA was used to probe the tertiary structure change. The UV spectrum of reconstituted BSA was collected from 200 nm to 400 nm (240 nm/min) using DU 800 spectrometer with a wavelength interval of 0.2 nm at room temperature. Five measurements of the same sample were performed and averaged. The second derivative of the spectrum was calculated using 30 points filter and third degree Savitzky Golay polynomial in Origin 9.0 and fitted into cubic functions with a resolution of 0.02 nm for peak positions. The average and standard deviation of peak positions were calculated from three biological replicates. Three BSA samples in 0.1 N HCl was also measured as the negative control.
Accelerated stability of BSA layered beads
ICH accelerated stability conditions were used to test the stability of the BSA layered beads. Beads were stored in the 20 mL scintillation vials (Catalog No. 66022-055, VWR International) and purged with nitrogen for 10 seconds before tightly capped. Those vials were wrapped with aluminum foil and stored at three different conditions, 4 °C, 25 °C/60% relative humidity (RH) and 40°C/75% RH. Samples were reconstituted and analyzed for aggregation, secondary structure and tertiary structure as described above after 38 days.
Enteric coating of BSA layered beads
The BSA layered beads were coated with an enteric polymer EUDRAGIT® FS 30 D using the same fluid bed system as used for spray layering. PlasACRYL T20 was used as the plasticizer. The coating solution was prepared by mixing EUDRAGIT® FS 30 D with PlasACRYL T20 in water for 15 mins followed by a filtration through 500 micron sieve according to vendor’s instruction (19). The solid content of final solution was 20%. The spray nozzle had a diameter of 0.8 mm. The inlet temperature was 35°C and the product temperature ranged between 25°C and 28 °C during the coating process. The atomization pressure was 0.6 bar and the microclimate air pressure was 0.3 bar. The feed rate was 0.74 mL/min. Beads were withdrawn from the fluid bed at different time points during the coating process to retain beads with different coating thickness. The coating thickness was assessed by weight gain of beads during coating.
Scanning Electron Microscope (SEM) of enteric coated BSA beads
The surface morphology and cross section of BSA layered and enteric coated beads were visualized with a FEI Quanta 200 Scanning Electron Microscope (Hillsboro, Oregon) operating under the conditions specified in the images. The cross section was obtained by cutting the bead using a blade while immobilizing the bead with a tweezer. Beads and half of beads were mounted to SEM specimen holders with conductive carbon adhesive tabs (Ted Pella Inc., Redding, CA) and then sputter coated with 10 to 20 nm of platinum/Palladium in a sputter coater EMS 150T ES (Electron Microscopy Sciences, Hatfield, PA). The samples were imaged at 2 kV, using secondary electron detector, working distance of 9.9 mm and probe current at 0.1 nA. The coating thickness of enteric layer was measured using ImageJ software (NIH, Bethesda) (20). The software was calibrated with the scale in the image and then used to determine the coating thickness from 3 different spots on each of the 2 samples. Mean and coefficient of variation was calculated as an indicator of the goodness of the coating.
In vitro release of enteric coated BSA beads
The in vitro release of BSA from enteric coated beads was tested using a USP apparatus 1 with a special 150 mL vessel (Hanson Research, Chatsworth, CA). The media volume was 100 mL, and three buffers with pH 1.2 (0.1N HCl), 6.8 and 7.4 (phosphate buffer) were used to mimic the conditions of stomach, small intestine and large intestine, respectively. The dissolution test was performed at 37°C with a basket speed of 100 rpm. For the first 2 hours, the basket was kept in 0.1N HCl. Then media was replaced and the fresh phosphate buffer of pH 6.8 was added. At 4 h time point, this media was replaced and the fresh phosphate buffer of pH 7.4 was added. The procedure of changing buffers was done in 2 minutes. The media was sampled every 30 mins and analyzed for protein concentration using UV-vis spectrometer at 280 nm after centrifugation at 12,000 rpm for 15 mins. The buffer absorbance background was subtracted from each reading. The sampling volume (500 uL) was compensated in calculation. The dissolution profile of different coating thickness was compared using f2 similarity factor:
Rt and R’t are the cumulative percentage released at each of the n time points of the two tested products.
5. Results and Discussion
When developing protein pharmaceuticals, a key aspect of the development process is to characterize the properties of the protein to be given to the patient. These properties including but are not limited to aggregation profile, conformation stability and colloidal stability, which provide the basis for drug product specifications and for the assessment of potential changes that could affect protein stability. For proteins, there are many properties that need to be characterized given their complex structure. Thus, in this study we characterized the critical properties such as aggregation profiles, changes in secondary and tertiary structures of proteins during the process of developing the multiparticulate delivery system.
Many stresses including shear stress, heat stress and surface phenomena at the air-liquid interface etc. could lead to secondary structure and tertiary structure perturbations (23). Structure change of the protein could lead to further aggregation or long term stability issues. Circular dichroism (CD) spectroscopy is a valuable technique for investigating the secondary structure of proteins (24). The main components of secondary structures including α-helix, β-helix, turns and random coils show characteristic spectra in the far UV region of CD spectrum. Deconvolution of the CD spectra based on existing protein database and algorithm provides the quantitation of the secondary structure composition of the proteins. Derivative UV-vis spectroscopy was applied to monitor the tertiary structure of proteins by tracking peak positions of three aromatic amino acids tryptophan, tyrosine and phenylalanine (25, 26). These aromatic amino acids on the surface of BSA are sensitive to the local environment change like solvent exposure which indicates the tertiary structure perturbation of BSA (27). Soluble aggregates of proteins are commonly analyzed using size exclusion chromatography, which separates the protein from its soluble aggregates according to sizes. The size of insoluble aggregates ranges from nanometers to micrometers, requiring different techniques to fully quantitate them.
For the model protein BSA, the structure and degradation under different stresses have been extensively studied and well characterized (28–35). BSA consists of 583 amino acids, with a molecular weight of 66.5 kDa (36). The 17 disulfide bridge within BSA gives it a high propensity to aggregate once BSA unfolds upon external stress and expose the disulfide bonds to the solvent (37). This fact helps to explain the existence of 10% aggregation immediately upon reconstitution of commercial lyophilized BSA powder, which was observed in this study and also in the literature (27, 38). Therefore, BSA is a good model protein to study protein degradation via aggregation during spray layering and enteric coating. Aggregation is a critical quality attribute for protein drug products. Protein aggregation can form through multiple pathways or mechanisms, which are not mutually exclusive. In a specific protein product, aggregation can form through association of the native monomers, association of the conformational changed or chemically modified monomers, nucleus controlled aggregation and surface induced aggregation (39). Under certain conditions, low order aggregation like dimers and oligomers is reversible in the early stages of aggregation (39, 40). However, most of the aggregation is irreversible. In addition, the soluble aggregates may further form insoluble aggregates or particles. Those aggregates might not have the same biological potency as the monomer, which could comprise the efficacy of drug products (41). Protein related particles in parental products is easier to be recognized by immune system which holds the potential for eliciting adverse immunogenicity (42). The size of those particles could range from 100 nm to a few centimeters, which will require multiple orthogonal analytical methods to fully characterize them (43). In our case, the multi-particulate system is designed for oral delivery, which reduces the risk of immunogenicity issues. However, the protein aggregation in the final dosage form is still likely to affect the product qualities.
Spray Layering of BSA
The material including the beads, polymer binders and excipients used to spray layer BSA were chosen during several development batches by optimizing the yield (44).Lactose beads, microcrystalline (MCC) beads and mannitol beads were compared, after which lactose was dropped since potential Millard reaction with the proteins amine groups (45). Mannitol beads were chosen for this study. In addition, Talc as a common anti-tacking agent in fluid bed coating was found to be incompatible with the protein.
In this study, the theoretical BSA loading was 8.81% w/v while the actual BSA loading was 8.35% w/v, hence the loading efficiency was calculated as 94.8%, which is higher than the typical recovery rate in spray drying (46, 47). As shown in Table I, among the recovered beads, there were very few agglomerated beads (2.95%), but lots of fines (10.83%), especially between 300 to 355 microns, which suggested the potential attrition of beads during the process.
Table I.
Particle size distribution of BSA layered beads measured by Malvern Mastersizer 2000
| Aperture (micron) | Volume % | Volume in% | Status | Particle size distribution | Micron |
|---|---|---|---|---|---|
| >850 | 0.12 | 2.95 | Agglomerates | d (0.1) | 351.46 |
| >710 | 2.83 | d (0.5) | 473.841 | ||
|
|
|||||
| >600 | 12.06 | 86.22 | Monomeric particles | d (0.9) | 635.858 |
|
|
|||||
| >500 | 25.85 | Span | |||
|
|
|||||
| >425 | 27.29 | 0.6 | |||
| >355 | 21.02 | ||||
|
|
|||||
| >300 | 9.09 | 10.83 | Fines | ||
| >250 | 1.68 | ||||
| >212 | 0.06 | ||||
Note. d (0.1) is the size of which 10% particles is smaller;
Span is the ratio of [d (0.9) - d(0.1)] to d(0.5);
Aggregation profile of BSA after spray layering and accelerated stability
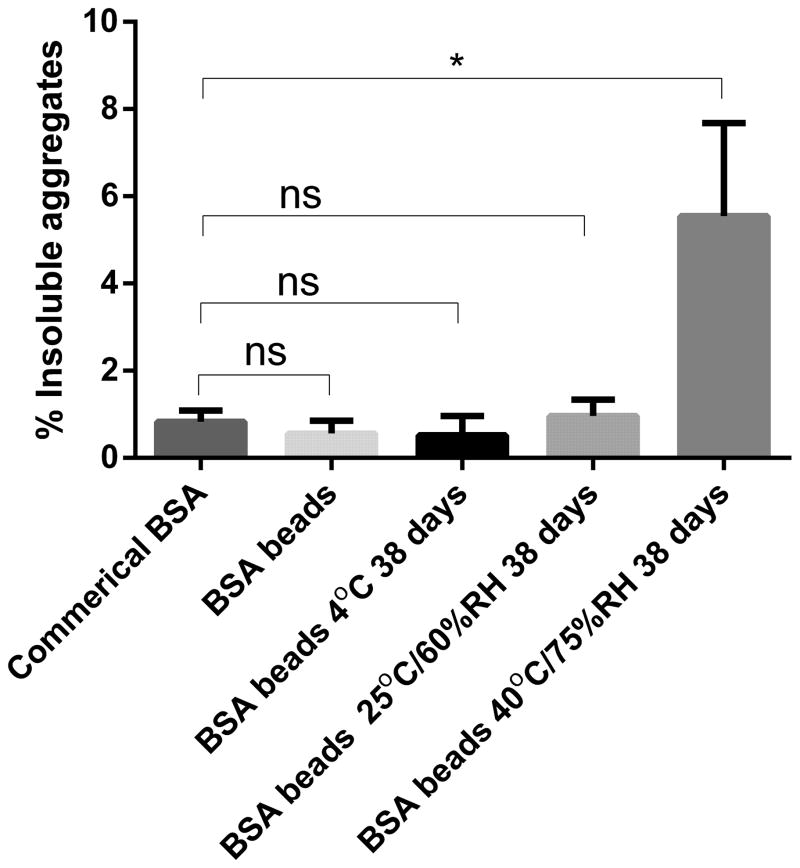
As shown in Figure 1, the percentage of insoluble aggregates was 0.69% ± 0.07% in reconstituted BSA samples, compared to 0.83% ± 0.15% in commercial BSA, which didn’t change significantly after spray layering (student t test, n=3, P>0.05). In addition, the percentage of insoluble aggregates didn’t increase significantly in BSA layered beads stored at 4°C and 25°C for 38 days. However, when the layered beads were stored at 40°C for 38 days, the insoluble aggregates increased from 0.69% to 5.54%, suggesting the BSA beads were not stable at the 40°C condition for 38 days (Figure 1). The size limit of this method to quantitate the insoluble aggregates was 0.22 μm, and particles smaller than this limit would pass through the filter; the reported hydrodynamic size of BSA monomer ranged from 3.3–4.3 nm (48, 49).
Figure 1.
Insoluble aggregates of BSA in various samples. Beads were reconstituted in water for measurement.
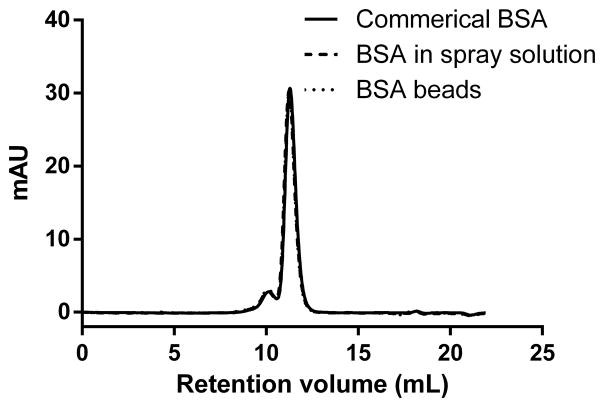
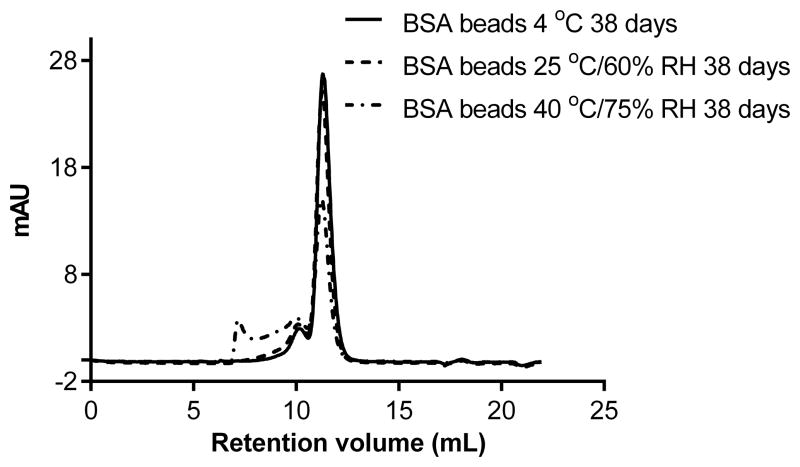
For soluble aggregates, the size exclusion chromatograph of commercial BSA freshly reconstituted showed a major monomer peak around 11.2 mL (elution volume), overlapped with a dimer peak at 10.1 mL and a trimer peak at 9.4 mL (Figure 2A) based on the calibration of the SEC column with molecular weight markers. The monomer, dimer and trimer content of BSA didn't change after mixing with the binder PVP or after spray layering, which indicates there was no significant change in the extent of soluble aggregate formation. However, after storage of the BSA beads under 25°C and 40°C for 38 days, the monomer percentage decreased from 86.7% to 76.4% and 50.83%, respectively, while the high molecular weight species including dimer and trimers increased from 13.3% to 23.6% and 49.2%, respectively (Figure 2B). No fragmentation of BSA was seen in any samples. This data correlated with the insoluble aggregates increase we seen after storage at 40°C. Soluble aggregates may form insoluble aggregates given enough time under stressed conditions (39).
Figure 2.
(A). Size-exclusion chromatograms (detection at 280 nm) of commercial BSA dissolved in water, BSA mixed with PVP30 in the spray solution, reconstituted BSA right after spray layering.
(B). Size-exclusion chromatograms of reconstituted samples from BSA beads stored at 4 °C, 25 °C/60% RH and 40 °C/75% RH for 38 days.
Secondary Structure of BSA
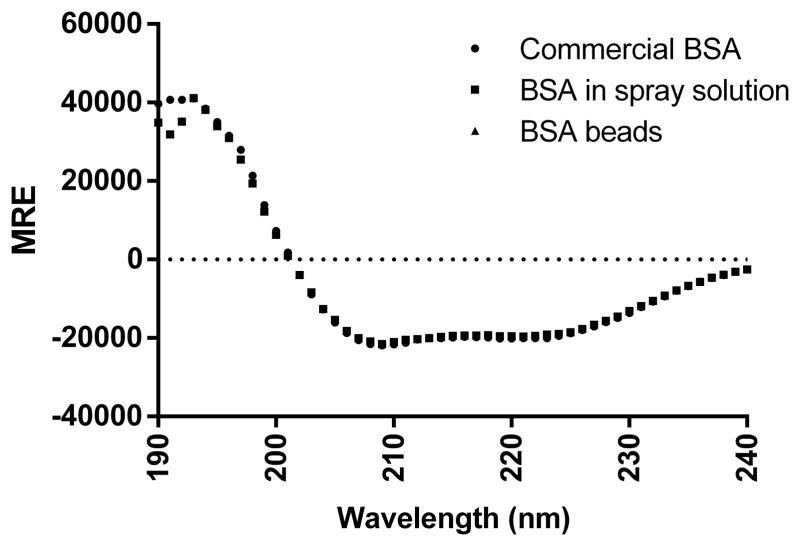
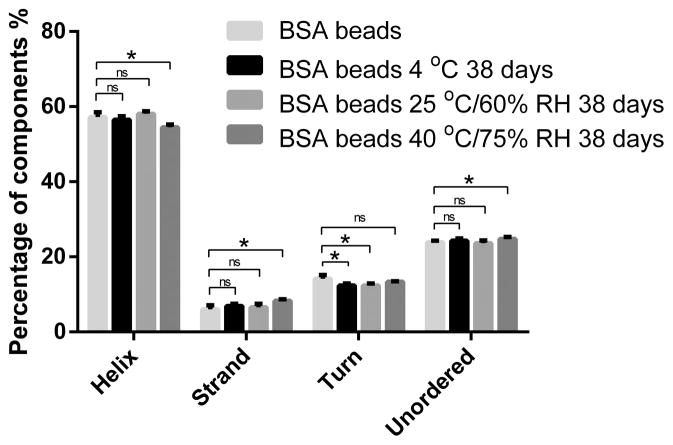
The far UV-CD spectrum of BSA was measured to study secondary structure changes. As shown in Figure 3A, both the spectra of commercial BSA and that in the reconstituted solution showed one positive band around 190 nm and two negative bands around 208 nm and 222 nm, which indicates the predominantly α–helix structure of BSA. Further deconvolution of CD spectrum using Dichroweb revealed that commercial and reconstituted BSA samples contained 57%–61% α–helix structure, which corresponds with known literature values (27, 50). The degradation or aggregation of protein could cause intensity change of CD spectrum or peak position shift (51). In a forced degradation study of BSA by Estey et al., BSA incubated in acidic media showed a loss of 13.7% α–helix structure (27). In another study, BSA was gradually heated up and it was found that half of the helicity was lost at 80°C and only 16% helicity was maintained at 130°C (52). As shown in Table II, further deconvolution revealed no significant helicity loss of BSA in spray solution or after spray layering. It’s not surprising to find that BSA maintained its secondary structure after spray layering, as the temperature of BSA on the surface of beads was lower than the product temperature which was controlled under 35°C during the process due to evaporative cooling.
Figure 3.
(A) Circular dichroism spectra of commercial BSA in water, BSA mixed with PVP30 in spray solution and BSA reconstituted right after spray layering. MRE stands for Mean Residue Ellipticity.
(B) Secondary structure components of BSA right after spray layering and after 38 days storage at 4 °C, 25 °C/60% RH and 40 °C/75% RH.
Table II.
Deconvolution Results of Far UV-CD of BSA in various samples (n=3)
| Helix | Strand | Turn | Unordered | |
|---|---|---|---|---|
| Commercial BSA | 60.3% ± 0.1% | 5.8% ± 0.3% | 10.8% ± 0.2% | 23.4% ± 0.5% |
| BSA in spray solution | 57.8% ± 1.8% | 6.8% ± 0.8% | 11.9% ± 0.7% | 24.3% ± 0.6% |
| BSA beads | 57.9% ± 1.6% | 7.1% ± 0.5% | 12.0% ± 0.7% | 23.2% ± 0.2% |
Note. The CD spectra were deconvoluted using Dichroweb. The results represent Mean ± SD.
After 38 days of storage at 40°C, as shown in Figure 3B, α-helix structure decreased while β-strand and unordered structure increased. During this time, BSA kept its secondary structure when stored at 4°C and 25°C while the secondary structure changed significantly when stored at 40°C. When we consider 40°C as an accelerated condition for room temperature storage, this data indicates that the spray layered BSA beads were stable at room temperature for at least one month but may not be stable when stored for a long term. A lower storage temperature like 2–8°C, or further optimization of the formulation, like adding additional excipients to stabilize the protein might give better storage stability of BSA beads.
Tertiary Structure of BSA
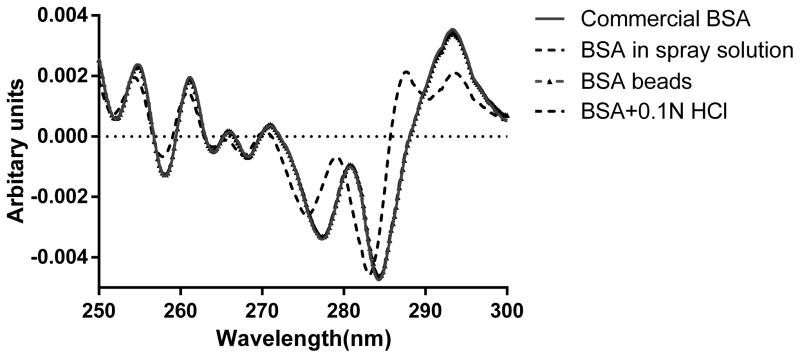
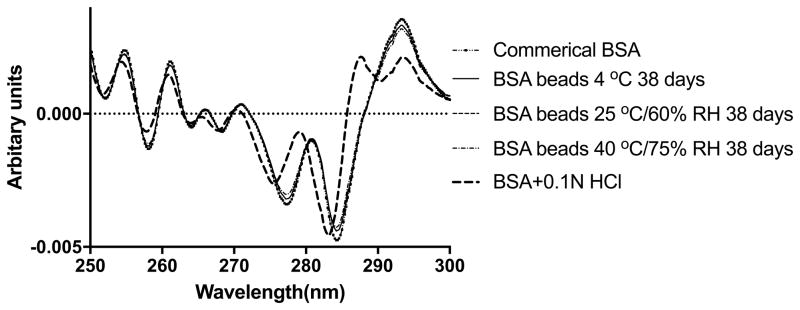
Derivative-UV spectrum of BSA was measured and calculated to probe the tertiary structure change. As shown in Figure 4A, the peaks around 277 nm and 284 nm were assigned to tyrosine and the combination of tyrosine and tryptophan, respectively (53). The position shift of these two peaks was believed to be sensitive to the micro-environment change of tyrosine and tryptophan (53, 54). As shown in Figure 4A, the spectra of commercial BSA, BSA in spray solution and BSA in the layered beads, were nearly superimposable, detailed interpolation of the spectra revealed minor shift of the peak position from 277.08 nm to 277.32 nm, from 284.10 to 284.26 nm after spray layering. Although the blue shift was significant as shown by student t test, the shift was only 0.23 nm and 0.16 nm, and it’s probably from the matrix effect that PVP decreased the solvent accessibility of BSA in solution. The acidic denatured BSA in 0.1N HCl was also shown in the graph as a negative control, which showed a large blue shift of both the peaks. Additionally, a third peak around 290 nm detected and was likely attributed to tryptophan (27). After 38 days storage stability study, there was no peak around 290 nm detected in the 2nd spectra of reconstituted BSA from 4 C beads, 25 C and 40 C (Figure 4B). A slight blue shift of two peaks was detected in the storage samples (Table III) implying minimal tertiary structure differences. Since a significant increase in aggregation was observed in SEC profiles, we hypothesize that part of the aggregation was formed through inter-molecular interaction, without perturbing the 3rd structure.
Figure 4.
(A) Secondary derivative UV-vis spectra of commercial BSA, BSA mixed with PVP30 in spray solution and reconstituted BSA right after spray layering.
(B) Secondary derivative UV-vis spectra of BSA right after spray layering and after 38 days storage at 4 °C, 25 °C/60% RH and 40 °C/75% RH.
Table III.
Second derivative UV-vis spectra peak positions of BSA samples (n=3)
| Peak 1 | SD | Peak 2 | SD | Peak 3 | SD | |
|---|---|---|---|---|---|---|
| Commercial BSA | 277.08 | 0.01 | 284.10 | 0.00 | NA | NA |
| BSA beads | 277.32 | 0.01 | 284.26 | 0.03 | NA | NA |
| BSA beads 4°C 38 d | 277.25 | 0.01 | 284.26 | 0.02 | NA | NA |
| BSA beads 25°C 38 d | 277.24 | 0.01 | 284.24 | 0.00 | NA | NA |
| BSA beads 40°C 38 d | 277.21 | 0.01 | 284.20 | 0.00 | NA | NA |
| BSA+0.1N HCl | 275.49 | 0.02 | 283.14 | 0.05 | 290.19 | 0.02 |
Enteric coating of BSA layered beads
The enteric coating of BSA layered beads was done with a commercially available coating system Eudragit® FS30D. The enteric coating is usually done at a relatively low temperature, for instance, the product temperature recommended for spraying aqueous dispersion of Eudragit® FS30D is 25 °C to 30 °C, which is below the first melting transition temperature of most therapeutic antibodies (55). In this study, the product temperature for spray coating was about 25–30 °C while the inlet temperature was about 35 °C, which was still much below the onset of unfolding temperature of BSA. Considering the evaporative cooling effects, the real temperature of BSA in the droplets was even lower than the product temperature during the process. Thus, we didn't expect protein structure change or activity loss during the 2 hour enteric coating process. The characterization of BSA after enteric coating herein was minimized. The emphasis was on the in vitro release of BSA from the enteric coated beads.
The colonic delivery of drugs is complicated due to the variable pH profiles and enzymatic environment in our GI tracts, it could be even more difficult for patients suffering from inflammatory diseases. Since most of CDI patients suffering from diarrhea, the GI transit time shortens dramatically from that of healthy human beings. Thus, the idea of adding sustained release feature to the delivery system could leads to little release of drug in the colon and limits the local drug concentration below the therapeutic window. However, we have to admit that the pH in the lower part of small intestine, especially in ileum could raise higher than 7.0 in some patients resulting in early release of drugs (56, 57).
SEM imaging of enteric coated BSA beads
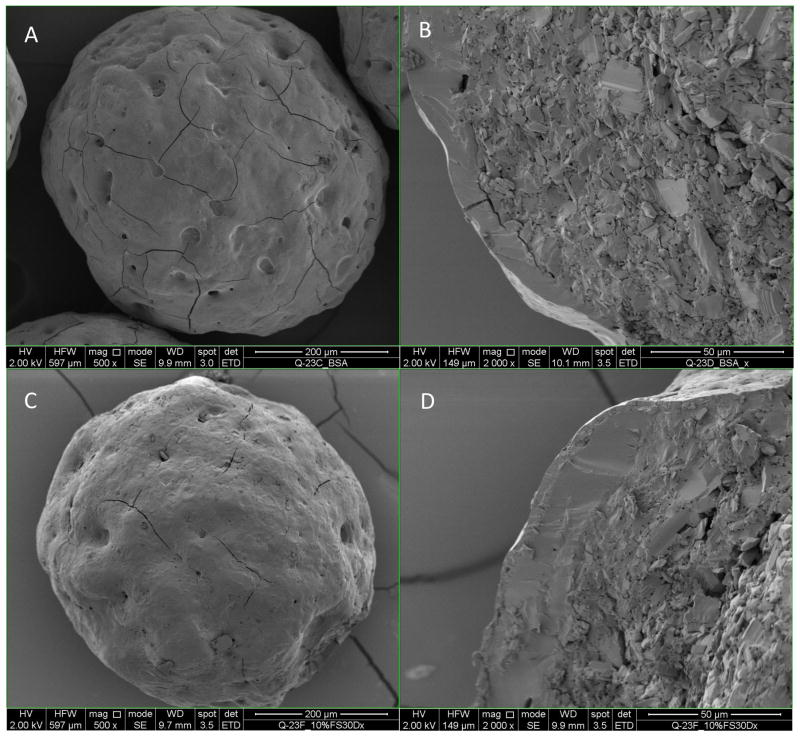
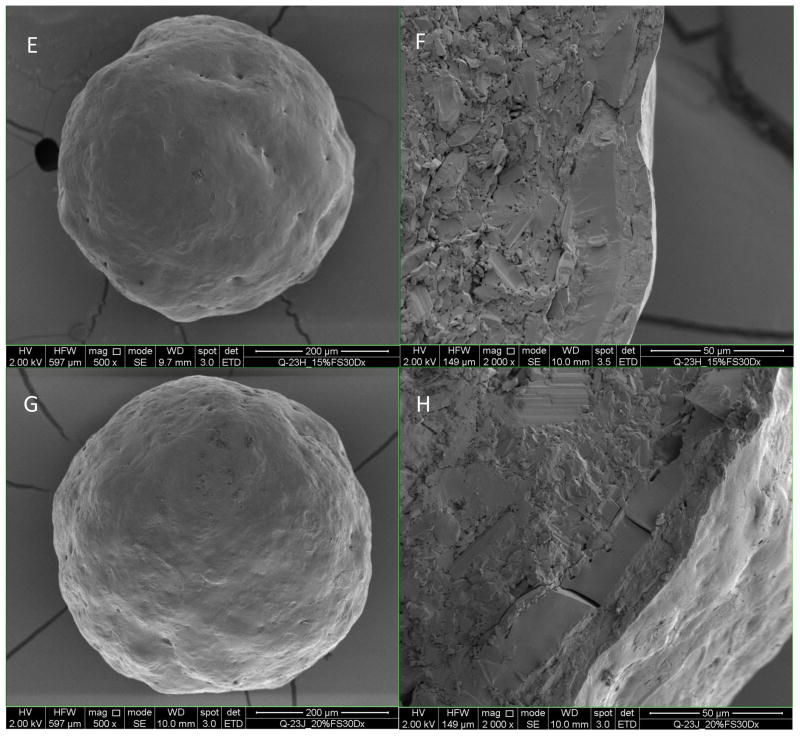
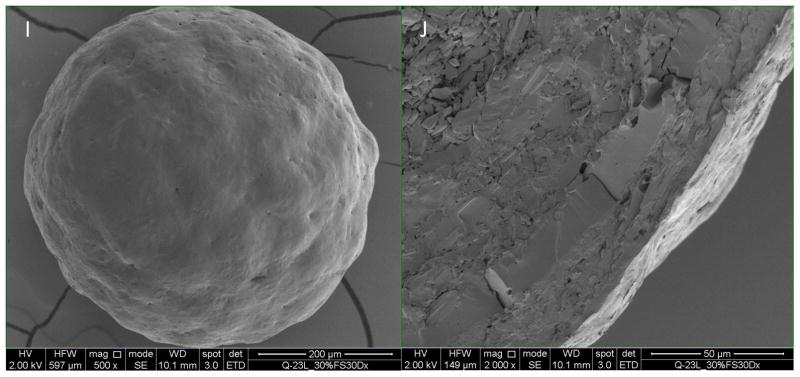
As shown in Figure 5A, the BSA layer showed some surface flaws such as pits and cracks. The 10% enteric coated BSA beads still had few of those pits and cracks (Figure 5C and 5D), and the coating thickness was determined to be 1.8 ± 1.5 μm (Table IV) with a Coefficient of Variation (CV) of 84.5%, which implied the insufficient coating thickness and heterogeneous coating. These flaws probably can account for the fast release of BSA from the beads in acidic media. When coating level increased to 15%, no cracks on the surface were observed and the surface became smoother (Figure 5E). The coating thickness increased to 5.7 ± 3.5 μm, while the CV improved to 61.2%. For 20% and 30% enteric coated BSA beads, the coating thickness increased to 13.0 ± 2.2 μm and 18.8 ± 1.9 μm respectively, while the CV improved to 17.1% and 10.4% respectively (Table IV), which suggested a thicker and more homogenous coating compared to 10% and 15% coating. The surface was smooth with no cracks or pits for 20% and 30% enteric coated BSA beads. From the SEM data we can conclude that with the increase of coating level, the coating thickness increase correspondingly and the coating homogeneity improved at the same time.
Figure 5.
Scanning Electron Microscope of enteric coated BSA beads. Figures A, C, E, G, I (magnification500x) on the left are the surface morphology of BSA layered beads, 10%, 15%, 20%, and 30% enteric coated BSA beads. Figures B, D, F, H and J on the right are the cross sections of beads on the left (magnification 2000x).
Table IV.
Thickness of enteric coating on BSA beads determined from SEM images (n=8)
| Thickness | Mean (μm) | SD (μm) | CV |
|---|---|---|---|
| 10% enteric coated BSA beads | 1.8 | 1.5 | 84.5% |
| 15% enteric coated BSA beads | 5.7 | 3.5 | 61.2% |
| 20% enteric coated BSA beads | 13.0 | 2.2 | 17.1% |
| 30% enteric coated BSA beads | 18.8 | 1.9 | 10.4% |
In vitro release of BSA from enteric coated beads
Ashford and Fell found that the pH of human GI tract increases from 1–2.5 (n=10) in the stomach to 7.49 (n=58) in the ileum, drops to 6.37 (n=66) in the ascending colon and increase to 7.04 (n=50) in the descending colon (57). According to USP, simulated gastric fluid (SGF) is 0.1 N HCl with a pH of 1.2 ± 0.05. Since the pH in intestine varies a lot among subjects, and may also be affected by the state of fasting or disease states, there is no “golden standard” for simulated intestinal fluid or simulated colonic fluid. In this study, we chose phosphate buffer with a pH of 6.8 and 7.4 to simulate the intestinal and colonic fluid, respectively (58–60). The gastric volume ranges from around 100 mL to more than 1000 mL due its variability, while the intestinal volume is approximately or lower than 100 mL most of the time (61–63). The main point of this study is to show the protein release in the intestine especially in the colon, so the media to simulate the GI fluid was chose as 100 mL buffer in a mini dissolution vessel.
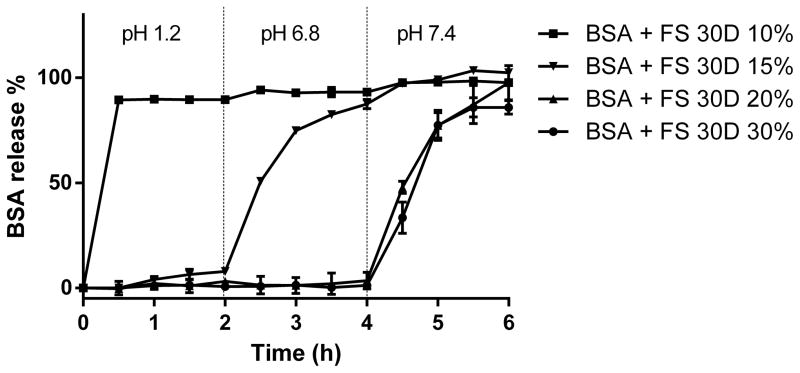
As shown in Figure 6, BSA beads coated with 10% Eudragit FS® 30D released completely by 30 mins in acidic media, which correlated with the observation of SEM images that the enteric film formed was not intact at 10% coating level. When the coating thick increased to 15%, it showed partial protection against drug release as 7.9% of BSA release by 2 hours, and more than 87.5% of BSA released by 4 hours. This might due to the heterogeneity of film thickness on different beads. The weight gain of 20% and 30% coating showed complete protection for BSA, since no BSA released in simulated gastric fluid and simulated small intestine fluid. There was no significant difference of BSA release in 20% and 30% weight gain beads based on an f2 score of 18.
Figure 6.
In vitro release of BSA from the multiparticulate delivery system with variable coating thickness. From 0–2 hour, the beads were in 0.1N HCl with a pH of 1.2, from 2–4 hour, the beads were in phosphate buffer pH 6.8, and from 4–6 hour, the beads were in phosphate buffer pH 7.4.
The dissolution media didn’t include the GI tract enzymes such as pepsin, trypsin, chymotrypsin, elastase, etc., which are responsible for the instability of protein and peptide drugs in the GI lumen (64). It was found that larger peptides/proteins were less stable compared to smaller peptides/proteins in SGF containing pepsin (65). However, since the Eudragit FS® 30D copolymer is unionized in gastric pH, the chance of BSA or other layered therapeutic proteins being cleaved by pepsin is low as long as they are enteric coated. The intestine is the place where most protein and peptide drugs are degraded. Yadav et al. found that Infliximab, an anti-TNF alpha monoclonal antibody (mAb) rapidly degraded in human intestinal fluid (HIF), and it was hypothesized that pancreatic proteases cleavage in hinge region leading to the fragmentation of Infliximab (66). It is possible for pH dependent release system to start releasing proteins early in the intestine, since the pH could rise above seven in middle and distal small intestine (56), which could expose the proteins to the pancreatic enzyme digestion. Yadav et al. also found several mAbs were more stable in the human colonic conditions. Despite the lower protease levels in colon and higher protein stability in the colon lumen (67), various protease inhibitors were proposed to be combined into the formulation to inactivate the specific enzymes(68, 69). It would be interesting to conduct further studies on the compatibility of therapeutic proteins with protease inhibitors in the dosage forms.
6. Conclusions
Spray layering of BSA followed by enteric coating showed the potential for in vitro colonic delivery of BSA. BSA as a model protein in this study preserved its structure immediately after spray layering, but formed significant aggregation after a 38 days accelerated stability study. Further formulation of the spray solution is required to optimize the storage stability of BSA at room temperature by adding stabilizing excipients. Colonic delivery systems for proteins have a high risk of failure because of the complicated pH profile, enzyme environment in GI tract and variability between individuals, which emphasizes the importance of combining the beads with different release profile and in vivo evaluation of the colonic delivery system. In this work we showed that by coating BSA layered beads with enteric polymers to different weight gains, we were able to achieve various release profiles of BSA from the beads. The development of this multi-particulate system with an active therapeutic protein and in vivo release in animal models is currently under investigation in our group.
Acknowledgments
This study was supported by a grant from National Institute of Health (U19-AI109776). The authors would like to acknowledge Electron Microscopy Core Imaging Facility of University Maryland Baltimore for the help with SEM images.
Abbreviation
- CDI
Clostridium difficile infection
- BSA
Bovine serum albumin
- ICH
International Council for Harmonization
- USP
United States Pharmacopeia
- GI
Gastrointestinal
- rhDNase
Recombinant human deoxyribonuclease
- CQA
Critical Quality Attributes
- CD
Circular dichroism
- RH
Relative humidity
- SEM
Scanning electron microscope
- MCC
Microcrystalline cellulose
Footnotes
Disclosure
This work is in partial fulfillment of Ph.D requirement for Bowen Jiang. A patent generated from this work and other relevant work is pending. Dr. Hanping Feng is the co-founder of FZata, Inc.
References
- 1.Walsh G. Biopharmaceutical benchmarks 2014. Nat Biotechnol. 2014;32:992–1000. doi: 10.1038/nbt.3040. [DOI] [PubMed] [Google Scholar]
- 2.Ecker DM, Jones SD, Levine HL. The therapeutic monoclonal antibody market. mAbs. 2015;7:9–14. doi: 10.4161/19420862.2015.989042. [DOI] [PMC free article] [PubMed] [Google Scholar]
- 3.Leader B, Baca QJ, Golan DE. Protein therapeutics: a summary and pharmacological classification. Nat Rev Drug Discov. 2008;7:21–39. doi: 10.1038/nrd2399. [DOI] [PubMed] [Google Scholar]
- 4.Kim TH, Park YH, Kim KJ, Cho CS. Release of albumin from chitosan-coated pectin beads in vitro. Int J Pharm. 2003;250:371–383. doi: 10.1016/s0378-5173(02)00553-7. [DOI] [PubMed] [Google Scholar]
- 5.Xing L, Dawei C, Liping X, Rongqing Z. Oral colon-specific drug delivery for bee venom peptide: development of a coated calcium alginate gel beads-entrapped liposome. J Control Release. 2003;93:293–300. doi: 10.1016/j.jconrel.2003.08.019. [DOI] [PubMed] [Google Scholar]
- 6.Zhang S, Xing P, Guo G, Liu H, Lin D, Dong C, Li M, Feng D. Development of microbeads of chicken yolk antibodies against Clostridium difficile toxin A for colonic-specific delivery. Drug Deliv. 2015:1–8. doi: 10.3109/10717544.2015.1022836. [DOI] [PubMed] [Google Scholar]
- 7.Abdul-Fattah AM, Kalonia DS, Pikal MJ. The challenge of drying method selection for protein pharmaceuticals: product quality implications. J Pharm Sci. 2007;96:1886–1916. doi: 10.1002/jps.20842. [DOI] [PubMed] [Google Scholar]
- 8.Maltesen MJ, van de Weert M. Drying methods for protein pharmaceuticals. Drug Discov Today Technol. 2008;5:e81–88. doi: 10.1016/j.ddtec.2008.11.001. [DOI] [PubMed] [Google Scholar]
- 9.Dey NS, Majumadar S, Rao MEB. Multiparticulate Drug Delivery Systems for Controlled Release. Tropical Journal of Pharmaceutical Research. 2008;7:1067–1075. [Google Scholar]
- 10.Abdul S, Chandewar AV, Jaiswal SB. A flexible technology for modified-release drugs: Multiple-unit pellet system (MUPS) J Controlled Release. 2010;147:2–16. doi: 10.1016/j.jconrel.2010.05.014. [DOI] [PubMed] [Google Scholar]
- 11.Maa YF, Hsu CC. Feasibility of protein spray coating using a fluid-bed Wurster processor. Biotechnol Bioeng. 1997;53:560–566. doi: 10.1002/(SICI)1097-0290(19970320)53:6<560::AID-BIT3>3.0.CO;2-K. [DOI] [PubMed] [Google Scholar]
- 12.Maa YF, Nguyen PA, Hsu CC. Spray-coating of rhDNase on lactose: effect of system design, operational parameters and protein formulation. Int J Pharm. 1996;144:47–59. [Google Scholar]
- 13.Potesta P. Eudragit FS 30 D: a new pH-sensitive polymer covering for mesalamine. Eur Rev Med Pharmacol Sci. 2001;5:30. [PubMed] [Google Scholar]
- 14.Gao C, Huang J, Jiao Y, Shan L, Liu Y, Li Y, Mei X. In vitro release and in vivo absorption in beagle dogs of meloxicam from Eudragit FS 30 D-coated pellets. Int J Pharm. 2006;322:104–112. doi: 10.1016/j.ijpharm.2006.05.035. [DOI] [PubMed] [Google Scholar]
- 15.Kaledaite R, Bernatoniene J, Dvorackova K, Gajdziok J, Muselik J, Peciura R, Masteikova R. The development and in vitro evaluation of herbal pellets coated with Eudragit FS 30. Pharm Dev Technol. 2014:1–6. doi: 10.3109/10837450.2014.920355. [DOI] [PubMed] [Google Scholar]
- 16.Michnik A. Thermal stability of bovine serum albumin DSC study. Journal of thermal analysis and calorimetry. 2003;71:509–519. [Google Scholar]
- 17.Whitmore L, Wallace BA. DICHROWEB, an online server for protein secondary structure analyses from circular dichroism spectroscopic data. Nucleic Acids Res. 2004;32:W668–673. doi: 10.1093/nar/gkh371. [DOI] [PMC free article] [PubMed] [Google Scholar]
- 18.Whitmore L, Wallace BA. Protein secondary structure analyses from circular dichroism spectroscopy: Methods and reference databases. Biopolymers. 2008;89:392–400. doi: 10.1002/bip.20853. [DOI] [PubMed] [Google Scholar]
- 19.EIAG. Colon targeting with PlasACRYL T20 as anti-tacking agent [Google Scholar]
- 20.Schneider CA, Rasband WS, Eliceiri KW. NIH Image to ImageJ: 25 years of image analysis. Nat Methods. 2012;9:671–675. doi: 10.1038/nmeth.2089. [DOI] [PMC free article] [PubMed] [Google Scholar]
- 21.Shire SJ. Formulation and manufacturability of biologics. Curr Opin Biotechnol. 2009;20:708–714. doi: 10.1016/j.copbio.2009.10.006. [DOI] [PubMed] [Google Scholar]
- 22.Kozlowski S, Swann P. Current and future issues in the manufacturing and development of monoclonal antibodies. Adv Drug Delivery Rev. 2006;58:707–722. doi: 10.1016/j.addr.2006.05.002. [DOI] [PubMed] [Google Scholar]
- 23.van de Weert M, Haris PI, Hennink WE, Crommelin DJ. Fourier transform infrared spectrometric analysis of protein conformation: effect of sampling method and stress factors. Anal Biochem. 2001;297:160–169. doi: 10.1006/abio.2001.5337. [DOI] [PubMed] [Google Scholar]
- 24.Kelly SM, Jess TJ, Price NC. How to study proteins by circular dichroism. Biochimica et Biophysica Acta (BBA)-Proteins and Proteomics. 2005;1751:119–139. doi: 10.1016/j.bbapap.2005.06.005. [DOI] [PubMed] [Google Scholar]
- 25.Zheng K, Laurence JS, Kuczera K, Verkhivker G, Middaugh CR, Siahaan TJ. Characterization of multiple stable conformers of the EC5 domain of E-cadherin and the interaction of EC5 with E-cadherin peptides. Chem Biol Drug Des. 2009;73:584–598. doi: 10.1111/j.1747-0285.2009.00818.x. [DOI] [PMC free article] [PubMed] [Google Scholar]
- 26.Havel HA, Chao RS, Haskell RJ, Thamann TJ. Investigations of protein structure with optical spectroscopy: bovine growth hormone. Anal Chem. 1989;61:642–650. doi: 10.1021/ac00182a002. [DOI] [PubMed] [Google Scholar]
- 27.Estey T, Kang J, Schwendeman SP, Carpenter JF. BSA degradation under acidic conditions: A model for protein instability during release from PLGA delivery systems. J Pharm Sci. 2006;95:1626–1639. doi: 10.1002/jps.20625. [DOI] [PubMed] [Google Scholar]
- 28.Weijers RN. Amino acid sequence in bovine serum albumin. Clin Chem. 1977;23:1361–1362. [PubMed] [Google Scholar]
- 29.Wada Y. Primary sequence and glycation at lysine-548 of bovine serum albumin. J Mass Spectrom. 1996;31:263–266. doi: 10.1002/(SICI)1096-9888(199603)31:3<263::AID-JMS292>3.0.CO;2-2. [DOI] [PubMed] [Google Scholar]
- 30.Reed RG, Putnam FW, Peters T., Jr Sequence of residues 400--403 of bovine serum albumin. Biochem J. 1980;191:867–868. doi: 10.1042/bj1910867. [DOI] [PMC free article] [PubMed] [Google Scholar]
- 31.Benjamin DC, Teale JM. The antigenic structure of bovine serum albumin. Evidence for multiple, different, domain-specific antigenic determinants. J Biol Chem. 1978;253:8087–8092. [PubMed] [Google Scholar]
- 32.Militello V, Vetri V, Leone M. Conformational changes involved in thermal aggregation processes of bovine serum albumin. Biophys Chem. 2003;105:133–141. doi: 10.1016/s0301-4622(03)00153-4. [DOI] [PubMed] [Google Scholar]
- 33.Huang BX, Kim HY, Dass C. Probing three-dimensional structure of bovine serum albumin by chemical cross-linking and mass spectrometry. J Am Soc Mass Spectrom. 2004;15:1237–1247. doi: 10.1016/j.jasms.2004.05.004. [DOI] [PubMed] [Google Scholar]
- 34.Shanmugam G, Polavarapu PL. Vibrational circular dichroism spectra of protein films: thermal denaturation of bovine serum albumin. Biophys Chem. 2004;111:73–77. doi: 10.1016/j.bpc.2004.04.005. [DOI] [PubMed] [Google Scholar]
- 35.Barreca D, Lagana G, Ficarra S, Tellone E, Leuzzi U, Magazu S, Galtieri A, Bellocco E. Anti-aggregation properties of trehalose on heat-induced secondary structure and conformation changes of bovine serum albumin. Biophys Chem. 2010;147:146–152. doi: 10.1016/j.bpc.2010.01.010. [DOI] [PubMed] [Google Scholar]
- 36.Majorek KA, Porebski PJ, Dayal A, Zimmerman MD, Jablonska K, Stewart AJ, Chruszcz M, Minor W. Structural and immunologic characterization of bovine, horse, and rabbit serum albumins. Mol Immunol. 2012;52:174–182. doi: 10.1016/j.molimm.2012.05.011. [DOI] [PMC free article] [PubMed] [Google Scholar]
- 37.Bhattacharya M, Jain N, Mukhopadhyay S. Insights into the Mechanism of Aggregation and Fibril Formation from Bovine Serum Albumin. Journal of Physical Chemistry B. 2011;115:4195–4205. doi: 10.1021/jp111528c. [DOI] [PubMed] [Google Scholar]
- 38.Rombouts I, Lagrain B, Scherf KA, Koehler P, Delcour JA. Formation and reshuffling of disulfide bonds in bovine serum albumin demonstrated using tandem mass spectrometry with collision-induced and electron-transfer dissociation. Sci Rep. 2015;5:12210. doi: 10.1038/srep12210. [DOI] [PMC free article] [PubMed] [Google Scholar]
- 39.Philo JS, Arakawa T. Mechanisms of Protein Aggregation. Curr Pharm Biotechnol. 2009;10:348–351. doi: 10.2174/138920109788488932. [DOI] [PubMed] [Google Scholar]
- 40.Roberts CJ. Therapeutic protein aggregation: mechanisms, design, and control. Trends Biotechnol. 2014;32:372–380. doi: 10.1016/j.tibtech.2014.05.005. [DOI] [PMC free article] [PubMed] [Google Scholar]
- 41.West AP, Galimidi RP, Foglesong CP, Gnanapragasam PNP, Huey-Tubman KE, Klein JS, Suzuki MD, Tiangco NE, Vielmetter J, Bjorkman PJ. Design and Expression of a Dimeric Form of Human Immunodeficiency Virus Type 1 Antibody 2G12 with Increased Neutralization Potency. J Virol. 2009;83:98–104. doi: 10.1128/JVI.01564-08. [DOI] [PMC free article] [PubMed] [Google Scholar]
- 42.Rosenberg AS. Effects of protein aggregates: an immunologic perspective. AAPS J. 2006;8:E501–507. doi: 10.1208/aapsj080359. [DOI] [PMC free article] [PubMed] [Google Scholar]
- 43.Philo JS. Is any measurement method optimal for all aggregate sizes and types? AAPS J. 2006;8:E564–E571. doi: 10.1208/aapsj080365. [DOI] [PMC free article] [PubMed] [Google Scholar]
- 44.Jiang B, Ibrahim A, Shi L, Feng H, Hoag S. Optimization of a Small Batch Coating Process in Huttlin Fluid Bed System by Fractional Factorial Design. American Association of Pharmaceutical Scientists Annual Meeting and Exposition; San Diego. 2014. [Google Scholar]
- 45.Kato Y, Matsuda T, Kato N, Nakamura R. Browning and Protein Polymerization Induced by Amino Carbonyl Reaction of Ovalbumin with Glucose and Lactose. J Agric Food Chem. 1988;36:806–809. [Google Scholar]
- 46.Bowen M, Turok R, Maa YF. Spray Drying of Monoclonal Antibodies: Investigating Powder-Based Biologic Drug Substance Bulk Storage. Drying Technology. 2013;31:1441–1450. [Google Scholar]
- 47.Mumenthaler M, Hsu CC, Pearlman R. Feasibility Study on Spray-Drying Protein Pharmaceuticals - Recombinant Human Growth-Hormone and Tissue-Type Plasminogen-Activator. Pharm Res. 1994;11:12–20. doi: 10.1023/a:1018929224005. [DOI] [PubMed] [Google Scholar]
- 48.Hawe A, Hulse WL, Jiskoot W, Forbes RT. Taylor Dispersion Analysis Compared to Dynamic Light Scattering for the Size Analysis of Therapeutic Peptides and Proteins and Their Aggregates. Pharm Res. 2011;28:2302–2310. doi: 10.1007/s11095-011-0460-3. [DOI] [PMC free article] [PubMed] [Google Scholar]
- 49.Li Y, Yang G, Mei Z. Spectroscopic and dynamic light scattering studies of the interaction between pterodontic acid and bovine serum albumin. Acta Pharmaceutica Sinica B. 2012;2:53–59. [Google Scholar]
- 50.Carter DC, Ho JX. Structure of Serum-Albumin. Advances in Protein Chemistry. 1994;45:153–203. doi: 10.1016/s0065-3233(08)60640-3. [DOI] [PubMed] [Google Scholar]
- 51.Joshi V, Shivach T, Yadav N, Rathore AS. Circular Dichroism Spectroscopy as a Tool for Monitoring Aggregation in Monoclonal Antibody Therapeutics. Anal Chem. 2014;86:11606–11613. doi: 10.1021/ac503140j. [DOI] [PubMed] [Google Scholar]
- 52.Moriyama Y, Watanabe E, Kobayashi K, Harano H, Inui E, Takeda K. Secondary Structural Change of Bovine Serum Albumin in Thermal Denaturation up to 130 degrees C and Protective Effect of Sodium Dodecyl Sulfate on the Change. Journal of Physical Chemistry B. 2008;112:16585–16589. doi: 10.1021/jp8067624. [DOI] [PubMed] [Google Scholar]
- 53.Mach H, Middaugh CR. Simultaneous monitoring of the environment of tryptophan, tyrosine, and phenylalanine residues in proteins by near-ultraviolet second-derivative spectroscopy. Anal Biochem. 1994;222:323–331. doi: 10.1006/abio.1994.1499. [DOI] [PubMed] [Google Scholar]
- 54.Nie H, Mo H, Zhang M, Song Y, Fang K, Taylor LS, Li T, Byrn SR. Investigating the Interaction Pattern and Structural Elements of a Drug-Polymer Complex at the Molecular Level. Mol Pharm. 2015;12:2459–2468. doi: 10.1021/acs.molpharmaceut.5b00162. [DOI] [PubMed] [Google Scholar]
- 55.Ionescu RM, Vlasak J, Price C, Kirchmeier M. Contribution of variable domains to the stability of humanized IgG1 monoclonal antibodies. J Pharm Sci. 2008;97:1414–1426. doi: 10.1002/jps.21104. [DOI] [PubMed] [Google Scholar]
- 56.Evans DF, Pye G, Bramley R, Clark AG, Dyson TJ, Hardcastle JD. Measurement of gastrointestinal pH profiles in normal ambulant human subjects. Gut. 1988;29:1035–1041. doi: 10.1136/gut.29.8.1035. [DOI] [PMC free article] [PubMed] [Google Scholar]
- 57.Ashford M, Fell JT. Targeting drugs to the colon: delivery systems for oral administration. J Drug Target. 1994;2:241–257. doi: 10.3109/10611869408996806. [DOI] [PubMed] [Google Scholar]
- 58.Mura P, Maestrelli F, Cirri M, Gonzalez Rodriguez ML, Rabasco Alvarez AM. Development of enteric-coated pectin-based matrix tablets for colonic delivery of theophylline. J Drug Target. 2003;11:365–371. doi: 10.1080/10611860310001639130. [DOI] [PubMed] [Google Scholar]
- 59.Alvarez-Fuentes J, Fernandez-Arevalo M, Gonzalez-Rodriguez ML, Cirri M, Mura P. Development of enteric-coated timed-release matrix tablets for colon targeting. J Drug Target. 2004;12:607–612. doi: 10.1080/10611860400013501. [DOI] [PubMed] [Google Scholar]
- 60.Cole ET, Scott RA, Connor AL, Wilding IR, Petereit HU, Schminke C, Beckert T, Cade D. Enteric coated HPMC capsules designed to achieve intestinal targeting. Int J Pharm. 2002;231:83–95. doi: 10.1016/s0378-5173(01)00871-7. [DOI] [PubMed] [Google Scholar]
- 61.Ong BY, Palahniuk RJ, Cumming M. Gastric volume and pH in out-patients. Can Anaesth Soc J. 1978;25:36–39. doi: 10.1007/BF03006781. [DOI] [PubMed] [Google Scholar]
- 62.Ferrua M, Singh R. Modeling the fluid dynamics in a human stomach to gain insight of food digestion. J Food Sci. 2010;75:R151–R162. doi: 10.1111/j.1750-3841.2010.01748.x. [DOI] [PMC free article] [PubMed] [Google Scholar]
- 63.Schiller C, Frohlich CP, Giessmann T, Siegmund W, Monnikes H, Hosten N, Weitschies W. Intestinal fluid volumes and transit of dosage forms as assessed by magnetic resonance imaging. Aliment Pharmacol Ther. 2005;22:971–979. doi: 10.1111/j.1365-2036.2005.02683.x. [DOI] [PubMed] [Google Scholar]
- 64.Wang J, Yadav V, Smart AL, Tajiri S, Basit AW. Toward oral delivery of biopharmaceuticals: an assessment of the gastrointestinal stability of 17 peptide drugs. Mol Pharm. 2015;12:966–973. doi: 10.1021/mp500809f. [DOI] [PubMed] [Google Scholar]
- 65.Smart AL, Gaisford S, Basit AW. Oral peptide and protein delivery: intestinal obstacles and commercial prospects. Expert Opin Drug Deliv. 2014;11:1323–1335. doi: 10.1517/17425247.2014.917077. [DOI] [PubMed] [Google Scholar]
- 66.Yadav V, Varum F, Bravo R, Furrer E, Basit AW. Gastrointestinal stability of therapeutic anti-TNF alpha IgG1 monoclonal antibodies. Int J Pharm. 2016;502:181–187. doi: 10.1016/j.ijpharm.2016.02.014. [DOI] [PubMed] [Google Scholar]
- 67.Wang J, Yadav V, Smart AL, Tajiri S, Basit AW. Stability of peptide drugs in the colon. Eur J Pharm Sci. 2015;78:31–36. doi: 10.1016/j.ejps.2015.06.018. [DOI] [PubMed] [Google Scholar]
- 68.Patel MM. Colon targeting: an emerging frontier for oral insulin delivery. Expert Opin Drug Deliv. 2013;10:731–739. doi: 10.1517/17425247.2013.782284. [DOI] [PubMed] [Google Scholar]
- 69.Yamamoto A, Taniguchi T, Rikyuu K, Tsuji T, Fujita T, Murakami M, Muranishi S. Effects of various protease inhibitors on the intestinal absorption and degradation of insulin in rats. Pharm Res. 1994;11:1496–1500. doi: 10.1023/a:1018968611962. [DOI] [PubMed] [Google Scholar]


