

Abstract
Background and Purpose
Pancreatic cancer is a solid tumour that is often fatal. Hence, there is an urgent need to identify new drug targets for this disease. Highly proliferating cancer cells have an increased demand for nutrients and, therefore, need to up‐regulate selective amino acid transporters. Here, we investigated which amino acid transporters are up‐regulated in pancreatic cancer and whether any of these transporters has potential as a drug target for this fatal disease.
Experimental Approach
The expression of amino acid transporters in pancreatic cancer was analysed using publicly available microarray datasets, and the findings with the transporter SLC6A14 were validated by mRNA and protein analysis. The potential of SLC6A14 as a drug target was evaluated using a pharmacological blocker in vitro and in vivo.
Key Results
SLC6A14 was up‐regulated several fold in patient‐derived xenografts, primary tumour tissues and pancreatic cancer cells lines compared to normal pancreatic tissue or normal pancreatic epithelial cells. The magnitude of the up‐regulation of SLC6A14 was the highest among the amino acid transporters examined. A pharmacological blocker of SLC6A14, α‐methyltryptophan, induced amino acid starvation in pancreatic cancer cells and reduced the growth and proliferation of these cells, both in vitro and in vivo.
Conclusion and Implications
The salient features of this study are that SLC6A14 is markedly up‐regulated in pancreatic cancer and that pharmacological blockade of this transporter interferes with amino acid nutrition and reduces growth and proliferation of pancreatic cancer cells. These findings identify SLC6A14 as a novel druggable target for pancreatic cancer.
Abbreviations
- ASNS
asparagine synthetase
- ATB0,+
(SLC6A14) amino acid transporter B0,+
- CHOP
CCAAT/enhancer‐binding protein homologous protein
- HIF‐1α
hypoxia‐inducible factor‐1α
- mTORC1
mechanistic target of rapamycin complex 1
- SLC
solute‐linked carrier
- xCT
catalytic subunit of the cysteine/glutamate exchanger xc −
- α‐MT
α‐methyltryptophan
Table of Links
| TARGETS | |
|---|---|
| Enzymes a | Transporters b |
| HIF‐1α | SLC1A5/ASCT2 |
| S6 kinase | SLC6A14/ATB0,+ |
| SLC7A11/xCT | |
| SLC7A5/LAT1 |
This Table lists key protein targets in this article which are hyperlinked to corresponding entries in http://www.guidetopharmacology.org, the common portal for data from the IUPHAR/BPS Guide to PHARMACOLOGY (Southan et al., 2016) and are permanently archived in the Concise Guide to PHARMACOLOGY 2015/16 (a,bAlexander et al., 2015a,b).
Introduction
Pancreatic cancer is a difficult‐to‐treat cancer and is often fatal, as it is characterized by the absence of early symptoms, hence it is only diagnosed at an advanced stage. Despite continuous research and efforts directed at the early detection and treatment, prognosis remains dismal. Surgical resection is a potential approach for cure, but due to its late diagnosis, 50% of the patients with the disease are already at a metastatic stage, leaving many patients with no clinical benefit through surgery (Ying et al., 2012). As such, chemotherapy is the only choice, and currently, gemcitabine combined with a taxane is often used as the first‐line treatment for most patients. However, a large number of patients do not respond to gemcitabine due to intrinsic or acquired chemoresistance (Andersson et al., 2009). This calls for a better understanding of the primary drivers of this cancer that can aid in the development of novel and effective drugs to treat this deadly disease.
Tumours alter their metabolism to meet the increasing anabolic requirements of their rapidly proliferating cells (Ward and Thompson, 2012). Enhanced cell proliferation results in an increased demand for nutrients (Ganapathy et al., 2009). The well‐recognized increase in glucose uptake may comprise only a part of the tumour's metabolic story because cancer cells also have a unique metabolic demand for amino acids. Selective amino acid transporters have been reported to be up‐regulated in cancer in response to this increased demand. These tumour‐selective amino acid transporters are logical druggable targets for cancer therapy. Pharmacological blockade of these up‐regulated transporters would lead to cell death selectively in tumour cells by depriving them of amino acids, an obligatory group of essential nutrients for cell survival and growth. Three such transporters have been identified to demonstrate tumour‐selective up‐regulation; these are SLC1A5/ASCT2, SLC7A5/LAT1 and SLC7A11/xCT (Nicklin et al., 2009; Ishimoto et al., 2011; Timmerman et al., 2013). Our own studies have identified another amino acid transporter, SLC6A14/ATB0 ,+, that is up‐regulated in cervical cancer (Gupta et al., 2006), colorectal cancer (Gupta et al., 2005) and oestrogen receptor‐positive breast cancer (Karunakaran et al., 2008). Also we have shown that pharmacological blockade of this transporter with α‐methyltryptophan (α‐MT) effectively reduces the growth of oestrogen receptor‐positive breast cancer cells not only in vitro but also in vivo when xenografted into immunocompromised mice (Karunakaran et al., 2011).
The mammalian genome encodes several amino acid transporters with varying substrate selectivity and functional features (Ganapathy et al., 2004; Ganapathy and Ganapathy, 2005; Ganapathy, 2012). The four transporters that have received attention thus far for their potential role in cancer, namely SLC1A5, SLC7A5, SLC7A11 and SLC6A14, have marked differences in terms of their amino acid specificity and their capacity to concentrate their substrates inside cells (Bhutia et al., 2014; 2015; Bhutia and Ganapathy, 2015). SLC1A5 only transports alanine, serine, cysteine, threonine, glutamine and asparagine; SLC7A5 transports almost all neutral amino acids; SLC7A11 only transports glutamate and the disulfide amino acid cystine; SLC6A14 transports all neutral amino acids as well as the cationic amino acids lysine and arginine. Thus, among the four transporters, SLC6A14 has the most broad substrate selectivity. Furthermore, SLC1A5, SLC7A5 and SLC7A11 are obligatory amino acid exchangers as opposed to SLC6A14, which is concentrative in nature; its transport function is energized by three different driving forces: an Na+ gradient, a Cl− gradient and the membrane potential. Theoretically, this transporter has the ability to concentrate its substrates inside the cells ~1000‐fold compared with the extracellular medium. As such, SLC6A14 is ideally suited for satisfying the increased demands of tumour cells for amino acids.
Despite the fact that no targeted therapies are available for pancreatic cancer, neither the expression status of amino acid transporters nor their relevance and potential as therapeutic targets in pancreatic cancer have been investigated. With this in mind and, also, in view of the evidence available for selective amino acid transporters as possible drug targets in other cancers, the present study was undertaken to investigate the role of amino acid transporters and their potential as druggable targets in pancreatic cancer.
Methods
Cell culture
The pancreatic cancer cell lines (BxPC‐3, Capan‐1, Capan‐2) and the normal pancreatic cell line (hTERT‐HPNE) were obtained from ATCC. These cell lines were used within 10–20 passages. The ATCC has done morphological, cytogenetic and DNA profile analyses for characterization of these cell lines. AsPC‐1, MIA PaCa‐2 and PANC‐1 cell lines were obtained from Dr Raj Govindarajan (Ohio State University, Columbus, OH). These cell lines were also handled as described above. The human pancreatic ductal epithelial cell line (HPDE) was kindly provided by Dr Ming Tsao, Ontario Cancer Institute (Toronto, Canada). AsPC‐1 and BxPC‐3 cells were grown in RPMI‐1640 medium, supplemented with 10% FBS and subcultured at a 1:5 ratio. hTERT‐HPNE cells were maintained in 75% DMEM without glucose plus 25% Medium M3 Base with the following additives: 5% FBS, 5.5 mM D‐glucose, 10 ng mL−1 human recombinant epidermal growth factor, and 750 ng mL−1 puromycin and subcultured at a ratio of 1:4. HPDE cells were cultured in Keratinocyte serum‐free media supplemented with epidermal growth factor and bovine pituitary extract and subcultured at a 1:4 ratio. MIA PaCa‐2 and PANC‐1 cells were cultured in DMEM, supplemented with 10% FBS, and subcultured at a ratio of 1:8. Capan‐1 cells were cultured in Iscove's DMEM containing 20% FBS and subcultured at a ratio of 1:3. Capan‐2 cells were cultured in McCoy's 5 A medium, modified and supplemented with 10% FBS and subcultured at a ratio of 1:4. All media for the above cell lines except HPDE (Fisher Scientific, Waltham, MA, USA) and HPNE (Incell Corporation LLC, San Antonio, TX, USA) were purchased from Mediatech (Manassas, VA, USA) and were supplemented with 100 U mL−1 penicillin and 2 μg mL−1 streptomycin.
Gene expression omnibus database analysis
All eight datasets, GSE19650 (Hiraoka et al., 2011), GSE15471 (Badea et al., 2008, GSE16515 (Pei et al., 2009), GSE28735 (Zhang et al., 2013), GSE32676 (Donahue et al., 2012), GSE19279 (Barry et al., 2013), GSE39751 and GSE43288 (Crnogorac‐Jurcevic et al., 2013), were downloaded from the gene expression omnibus (GEO) database. Original methods from the data contributors were used to normalize the data. For each dataset, the tumour and the normal groups were compared using Student's t‐test, and a P value of <0.05 was considered statistically significant.
RNA isolation and real‐time PCR
RNA was isolated from cells using the Trizol method. The expression of the various genes was analysed using real‐time PCR. RNA samples from normal pancreatic tissues and from pancreatic tumour tissues were obtained from Asterand (Detroit, MI, USA). After the RNA had been isolated, its concentration was measured using a Noanodrop ND‐1000 system, followed by cDNA synthesis using a high capacity cDNA synthesis kit (Invitrogen, Grand Island, NY, USA). Relative mRNA levels were measured with a SYBR Green detection system using the StepOnePlus real‐time PCR system (Applied Biosystems, Foster City, CA, USA). The samples were all measured in triplicates. The relative level of each gene was calculated by normalizing the cycle threshold (Ct) value of the gene being studied to that of the housekeeping gene [hypoxanthine‐guanine phosphoribosyltransferase‐1 (HPRT1)]. The following PCR primers were used: SLC6A14 forward: 5′‐GAAGGAGAAAGTGTCGGCTTCA‐3′ and reverse: 5′‐TACCACCTTGCCAGACGATTTG‐3′; asparagine synthetase (ASNS) forward: 5′‐GCACGCCCTCTATGACAATG‐3′ and reverse: 5′‐CTCACTCTCCTCGGCTTT −3′; CCAAT/enhancer‐binding protein homologous protein (CHOP) forward: 5′‐GAGAACCAGGAAACGGAAAC −3′ and reverse: 5′‐GCAGATTCACCATTCGGTC −3′; and HPRT1 forward: 5′‐GCGTCGTTAGCGATGATGAAC −3′ and reverse: 5′‐ CCTCCCATCTCCTTCATGACATCT‐3′.
Immunofluorescence
Immunofluorescence studies were performed as described previously (Coothankandaswamy et al., 2013). Briefly, cells grown on coverslips were fixed with 4% paraformaldehyde and stained with rabbit anti‐SLC6A14 antibody (Aviva Systems Biology, San Diego, CA, USA) overnight at 4°C. These cells were washed and stained with secondary antibody (goat anti‐rabbit IgG) conjugated with Alexa Fluor 488 (Molecular Probes, Eugene, OR, USA), and were then washed and mounted with ProLong Gold Antifade reagent. Hoechst 33 342 was used to visualize the nucleus. For studies related to autophagy, GFP‐LC3 plasmid was transfected into BxPC‐3 and HPNE cells grown on coverslips, followed by treatment with α‐MT; the localization of LC3 was analysed as described previously (Karunakaran et al., 2008). All images were captured using a Carl Zeiss LSM510 Meta upright confocal microscope.
The tissue microarrays (TMAs) were prepared as described previously (Chaika et al., 2012). For immunofluorescence, the tissue array specimens (paraffin‐embedded) present on slides were deparaffinized in xylene and rehydrated with serial dilutions of alcohol, followed by three washings of 5 min each with PBS. The sections were then placed in a citrate buffer (DAKO, Carpinteria, CA, USA) and heated in a steamer at a temperature of about 97°C for 30 min and then kept at room temperature for 20 min. The slides were then washed with PBS, after which buffered casein solution (Power Block) was applied to the sections for an hour for blocking (BioGenex, Fremont, CA, USA). The slides were then washed again with PBS and incubated with mouse anti‐SLC6A14 antibody diluted at 1:1500 and incubated at room temperature for an hour. This was followed by washing with PBS and then exposure to secondary antibody (goat anti‐mouse IgG) conjugated with Alexa Fluor 568 (Life Technologies, Grand Island, NY, USA) for an hour. The samples were then washed, and a drop of ProLong Gold Antifade reagent (Life Technologies, Grand Island, NY, USA) was added to the slides, and a coverslip was placed on top. Hoechst 33 342 was used to visualize the nucleus. The slides were then scanned at 20× magnification utilizing the Leica Digital Scanner DM6000B (Leica, Vista, CA, USA). Images were analysed and the fluorescence intensity quantified utilizing an online software application, Digital Image Hub (SlidePath, Dublin, Ireland).
Western blotting
Cells were grown to 80–90% confluency, and whole cell lysates were prepared in RIPA lysis buffer with a protease inhibitor cocktail and a phosphatase inhibitor cocktail. After the protein content had been assessed with the BCA Protein Assay Kit, 50 μg per lane were loaded and electrophoretically separated on 10% SDS‐PAGEs and all proteins except SLC6A14 (30 V overnight) were transferred at 150 V for an hour to a nitrocellulose membrane (Bio‐Rad, Hercules, CA). The membrane was then briefly washed and blocked with 5% non‐fat dry milk for 1 h. The blocked membrane was incubated with a primary antibody for 3 h for all proteins except SLC6A14 (overnight) and washed three times with TBST for 5 min each. HRP‐conjugated secondary antibodies (Bethyl Laboratories Inc.) were used as appropriate, and the membrane was incubated and washed as before. The bands were visualized using a Supersignal West Pico Chemiluminescent substrate (Pierce, Rockford, IL).
Cell proliferation
The MTT assay and clonogenic assay were performed as described previously (Coothankandaswamy et al., 2013). For the MTT assay, normal pancreatic and cancer cell lines were seeded at a density of 5000 cells per well in a 96‐well plate. After the cells had properly attached to the substratum, they were exposed to α‐MT (2.5 mM) for 72 h, and the MTT assay was conducted according to the manufacturer's instructions. For the clonogenic assay, the cells were seeded at a very low density (10 000 cells per well) and allowed to attach to the substratum. They were then treated with 2.5 mM α‐MT, and the colonies were allowed to grow for 2 weeks. The wells were washed every other day and fresh α‐MT was added to the wells. At the end of the 2‐week period, the wells were washed, and after being fixed with methanol the colonies were visualized with KaryoMax Giemsa stain. The stain was eluted with 1% SDS in 0.2 NaOH, and the absorbance was measured at 630 nm. The KaryoMax Giemsa stain used to stain the colonies was used at a 1:10 dilution in phosphate buffered saline.
Cell migration and invasion studies
Cell migration and invasion studies were carried out with QCM™ cell migration and QCM™ cell invasion assay kits according to the manufacturer's instructions. Briefly, cells were serum‐starved, and their migration/invasion towards 10% FBS was analysed in the presence or absence of α‐MT. The migrated/invaded cells were visualized using crystal violet, and the stain was eluted and read at 570 nm.
shRNA‐mediated silencing of SLC6A14
A lentivirus‐based transfection system was used for shRNA‐mediated silencing of SLC6A14 in BxPC‐3 cells. The lentivirus‐based shRNA was purchased from Open Biosystems (RHS4533‐NM_007231). The packaging cell line 293FT was transfected with the empty vector or shRNA plasmid along with the helper vectors pLP‐1, pLP‐2 and pVSVG (Invitrogen) to produce the lentivirus particles. The transfection reagent used was lipofectamine 2000. After 72 h of transfection, the lentiviral particles were harvested and filtered through a 0.45 μm membrane. BxPC‐3 cells were infected for 24 h with lentivirus in medium containing 8 μg mL−1 polybrene. Following a 24 h transduction, the cells were replaced with fresh medium and the stable selection was started using puromycin. Real‐time PCR and western blotting were used to monitor the expression of SLC6A14. The functional activity of SLC6A14 was measured in vector control cells and shRNA cells by monitoring the uptake of radiolabelled glycine in a NaCl‐containing buffer; we used glycine instead of glutamine as a substrate for the transporter because our previous studies have shown that glycine is a more selective substrate than glutamine for SLC6A14 (Karunakaran et al., 2008).
Patient‐derived xenografts
The patient‐derived xenografts (PDXs) were procured from TTUHSC Cancer Center. This centre establishes PDXs and PDX‐derived cell lines from primary clinical samples (www.TXCCR.org). All the samples procured were from human pancreatic adenocarcinoma patients.
Tissue microarrays
For TMAs, human pancreatic tumours, metastatic lesions and uninvolved specimens harvested by rapid autopsy from preconsented decedents previously diagnosed with pancreatic ductal carcinoma were obtained from the University of Nebraska Medical Center's Tissue Bank through the Rapid Autopsy Pancreatic programme. Written consent was obtained from patients prior to their death. The Rapid Autopsy sample collection was performed as per the University of Nebraska Medical Center Institutional Review Board approval (approval # 091‐01‐FB). All procedures were approved by the local Ethics Committee.
Animal welfare and ethical statement
Female athymic nude mice (7‐weeks‐old) were purchased from Jackson Laboratories (Bar Harbor, ME, USA). Animals were housed, five mice per cage with ad libitum access to food (chow diet) and water. The room was maintained at a temperature of 22°C with a humidity of 40–60%, and 12:12 h light/dark cycle. Mice were housed in specific pathogen‐free zones. Cages were lined with sterilized corncob bedding material. Mice were given ~7 days to acclimatize to the housing conditions before the start of the experiments. All experimental procedures were in compliance with the National Institute of Health guidelines and approved by the Augusta University Institutional Animal Care and Use Committee. Animal studies are reported in compliance with the ARRIVE guidelines (Kilkenny et al., 2010; McGrath and Lilley, 2015). Mice were not deprived of food or water at any time. Efforts were made to minimize animal suffering.
Group sizes
The exact group size (n) is shown in the figure legends, and ‘n’ refers to independent values and not replicates. For xenograft studies, each group contained 10 mice (n = 10). We have used the minimum possible number of mice to achieve statistical significance. The animals were selected randomly from the pool of all cages eligible for inclusion in the study and randomly divided into groups.
Xenograft studies
Female athymic nu/nu mice (8‐weeks‐old) were allowed to acclimatize to the environment for about a week before the start of the experiment. The animals were divided into control and treatment groups. For the prevention paradigm, the control group received only sucrose‐water for drinking whereas the treatment group was given α‐MT (2 mg mL−1) in sucrose‐water 2 days prior to injection of the tumour cells. This drug dose (2 mg mL−1) for xenograft studies was selected based on our previously published work on the efficacy of α‐MT in inhibiting the growth of the ER‐positive breast cancer cell line ZR‐75‐1 in nude mouse xenografts (Karunakaran et al., 2011). With this dose, the plasma concentration of the drug during treatment was 8 μM. BxPC‐3 (10 × 106 cells in 30% matrigel) and MIA PaCa‐2 (5 × 10⁶ cells in serum‐free media) cells were injected s.c. into the right flank of the mice. Administration of α‐MT in drinking water was continued throughout the experimental period; the compound was prepared in sucrose‐water fresh every day. For the treatment paradigm, mice were injected with BxPC‐3 cells, and the tumours were allowed to grow to ~100 cm3. The animals were then divided into control and treatment groups wherein the control group received sucrose‐water for drinking and the treatment group received α‐MT in sucrose‐water. The treatment was continued throughout the experimental period. To analyse the effect of genetic knockdown of SLC6A14 on tumour growth, BxPC‐3/pCDH PURO (vector control) and BxPC‐3/SLC6A14shRNA (knockdown) cells were generated by lentiviral transduction and used for xenograft studies. The cells were injected s.c. into the mice as described above. Tumour size in different groups were measured using a caliper, and the tumour volume was calculated using the formula (width2 × length)/2.
Data and statistical analysis
Results are expressed as mean ± SEM, with n indicating the number of animals or cell lines, or independent in vitro experiments used for a particular set of experiments. For the gene expression experiments, Student's unpaired (or Mann–Whitney U‐test) or paired (Wilcoxon signed‐rank test) t‐tests were used to compare two independent groups or before and after different treatments, as appropriate. For experiments with more than two groups, ANOVA or Kruskal–Wallis test was used; and if the overall F test was significant, and there was no significant variance in homogeneity, then pair‐wised comparisons of the control and treated groups were performed. Specifically, when data were normalized to % of control or fold mean control, a non‐parametric version of the tests was used. For the tumour volumes that were measured repeatedly over time, the SAS PROC MIXED procedure was used to evaluate the effect of the treatment while taking into account the correlations among the measurements made on the same subject. All analyses were performed using Microsoft Excel (Microsoft Corporation, Redmond, WA) and/or SAS software (Windows version 9.3; SAS Institute, Cary, NC). P values less than 0.05 were considered to be statistically significant. In the relative expression of genes using real‐time PCR, migration and invasion assays and the MTT assay, normalized data were used to avoid distorted results due to variations among the different cell lines and also to better evaluate the drug effect. The data and statistical analysis comply with the recommendations on experimental design and analysis in pharmacology (Curtis et al., 2015).
Materials
α‐MT was purchased from US Biologicals (Salem, MA, USA). FBS was from Atlanta Biologicals (Atlanta, GA, USA), and plasticware for cell culture was obtained from Corning LifeSciences (Manassas, VA, USA). TRIzol, power SYBR green and Karyomax Giemsa stain were procured from Invitrogen Life Technologies (Grand Island, NY, USA). Bicinchoninic acid protein assay reagent was from Pierce Chemicals (Rockford, IL, USA). X‐tremeGENE HP DNA transfection reagent was from Roche (Indianapolis, IN, USA). Immobilon FL PVDF membrane and cell migration/invasion assay kits were procured from Millipore Corp. (Billerica, MA, USA), and the MTT (3‐(4,5‐dimethylthiazol‐2‐yl)‐2,5‐diphenyltetrazolium bromide) assay kit was from the American Type Culture Collection (ATCC) (Rockville, MD, USA). S6K rabbit monoclonal antibody, phospho‐eIF2α (Ser51) rabbit monoclonal antibody, eIF2α rabbit polyclonal antibody and phospho‐ 4E‐BP1 (T37/T46) rabbit monoclonal antibody were purchased from Cell Signaling Technology (Danvers, MA, USA). 4E‐BP1 rabbit monoclonal antibody, phospho‐S6K (Thr389) rabbit polyclonal antibody and SLC6A14 rabbit polyclonal antibody were purchased from Abcam (Cambridge, MA, USA). β‐Actin mouse monoclonal antibody was purchased from Sigma Aldrich (St. Louis, MO, USA).
Results
SLC6A14 is up‐regulated in pancreatic cancer
Among the multiple amino acid transporters that exist in mammalian cells, only SLC1A5, SLC7A5, SLC7A11 and SLC6A14 have been shown to be up‐regulated in different cancers. To determine the relative expression of these four amino acid transporters in pancreatic cancer and hence their relative contribution to pancreatic tumour growth, we analysed the publically available microarray datasets in GEO. All of the above‐mentioned four transporters were overexpressed in pancreatic tumours compared with normal pancreatic tissue. However, the fold‐increase in expression was the highest for SLC6A14 mRNA in five of the eight datasets (Figure 1; Table 1). The increase was in the range of 13‐ to 163‐fold in these five datasets. In contrast, the highest increase for the other three transporters was fourfold. The expression of CD98/SLC3A2 (chaperone for SLC7A5 and SLC7A11) was unchanged in all eight datasets. We further confirmed these findings using primary pancreatic cancer tissues, cancer cell lines and patient‐derived xenographs (PDXs) of pancreatic adenocarcinoma patients. Firstly, we investigated SLC6A14 mRNA expression in primary pancreatic cancer tissues and patient‐matched adjoining normal tissues from three patients. SLC6A14 mRNA was significantly increased in all three tumour samples; the increase was greater than sevenfold (Figure 2A). The same was true with three additional unmatched normal pancreatic and tumour tissues (Figure 2B). Then we checked SLC6A14 mRNA levels in human normal (HPNE and HPDE) and cancerous (AsPC‐1, BxPC‐3, Capan‐1, Capan‐2, MIA PaCa‐2 and PANC‐1) pancreatic cell lines. SLC6A14 mRNA was increased more than 100‐fold in all cancer cell lines compared with HPNE and HPDE (Figure 2C). The relative fold difference of SLC6A14 expression between normal and cancer cell lines is shown in Figure 2D. Furthermore, the up‐regulation of SLC6A14 in pancreatic cancer cells was also confirmed at the protein level. The expression was found to be highly up‐regulated in all pancreatic cancer cells compared with the normal cells. The human breast cancer cell lines MCF‐7 and MB231 were used as a positive and a negative control respectively (Figure 2E). We also assessed SLC6A14 expression in PDXs and normal tissues, and the expression was found to be markedly up‐regulated in cancer compared with normal tissues (Figure 2F). Figure 2G shows the relative fold difference of SLC6A14 expression between normal tissues and the PDXs when combined together. Immunofluorescence analysis with HPNE and BxPC‐3 cells also showed an increase in SLC6A14 protein expression in the cancer cell line compared with the normal cell line (Figure 3A). To further confirm the up‐regulation of SLC6A14 protein in pancreatic cancer, we performed immunofluorescence analysis in a tissue microarray containing normal pancreatic tissues (n = 5) and cancerous pancreatic tissues (n = 53). SLC6A14 expression was highly up‐regulated in all tumour tissues compared with normal tissues; representative images are shown in Figure 3B. Quantification of the fluorescence intensity in all samples showed that the SLC6A14 protein expression was much higher in cancer tissues compared with the normal tissues (Figure 3C). Our findings are also consistent with the recent findings from another laboratory (Penheiter et al., 2015).
Figure 1.
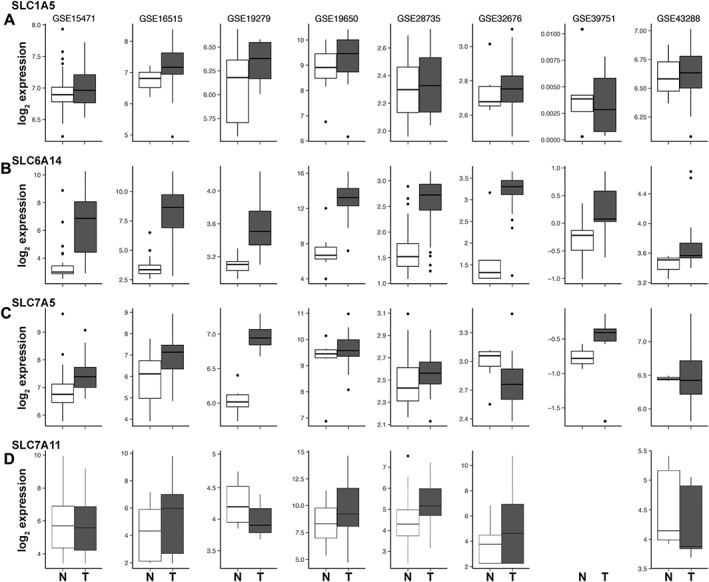
Up‐regulation of amino acid transporters in pancreatic cancer. Box plots for the expression of SLC1A5 (A), SLC6A14 (B), SLC7A5 (C) and SLC7A11 (D) in pancreatic tumour tissues compared to normal pancreatic tissue, as assessed from the publically available microarray datasets. The horizontal line within each box represents the median value. The box edges represent the lower (25th) and upper (75th) quartile. N, normal; T, tumour.
Table 1.
Changes in expression of SLC6A14, SLC7A5, SLC7A11 and SLC1A5 in pancreatic cancer
| Data set | Glutamine transporter | Fold change | P value |
|---|---|---|---|
| GSE 15471 | SLC6A14 | 14.61 | 1.5 × e−10 |
| SLC7A5 | 1.55 | 0.0001 | |
| SLC7A11 | 0.85 | 0.026 | |
| SLC1A5 | 1.05 | 0.1232 | |
| GSE 16515 | SLC6A14 | 39.51 | 1.95 × e −14 |
| SLC7A5 | 2.02 | 0.005 | |
| SLC7A11 | 1.97 | 0.0002 | |
| SLC1A5 | 1.28 | 0.0013 | |
| GSE 19279 | SLC6A14 | 1.33 | 0.0551 |
| SLC7A5 | 1.75 | 0.0038 | |
| SLC7A11 | 0.72 | 0.0052 | |
| SLC1A5 | 0.99 | 0.2869 | |
| GSE 19650 | SLC6A14 | 95.03 | 0.0001 |
| SLC7A5 | 1.09 | 0.1699 | |
| SLC7A11 | 3.97 | 0.0025 | |
| SLC1A5 | 1.46 | 0.199 | |
| GSE 28735 | SLC6A14 | 13.37 | 1.88 × e−14 |
| SLC7A5 | 1.44 | 0.0089 | |
| SLC7A11 | 1.81 | 0.0001 | |
| SLC1A5 | 1.2 | 0.0025 | |
| GSE 32676 | SLC6A14 | 163.31 | 0.0001 |
| SLC7A5 | 0.34 | 0.0315 | |
| SLC7A11 | 3.1 | 0.0009 | |
| SLC1A5 | 1.26 | 0.3324 | |
| GSE 39751 | SLC6A14 | 1.29 | 0.0507 |
| SLC7A5 | 1.71 | 0.0107 | |
| SLC7A11 | – | – | |
| SLC1A5 | 0.96 | 0.3909 | |
| GSE 43288 | SLC6A14 | 1.23 | 0.0496 |
| SLC7A5 | 1.3 | 0.258 | |
| SLC7A11 | 0.93 | 0.196 | |
| SLC1A5 | 1 | 0.3702 |
Figure 2.
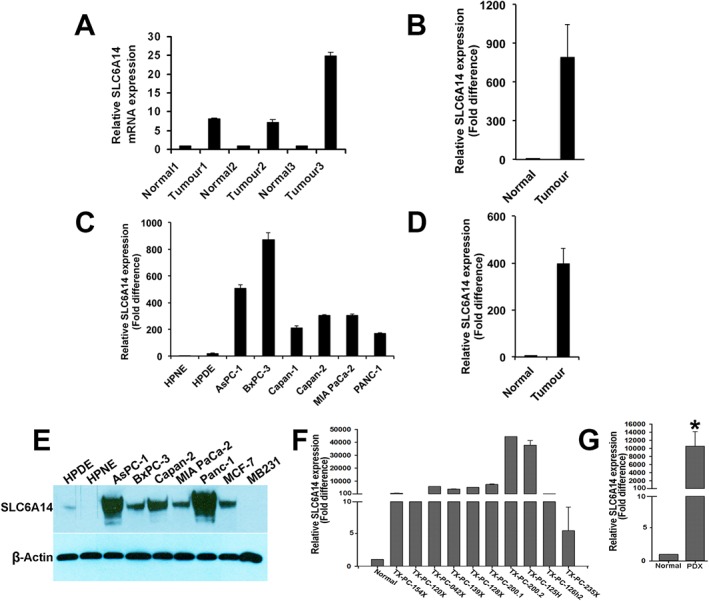
SLC6A14 mRNA and protein expression is up‐regulated in pancreatic cancer. (A) Comparison of SLC6A14 mRNA levels between primary pancreatic cancer tissues and patient‐matched adjoining normal tissues (normal, n = 3; tumour, n = 3). (B) Comparison of SLC6A14 mRNA levels between primary pancreatic cancer tissues and unmatched normal pancreatic tissues (normal, n = 3; tumour, n = 3). (C) SLC6A14 mRNA levels in non‐malignant pancreatic cell lines versus pancreatic cancer cell lines. (D) SLC6A14 mRNA expression in pooled normal versus cancer cell lines (normal cell lines, n = 2; cancer cell lines, n = 6). (E) Western blotting analysis of SLC6A14 protein in normal versus cancerous pancreatic cell lines. (F) SLC6A14 mRNA levels in patient‐derived xenografts (PDXs). (G) SLC6A14 mRNA expression in pooled PDXs (normal tissue, n = 6; tumour tissue, n = 10). Data are given as means ± SEM. * P < 0.05.
Figure 3.
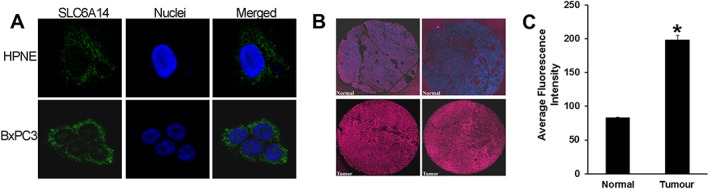
SLC6A14 protein expression is up‐regulated in pancreatic cancer. (A) Immunofluorescence analysis of SLC6A14 protein in HPNE and BxPC‐3 cells (green). Nuclei were stained with Hoechst (blue). (B) Representative images of SLC6A14 protein expression in two normal and two tumour pancreatic tissues from a TMA. Images are shown at 20× magnification. (C) Histogram showing SLC6A14 staining intensity in normal and tumour pancreatic tissues assessed from the whole TMA (normal tissue, n = 5; tumour tissue, n = 53). Data are given as means ± SEM. *P < 0.05.
Pharmacological blockade of SLC6A14 with α‐methyltryptophan in pancreatic cancer cells induces amino acid starvation and autophagy and suppresses mTORC1 signalling
α‐MT is a blocker of SLC6A14 and induces amino acid starvation in SLC6A14‐positive cancer cells (Karunakaran et al., 2008). The mechanistic target of rapamycin complex 1 (mTORC1) pathway plays a critical role in nutrient signalling (Conn and Qian, 2011; Loewith and Hall, 2011; Zoncu et al., 2011; Altomare and Khaled, 2012), and amino acid starvation inhibits this pathway (Hara et al., 1998). To determine whether blockade of SLC6A14 leads to amino acid starvation in pancreatic cancer cells, the SLC6A14‐low normal pancreatic cell line, HPNE, and the SLC6A14‐high pancreatic cancer cell line, BxPC‐3, were treated with α‐MT for 72 h and then the expressions of asparagine synthetase (ASNS) and C/EBP‐homologous protein (CHOP) were monitored as a read out for amino acid starvation; the expressions of these two proteins are known to be increased at the transcriptional level during a paucity of amino acids (Hutson et al., 1996; Jousse et al., 1999). α‐MT treatment increased the steady‐state mRNA levels for both ASNS and CHOP in BxPC‐3 cells; the increase was dose‐dependent with regard to α‐MT concentration (Figure 4A, B). In contrast, there was no change in the levels of ASNS and CHOP mRNAs in HPNE cells under identical conditions, suggesting that the ability of α‐MT to block amino acid transport is selective for SLC6A14. Under amino acid‐deprived conditions, autophagy is up‐regulated as a part of the survival mechanism through which cells replenish the amino acids (Levine and Klionsky, 2004). To determine if α‐MT‐induced amino acid starvation in BxPC‐3 cells is accompanied by autophagy, we used HPNE cells and BxPC‐3 cells transfected with an LC3‐GFP expression construct. The cells were treated with or without α‐MT for 72 h, and then LC3‐GFP protein was analysed by immunofluorescence. Autophagy causes the accumulation of LC3‐GFP protein in autophagosomes that are visualized as punctate green fluorescent (GFP) signals. Punctate localization of LC3‐GFP protein was clearly evident in α‐MT‐treated BxPC‐3 cells but not in HPNE cells (Figure 4C), again establishing the specificity of this blocker for SLC6A14.
Figure 4.
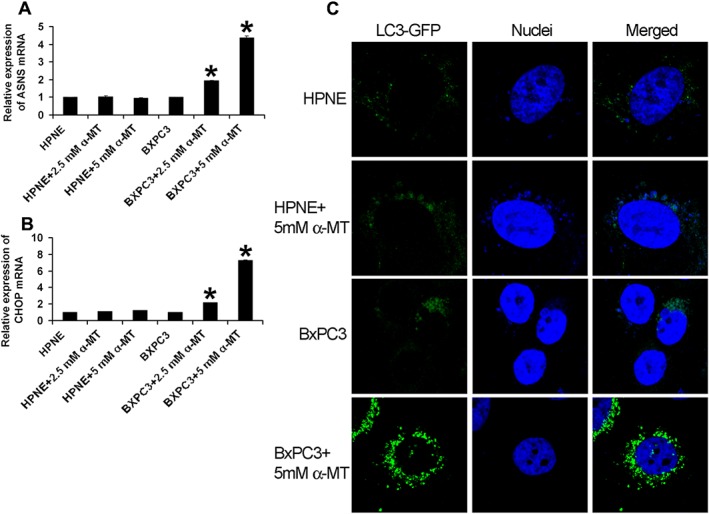
Pharmacological blockade of SLC6A14 induces autophagy in pancreatic cancer cell lines. (A) ASNS and (B) CHOP mRNA levels in HPNE and BxPC‐3 cells treated with and without α‐MT for 72 h (n = 6 independent experiments). (C) Immunofluorescence analysis of GFP‐LC3 (green) in HPNE and BxPC‐3 cells following treatment with and without α‐MT for 72 h. Nuclei were stained with Hoechst (blue). Data are given as means ± SEM. *P < 0.05.
We then monitored the effect of α‐MT treatment on mTORC1 signalling in HPNE cells and in BxPC‐3 and MIA PaCa‐2 cells. α‐MT‐dependent blockade of SLC6A14 is expected to cause amino acid deprivation and the consequent decrease in mTORC1 signalling only in SLC6A14‐high BxPC‐3 and MIA PaCa‐2 cells but not in SLC6A14‐low HPNE cells. Inhibition of the mTORC1 signalling pathway following α‐MT treatment was evident in BxPC‐3 and MIA PaCa‐2 cells from the decreased phosphorylation of S6kinase, eIF‐2α and 4EBP1 (Figure 5A). There was no evidence of any significant change in mTORC1 signalling pathway in HPNE cells under identical conditions.
Figure 5.
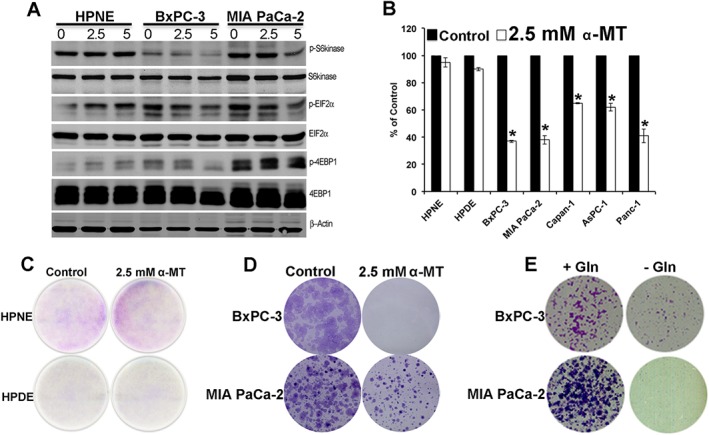
α‐MT‐mediated SLC6A14 blockade suppresses mTORC1 signalling, reduces clonogenic survival and proliferation in pancreatic cancer cells. (A) Western blotting analysis of various proteins (phosphorylated and total) involved in the mTORC1 signalling pathway with cell lysates from HPNE, BxPC‐3 and MIA PaCa‐2 cells following treatment with and without α‐MT (0–5 mM) for 72 h. (B) MTT assay showing % viability in pancreatic normal versus cancer cell lines following treatment with and without α‐MT (2.5 mM) for 72 h. Data for cells cultured in the absence of α‐MT are given as 100%, and the data for the corresponding cells cultured in the presence of α‐MT are given as % of this control value (means ± SEM). * P < 0.05 compared with corresponding cell lines cultured in the absence of α‐MT (n = 6 independent experiments). (C) Clonogenic assay with pancreatic normal (HPNE and HPDE) cells cultured in the absence and presence of α‐MT. (D) Clonogenic assay with BxPC‐3 and MIA PaCa‐2 cells cultured in the absence and presence of α‐MT. (E) Clonogenic assay in BxPC‐3 and MIA PaCa‐2 cells cultured in glutamine‐containing (+Gln) and glutamine‐free (‐Gln) media.
Pharmacological blockade of SLC6A14 decreases the proliferation of pancreatic cancer cells
Next, we examined the effects of SLC6A14 blockade on the ability of pancreatic cancer cells to proliferate. For this, we performed the MTT assay and the clonogenic assay. In the MTT assay, normal pancreatic (HPNE and HPDE) and pancreatic cancer (BxPC‐3, MIA PaCa‐2, Capan‐1, AsPC‐1 and PANC‐1) cells were treated with α‐MT for 72 h. The treatment led to a significant decrease in cell viability in all pancreatic cancer cells compared with the normal cells (Figure 5B). The clonogenic assay showed no difference in colony formation in normal HPNE and HPDE cells upon treatment with α‐MT (Figure 5C), whereas α‐MT‐treated BxPC‐3 and MIA PaCa‐2 cells exhibited reduced clonogenic survival (Figure 5D) compared with untreated controls. Since SLC6A14 is an amino acid transporter with broad substrate selectivity and glutamine is one of the substrates, we checked whether glutamine deprivation in pancreatic cancer cells affects their proliferation capacity. Most cancer cells are highly dependent on glutamine, and even though glutamine can be synthesized from other precursors, the capacity of tumour cells to synthesize this amino acid endogenously is not sufficient to meet the demands of the highly proliferating tumour cells; as such, tumour cells rely on the influx of glutamine from the extracellular medium (Ganapathy et al., 2009; Ward and Thompson, 2012; Bhutia et al., 2014). BxPC‐3 and MIA PaCa‐2 cells cultured in glutamine‐free media showed a marked reduction in clonogenic survival compared with those cells grown in the presence of glutamine (Figure 5E).
Consequences of SLC6A14 blockade on cell migration, invasion and HIF‐1α protein levels in pancreatic cancer cells
Cell migration and invasion play a critical role in cancer (Stroka and Konstantopoulos, 2014). Therefore, we tested if α‐MT treatment has any effect on the migration and invasion capacity of BxPC‐3 and MIA PaCa‐2 cells. α‐MT was highly effective in reducing the migratory and invasive properties of these cancer cells (Figure 6A, B). Solid tumours are usually associated with a hypoxic condition leading to overexpression of hypoxia‐inducible factor‐1α (HIF‐1α) to enable the tumours to grow (Abraham, 2004; Miyazawa et al., 2009). Studies have shown that mTORC1 signalling leads to an increase in cellular levels of HIF‐1α protein by blocking its proteasomal degradation (Abraham, 2004; Miyazawa et al., 2009). Therefore, we checked if α‐MT treatment reduced the levels of HIF‐1α protein in pancreatic cancer cells. BxPC‐3 and MIA PaCa‐2 cells were pretreated with α‐MT. The cells were then exposed to the hypoxia‐mimetic cobalt chloride (CoCl2). There was a significant increase in HIF‐1α protein in BxPC‐3/hypoxic and MIA PaCa‐2/hypoxic cells compared with untreated cells. The CoCl2 (hypoxia)‐induced increase in HIF‐1α protein levels was attenuated significantly by α‐MT in MIA PaCa‐2 cells and BxPC‐3 cells (Figure 6C). These findings were also corroborated by immunofluorescence analysis of HIF‐1α protein. Treatment of BxPC‐3 cells and MIA PaCa‐2 cells with α‐MT drastically reduced the cellular and nuclear levels of HIF‐1α, the effect being more pronounced in MIA PaCa‐2 cells (Figure 6D).
Figure 6.
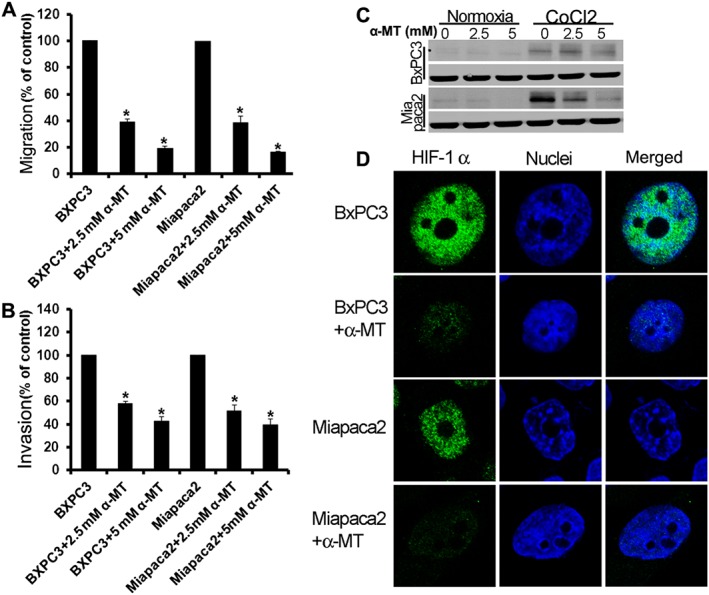
Pharmacological blockade of SLC6A14 decreases migration, invasion and hypoxia‐induced HIF‐1α levels in pancreatic cancer cells. Migration (A) and invasion (B) of serum‐starved pancreatic cancer lines towards 10% FBS in the absence and presence of α‐MT for 72 h. Data are given as means ± SEM. * P < 0.05 (n = 5 independent experiments). (C) Pancreatic cancer cells were treated with the hypoxia mimetic cobalt chloride, and the effects of α‐MT on HIF‐1α protein levels were analysed by western blots. (D) BxPC‐3 and MIA PaCa‐2 cells were treated with cobalt chloride in the absence and presence of α‐MT, and HIF‐1α protein levels and cellular localization were then analysed by immunofluorescence (green).
Genetic knockdown of SLC6A14 reduces the ability of pancreatic cancer cells to form colonies
To evaluate if genetic knockdown of SLC6A14 would have similar effects as the pharmacological blockade, we used BxPC‐3 as the model cell line and silenced SLC6A14 using shRNA. The extent of knockdown was confirmed both at the mRNA (~70%) and protein level (~25%). In accordance with this decrease in SLC6A14 protein, we also found a corresponding decrease (~35%) in the uptake of glycine, an amino acid that is relatively more specific as a substrate for the transporter compared with glutamine (Karunakaran et al., 2008). The clonogenic assay demonstrated a reduction in the colony forming ability of the BxPC‐3/SLC6A14‐shRNA cells compared with the vector control. We then checked the effect of α‐MT on these cells. One would expect α‐MT not to affect the colony formation/proliferation capacity in these cells if SLC6A14 is silenced completely. However, we could not obtain total silencing of the gene with any of the shRNAs that we used. As such, even though the colony formation capacity was decreased in SLC6A14‐shRNA cells because of the partial silencing of the gene, α‐MT elicited an inhibitory effect on colony formation both in control cells and in shRNA cells (Figure S1).
Pharmacological and genetic inactivation of SLC6A14 decreases the growth of pancreatic cancer cells in mouse xenografts
To assess the efficacy of SLC6A14 as a drug target for the treatment of pancreatic cancer in vivo, mouse xenograft studies were performed in athymic nude mice using BxPC‐3 and MIA PaCa‐2 cells. Firstly, we used α‐MT treatment (2 mg mL−1 in drinking water) to prevent the formation of tumours; α‐MT was administered to the mice 2 days prior to the injection of tumour cells, and the treatment was continued throughout the experiment. A marked reduction in tumour growth was evident the α‐MT‐treated mice; this was observed with both cell lines (Figure 7A, B). We then changed the treatment paradigm so that the drug was administered only after the tumours had grown to ~100 mm3. Without treatment, the tumours continued to grow whereas when treated with α‐MT, the tumours stopped growing (Figure 7C). We then wanted to investigate if the effects of shRNA‐mediated knockdown of SLC6A14 would have a similar effect as the pharmacological blockade. We first examined the relative efficacy of four different SLC6A14‐specific shRNAs to reduce the steady‐state levels of SLC6A14 mRNA in BxPC‐3 cells. We used the lentiviral transduction for this purpose. All four shRNAs showed only a modest efficacy in reducing the SLC6A14 mRNA levels, and we chose the one that showed the maximal effect (~70% reduction in SLC6A14 mRNA and ~25% reduction in protein levels) for mouse xenograft studies. BxPC‐3/SLC6A14‐shRNA and the vector control cells were injected into athymic nude mice. shRNA‐mediated knockdown of SLC6A14 led to a reduction in tumour growth; the effect was significant when compared with the vector control (Figure 7D).
Figure 7.
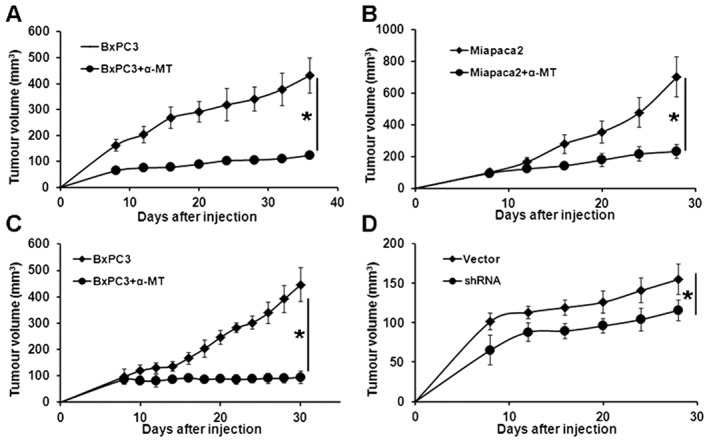
Pharmacological inhibition and shRNA‐mediated inactivation of SLC6A14 decreases the growth of pancreatic cancer cells in mouse xenografts. Subcutaneous xenografts of BxPC‐3 (A) and MIA PaCa‐2 (B) cells in athymic nude mice. Control groups received sucrose‐water, and the treatment groups received α‐MT (2 mg mL−1 in sucrose‐water). Treatment with α‐MT was started 2 days prior to injection of the tumour cells. (C) Subcutaneous xenograft of BxPC‐3 in athymic nude mice. Mice were kept on regular drinking water until the tumours grew to ~100 mm3 in size. Mice were then divided into two groups: one was treated with sucrose‐water and the other with α‐MT in sucrose‐water (2 mg mL−1). (D) Subcutaneous xenograft of BxPC‐3/pCDH PURO and BxPC‐3/SLC6A14shRNA cells in athymic nude mice. Data are given as means ± SEM. * P < 0.05 (n = 10).
Discussion
Here, we showed that pancreatic cancer is associated with a marked up‐regulation of the amino acid transporter SLC6A14. This increase was much higher than that for the amino acid transporters SLC1A5, SLC7A5 and SLC7A11, which have recently been shown to be potential drug targets for cancer therapy (Nicklin et al., 2009; Ishimoto et al., 2011; Timmerman et al., 2013). Even though there are many amino acid transport systems, most of them have a limited substrate selectivity. If tumour cells were to rely on such transport systems for the supply of amino acids, multiple transporter genes must be up‐regulated in a coordinated manner to support their growth. However, SLC6A14 is unique in that it exhibits special functional features that are ideally suited for the promotion of tumour growth (Bhutia et al., 2014, 2015; Bhutia and Ganapathy, 2015). SLC6A14 transports 18 of the 20 proteinogenic amino acids, which include all essential amino acids. Furthermore, the energetics of SLC6A14 are such that it is capable of concentrating its substrates more than 1000 times inside the cells, thus making the transport process almost unidirectional. This is in contrast to the essential amino acid exchangers SLC1A5, SLC7A5 and SLC7A11 (Nicklin et al., 2009; Ishimoto et al., 2011; Timmerman et al., 2013). The need of tumour cells for amino acids to synthesize proteins and nucleotides probably drives the up‐regulation of SLC6A14. Previous studies have shown that SLC6A14 is up‐regulated in cervical cancer (Gupta et al., 2005), colorectal cancer (Gupta et al., 2005) and breast cancer (Karunakaran et al., 2008). In the present study, SLC6A14 was also shown to be up‐regulated in pancreatic cancer. The publically available GEO datasets solidly confirm this phenomenon, and a recent report from another laboratory corroborates these findings (Penheiter et al., 2015).
In the present study, we also provide the proof‐of‐concept for pharmacological targeting of SLC6A14 for pancreatic cancer treatment. Blockade of SLC6A14 with α‐MT leads to amino acid starvation, induces autophagy and interferes with mTORC1 signalling selectively in SLC6A14‐high pancreatic cancer cells with no or a minimal effect in SLC6A14‐low normal pancreatic cells. α‐MT is a tryptophan derivative and was originally designed as a tracer to measure the rate of 5‐HT synthesis rate in the brain (Chugani, 2011). Our previous studies have shown that α‐MT interacts with SLC6A14, not as a transportable substrate but as a blocker (Karunakaran et al., 2008). mTORC1 is a signalling complex that senses the cellular status of amino acid nutrition (Jewell and Guan, 2013; Jewell et al., 2013). mTORC1 is involved in numerous cellular processes as a master regulator that couples amino acid availability to cell growth and autophagy (Abraham, 2004; Miyazawa et al., 2009). Several factors modulate mTORC1 signalling, but amino acids are the key environmental stimuli. Increased mTORC1 activation is observed in many cancers, and its inhibition has proven efficacious in cancer therapy. Since amino acids are the primary activators of mTORC1 signalling, we hypothesize that selective amino acid transporters act upstream of mTORC1 to control its signalling. Our present studies identified SLC6A14 as the amino acid transporter that controls the mTORC1 pathway in pancreatic cancer. We further showed that pharmacological blockade of the transporter in pancreatic cancer cells decreases the cellular and nuclear levels of HIF‐1α protein in pancreatic cancer cells. Malignant tumours are usually associated with a hypoxic condition leading to the overexpression of HIF‐1α to enable the tumour to grow (Miyazawa et al., 2009). The mTORC1 pathway is a positive regulator of HIF‐1α (Abraham, 2004). Accordingly, pharmacological blockade of SLC6A14 with α‐MT in pancreatic cancer cells suppresses mTORC1 signalling and consequently HIF‐1α levels. These effects are associated with reduced cancer cell proliferation and colony formation in vitro and, also, reduced tumour growth in mouse xenografts in vivo.
α‐MT is a blocker of SLC6A14; treatment of the normal pancreatic cell lines HPNE and HPDE with α‐MT did not lead to any noticeable effect in terms of amino acid nutrition. Hence, the effect of α‐MT is selective for pancreatic cancer cell lines. HPNE and HPDE cells express very low levels of SLC6A14; in contrast, pancreatic cancer cell lines express several‐fold higher levels of this transporter compared with these two normal cell lines. These data show that the pharmacological effects of α‐MT are selective for SLC6A14‐positive cells. We have reported similar findings in breast cancer cells (Karunakaran et al., 2008, 2011). MCF7 and ZR‐75‐1 cells are breast cancer cell lines that express high levels of SLC6A14 whereas MB231 cells, which are also breast cancer cells, are negative for SLC6A14 expression. Treatment with α‐MT blocks cell proliferation and colony formation in vitro and tumour growth in mouse xenografts in vivo only with SLC6A14‐positive breast cancer cell lines but not with SLC6A14‐negative breast cancer cell lines. Normal mammary epithelial cell lines such as MCF10A do not express SLC6A14, and α‐MT has no effect on these cells (Karunakaran et al., 2008). All cells need amino acids for their survival and proliferation, and they satisfy their amino acid needs mostly through cell‐surface amino acid transporters. Our findings that α‐MT has no noticeable effect on SLC6A14‐negative cells, irrespective of whether they are normal or malignant, demonstrate convincingly that this compound interacts only with SLC6A14.
The present studies indicate strongly that SLC6A14 has potential as a drug target for treatment of pancreatic cancer. α‐MT itself can be used in clinical trials to determine its efficacy as an anticancer drug. Even though millimolar concentrations of this compound were needed for its effects in pancreatic cancer cells in vitro, significant in vivo effects were seen in mouse xenograft studies with 2 mg mL−1 of this compound in drinking water. Previous studies from our laboratory have shown that the plasma levels of α‐MT are ~8 μM in mice when the compound was administered at 2 mg mL−1 in drinking water (Karunakaran et al., 2011). It may be possible to achieve these plasma concentrations in humans after oral administration of this compound in clinical trials. Even if the efficacy of α‐MT is considered weak for use in humans, the present studies with this compound provide a strong proof‐of‐concept for the therapeutic utility of SLC6A14 as a drug target for the treatment of pancreatic cancer. α‐MT can be utilized as a lead compound for the design and development of more potent blockers of SLC6A14 for use in humans for the treatment of pancreatic cancer. It is also feasible to identify new blockers with high potency through screening of small molecule libraries for the same purpose. Alternatively, monoclonal antibodies can be developed to selectively block the function of the transporter. Since SLC6A14 is a cell‐surface protein with extraplasmic epitopes exposed on the cell surface, this approach is theoretically feasible as has been shown for the blockade of various other cell‐surface proteins in cancer therapy.
Conclusions
The important findings of the present study are that SLCA614 is significantly up‐regulated in pancreatic cancer and that this transporter promotes tumour cell migration and invasion. Blockade of SLC6A14 with α‐MT caused amino acid starvation, suppressed mTORC1 signalling and reduced pancreatic cancer cell growth in vitro and in vivo (Figure S2). Hence, SLC6A14 offers a novel drug target for treatment of pancreatic cancer. Since normal pancreatic cells express negligible amounts of this transporter, pharmacological blockade of the transporter would have minimal off‐target effects. The recent development of a selective PET probe to detect SLC6A14‐positive tumours in vivo (Muller et al., 2014) highlights the clinical and therapeutic utility of this transporter in cancer therapy.
Author contributions
V.C. contributed to data acquisition, data analysis and interpretation. S.C. and Y.X. contributed to acquisition of microarray data and its analysis and interpretation. P.D.P. contributed to data acquisition, analysis and interpretation. P.K.S. provided the pancreatic cancer tissue arrays. C.P.R. provided the PDXs. V.G. contributed in conception and design of the study, analysis and interpretation of data and in drafting the manuscript. S.Y. helped in the statistical analysis of the data. J.O. contributed to the measurement of SLC6A14 transport activity. Y.D.B. contributed in conception and design of the study, data acquisition and its analysis and interpretation and in drafting the manuscript.
Conflict of interest
The authors declare no conflicts of interest.
Declaration of transparency and scientific rigour
This Declaration acknowledges that this paper adheres to the principles for transparent reporting and scientific rigour of preclinical research recommended by funding agencies, publishers and other organisations engaged with supporting research.
Supporting information
Figure S1 Genetic knockdown of SLC6A14 by shRNA reduces the colony formation capacity of pancreatic cancer cells. The figure shows the colony formation ability in BxPC‐3/Vector control and BxPC‐3/SLC6A14‐shRNA cells. Also shown is the effect of 2.5 mM α‐MT on the vector control and SLC6A14‐silenced BxPC‐3 cells.
Figure S2 Schematic model showing how amino acid entry via SLC6A14 promotes tumour growth and migration/invasion and the consequences of the blockade of the transporter function with α‐MT.
Supporting info item
Acknowledgments
This work was supported in part by a grant from the South Plains Foundation (Lubbock, TX, USA).
Coothankandaswamy, V. , Cao, S. , Xu, Y. , Prasad, P. D. , Singh, P. K. , Reynolds, C. P. , Yang, S. , Ogura, J. , Ganapathy, V. , and Bhutia, Y. D. (2016) Amino acid transporter SLC6A14 is a novel and effective drug target for pancreatic cancer. British Journal of Pharmacology, 173: 3292–3306. doi: 10.1111/bph.13616.
References
- Abraham RT (2004). mTOR as a positive regulator of tumor cell responses to hypoxia. Curr Top Microbiol Immunol 279: 299–319. [DOI] [PubMed] [Google Scholar]
- Alexander SPH, Fabbro D, Kelly E, Marrion N, Peters JA, Benson HE et al. (2015a). The Concise Guide to PHARMACOLOGY 2015/16: Enzymes. Br J Pharmacol 172: 6024–6109. [DOI] [PMC free article] [PubMed] [Google Scholar]
- Alexander SPH, Kelly E, Marrion N, Peters JA, Benson HE, Faccenda E et al. (2015b). The Concise Guide to PHARMACOLOGY 2015/16: Transporters. Br J Pharmacol 172: 6110–6202. [DOI] [PMC free article] [PubMed] [Google Scholar]
- Altomare DA, Khaled AR (2012). Homeostasis and the importance for a balance between AKT/mTOR activity and intracellular signaling. Curr Med Chem 19: 3748–3762. [DOI] [PMC free article] [PubMed] [Google Scholar]
- Andersson R, Aho U, Nilsson BI, Peters GJ, Pastor‐Anglada M, Rasch W et al. (2009). Gemcitabine chemoresistance in pancreatic cancer: molecular mechanisms and potential solutions. Scand J Gastroenterol 44: 782–786. [DOI] [PubMed] [Google Scholar]
- Badea L, Herlea V, Dima SO, Dumitrascu T, Popescu I (2008). Combined gene expression analysis of whole‐tissue and microdissected pancreatic ductal adenocarcinoma identifies genes specifically overexpressed in tumor epithelia. Hepatogastroenterology 55: 2016–2027. [PubMed] [Google Scholar]
- Barry S, Chelala C, Lines K, Sunamura M, Wang A, Marelli‐Berg FM et al. (2013). S100P is a metastasis‐associated gene that facilitates transendothelial migration of pancreatic cancer cells. Clin Exp Metastasis 30: 251–264. [DOI] [PubMed] [Google Scholar]
- Bhutia YD, Ganapathy V (2015). Glutamine transporters in mammalian cells ad their function in physiology and cancer. Biochim Biophys Acta. doi:10.1016/j.bbamcr.2015.12.017. [DOI] [PMC free article] [PubMed] [Google Scholar]
- Bhutia YD, Babu E, Prasad PD, Ganapathy V (2014). The amino acid transporter SLC6A14 in cancer and its potential use in chemotherapy. Asian J Pharm Sci 9: 293–303. [Google Scholar]
- Bhutia YD, Babu E, Ramachandran S, Ganapathy V (2015). Amino acid transporters in cancer and their relevance to “glutamine addiction”: novel targets for the design of a new class of anticancer drugs. Cancer Res 75: 1782–1788. [DOI] [PubMed] [Google Scholar]
- Chaika NV, Yu F, Purohit V, Mehla K, Lazenby AJ, DiMaio D et al. (2012). Differential expression of metabolic genes in tumor and stromal components of primary and metastatic loci in pancreatic adenocarcinoma. PLoS One 7: e32996. [DOI] [PMC free article] [PubMed] [Google Scholar]
- Chugani DC (2011). Alpha‐methyl‐L‐tryptophan: mechanisms for tracer localization of epileptogenic brain regions. Biomark Med 5: 567–575. [DOI] [PMC free article] [PubMed] [Google Scholar]
- Conn CS, Qian SB (2011). mTOR signaling in protein homeostasis: less is more? Cell Cycle 10: 1940–1947. [DOI] [PMC free article] [PubMed] [Google Scholar]
- Coothankandaswamy V, Elangovan S, Singh N, Prasad PD, Thangaraju M, Ganapathy V (2013). The plasma membrane transporter SLC5A8 suppresses tumour progression through depletion of survivin without involving its transport function. Biochem J 450: 169–178. [DOI] [PMC free article] [PubMed] [Google Scholar]
- Crnogorac‐Jurcevic T, Chelala C, Barry S, Harada T, Bhakta V, Lattimore S et al. (2013). Molecular analysis of precursor lesions in familial pancreatic cancer. PLoS One 8: e54830. [DOI] [PMC free article] [PubMed] [Google Scholar]
- Curtis MJ, Bond RA, Spina D, Ahluwalia A, Alexander SP, Giembycz MA et al. (2015). Experimental design and analysis and their reporting: new guidance for publication in BJP. Br J Pharmacol 172: 3461–3471. [DOI] [PMC free article] [PubMed] [Google Scholar]
- Donahue TR, Tran LM, Hill R, Li Y, Kovochich A, Calvopina JH et al. (2012). Integrative survival‐based molecular profiling of human pancreatic cancer. Clin Cancer Res 18: 1352–1363. [DOI] [PMC free article] [PubMed] [Google Scholar]
- Ganapathy V (2012). Protein digestion and absorption In: Johnson LR, Ghishan FK, Kunitz JD. et al. (eds). Physiology of the Gastrointestinal Tract. Academic Press: London, pp. 1595–1623. [Google Scholar]
- Ganapathy ME, Ganapathy V (2005). Amino acid transporter ATB0 ,+ as a delivery system for drugs and prodrugs. Curr Drug Targets Immune Endocr Metabol Disord 5: 357–364. [DOI] [PubMed] [Google Scholar]
- Ganapathy V, Inoue K, Prasad PD, Ganapathy ME (2004). Cellular uptake of amino acids: system and regulation In: Cynober LA. (ed). Metabolic and Therapeutic Aspects of Amino Acids in Clinical Nutrition, CRC Press: Boca Raton, FL, pp. 63–78. [Google Scholar]
- Ganapathy V, Thangaraju M, Prasad PD (2009). Nutrient transporters in cancer: relevance to Warburg hypothesis and beyond. Pharmacol Ther 121: 29–40. [DOI] [PubMed] [Google Scholar]
- Gupta N, Miyauchi S, Martindale RG, Herdman AV, Podolsky R, Miyake K et al. (2005). Upregulation of the amino acid transporter ATB0 ,+ (SLC6A14) in colorectal cancer and metastasis in humans. Biochim Biophys Acta 1741: 215–223. [DOI] [PubMed] [Google Scholar]
- Gupta N, Prasad PD, Ghamande S, Moore‐Martin P, Herdman AV, Martindale RG et al. (2006). Up‐regulation of the amino acid transporter ATB0 ,+ (SLC6A14) in carcinoma of the cervix. Gynecol Oncol 100: 8–13. [DOI] [PubMed] [Google Scholar]
- Hara K, Yonezawa K, Weng QP, Kozlowski MT, Belham C, Avruch J (1998). Amino acid sufficiency and mTOR regulate p70 S6 kinase and eIF‐4E BP1 through a common effector mechanism. J Biol Chem 273: 14484–14494. [DOI] [PubMed] [Google Scholar]
- Hiraoka N, Yamazaki‐Itoh R, Ino Y, Mizuguchi Y, Yamada T, Hirohashi S et al. (2011). CXCL17 and ICAM2 are associated with a potential anti‐tumor immune response in early intraepithelial stages of human pancreatic carcinogenesis. Gastroenterology 140: 310–321. [DOI] [PubMed] [Google Scholar]
- Hutson RG, Warskulat U, Haussinger D, Kilberg MS (1996). An example of nutrient control of gene expression: amino acid‐dependent regulation of asparagine synthetase. Clin Nutr 15: 327–331. [DOI] [PubMed] [Google Scholar]
- Ishimoto T, Nagano O, Yae T, Tamada M, Motohara T, Oshima H et al. (2011). CD44 variant regulates redox status in cancer cells by stabilizing the xCT subunit of system x− c and thereby promotes tumor growth. Cancer Cell 19: 387–400. [DOI] [PubMed] [Google Scholar]
- Jewell JL, Guan KL (2013). Nutrient signaling to mTOR and cell growth. Trends Biochem Sci 38: 233–242. [DOI] [PMC free article] [PubMed] [Google Scholar]
- Jewell JL, Russell RC, Guan KL (2013). Amino acid signalling upstream of mTOR. Nat Rev Mol Cell Biol 14: 133–139. [DOI] [PMC free article] [PubMed] [Google Scholar]
- Jousse C, Bruhat A, Fafournoux P (1999). Amino acid regulation of gene expression. Curr Opin Clin Metab Care 2: 297–301. [DOI] [PubMed] [Google Scholar]
- Karunakaran S, Umapathy NS, Thangaraju M, Hatanaka T, Itagaki S, Munn DH et al. (2008). Interaction of tryptophan derivatives with SLC6A14 (ATB0 ,+) reveals the potential of the transporter as a drug target for cancer chemotherapy. Biochem J 414: 343–355. [DOI] [PubMed] [Google Scholar]
- Karunakaran S, Ramachandran S, Coothankandaswamy V, Elangovan S, Babu E, Periyasamy‐Thandavan S et al. (2011). SLC6A14 (ATB0 ,+) protein, a highly concentrative and broad specific amino acid transporter, is a novel and effective drug target for treatment of estrogen receptor‐positive breast cancer. J Biol Chem 286: 31830–31838. [DOI] [PMC free article] [PubMed] [Google Scholar]
- Kilkenny C, Browne W, Cuthill IC, Emerson M, Altman DG (2010). Animal research: reporting in vivo experiments: the ARRIVE guidelines. Br J Pharmacol 160: 1577–1579. [DOI] [PMC free article] [PubMed] [Google Scholar]
- Levine B, Klionsky DJ (2004). Development by self‐digestion: molecular mechanisms and biological functions of autophagy. Dev Cell 6: 463–477. [DOI] [PubMed] [Google Scholar]
- Loewith R, Hall MN (2011). Target of rapamycin (TOR) in nutrient signaling and growth control. Genetics 189: 1177–1201. [DOI] [PMC free article] [PubMed] [Google Scholar]
- McGrath JC, Lilley E (2015). Implementing guidelines on reporting research using animals (ARRIVE etc.): new requirements for publication in BJP. Br J Pharmacol 172: 3189–3193. [DOI] [PMC free article] [PubMed] [Google Scholar]
- Miyazawa M, Yasuda M, Fujita M, Kajiwara H, Hirabayashi K, Takekoshi S et al. (2009). Therapeutic strategy targeting the mTOR‐HIF‐1alpha‐VEGF pathway in ovarian clear cell adenocarcinoma. Pathol Int 59: 19–27. [DOI] [PubMed] [Google Scholar]
- Muller A, Chiotellis A, Keller C, Ametamey SM, Schibli R, Mu L et al. (2014). Imaging tumour ATB0 ,+ transport activity by PET with the cationic amino acid O‐2((2‐[(18)F]fluoroethyl)methyl‐amino)ethyltyrosine. Mol Imaging Biol 16: 412–420. [DOI] [PubMed] [Google Scholar]
- Nicklin P, Bergman P, Zhang B, Triantafellow E, Wang H, Nyfeler B et al. (2009). Bidirectional transport of amino acids regulates mTOR and autophagy. Cell 136: 521–534. [DOI] [PMC free article] [PubMed] [Google Scholar]
- Pei H, Li L, Fridley BL, Jenkins GD, Kalari KR, Lingle W et al. (2009). FKBP51 affects cancer cell response to chemotherapy by negatively regulating Akt. Cancer Cell 16: 259–266. [DOI] [PMC free article] [PubMed] [Google Scholar]
- Penheiter AR, Erdogan S, Murphy SJ, Hart SN, Felipe Lima J, Rakhshan Rohakhtar F et al. (2015). Transcriptomic and immunohistochemical profiling of SLC6A14 in pancreatic ductal adenocarcinoma. Biomed Res Int : 593572. doi:10.1155/2015/593572. [DOI] [PMC free article] [PubMed] [Google Scholar]
- Southan C, Sharman JL, Benson HE, Faccenda E, Pawson AJ, Alexander SP et al. (2016). The IUPHAR/BPS Guide to PHARMACOLOGY in 2016: towards curated quantitative interactions between 1300 protein targets and 6000 ligands. Nucl Acids Res 44: D1054–D1068. [DOI] [PMC free article] [PubMed] [Google Scholar]
- Stroka KM, Konstantopoulos K (2014). Physical biology in cancer. 4. Physical cues guide tumor cell adhesion and migration. Am J Physiol Cell Physiol 306: C98–C109. [DOI] [PMC free article] [PubMed] [Google Scholar]
- Timmerman LA, Holton T, Yuneva M, Louie RJ, Padro M, Daemen A et al. (2013). Glutamine sensitivity analysis identifies the xCT antiporter as a common triple‐negative breast tumor therapeutic target. Cancer Cell 24: 450–465. [DOI] [PMC free article] [PubMed] [Google Scholar]
- Ward PS, Thompson CB (2012). Metabolic reprogramming: a cancer hallmark even Warburg did not anticipate. Cancer Cell 21: 297–308. [DOI] [PMC free article] [PubMed] [Google Scholar]
- Ying JE, Zhu LM, Liu BX (2012). Developments in metastatic pancreatic cancer: is gemcitabine still the standard? World J Gastroenterol 18: 736–745. [DOI] [PMC free article] [PubMed] [Google Scholar]
- Zhang G, He P, Tan H, Budhu A, Gaedcke J, Ghadimi BM et al. (2013). Integration of metabolomics and transcriptomics revealed a fatty acid network exerting growth inhibitory effects in human pancreatic cancer. Clin Cancer Res 19: 4983–4993. [DOI] [PMC free article] [PubMed] [Google Scholar]
- Zoncu R, Efeyan A, Sabatini DM (2011). mTOR: from growth signal integration to cancer, diabetes and ageing. Nat Rev Mol Cell Biol 12: 21–35. [DOI] [PMC free article] [PubMed] [Google Scholar]
Associated Data
This section collects any data citations, data availability statements, or supplementary materials included in this article.
Supplementary Materials
Figure S1 Genetic knockdown of SLC6A14 by shRNA reduces the colony formation capacity of pancreatic cancer cells. The figure shows the colony formation ability in BxPC‐3/Vector control and BxPC‐3/SLC6A14‐shRNA cells. Also shown is the effect of 2.5 mM α‐MT on the vector control and SLC6A14‐silenced BxPC‐3 cells.
Figure S2 Schematic model showing how amino acid entry via SLC6A14 promotes tumour growth and migration/invasion and the consequences of the blockade of the transporter function with α‐MT.
Supporting info item