

Abstract
Background and Purpose
Deciphering chemical mechanism of action (MoA) enables the development of novel therapeutics (e.g. drug repositioning) and evaluation of drug side effects. Development of novel computational methods for chemical MoA assessment under a systems pharmacology framework would accelerate drug discovery and development with greater efficiency and low cost.
Experimental Approach
In this study, we proposed an improved network‐based inference method, balanced substructure‐drug‐target network‐based inference (bSDTNBI), to predict MoA for old drugs, clinically failed drugs and new chemical entities. Specifically, three parameters were introduced into network‐based resource diffusion processes to adjust the initial resource allocation of different node types, the weighted values of different edge types and the influence of hub nodes. The performance of the method was systematically validated by benchmark datasets and bioassays.
Key Results
High performance was yielded for bSDTNBI in both 10‐fold and leave‐one‐out cross validations. A global drug‐target network was built to explore MoA of anticancer drugs and repurpose old drugs for 15 cancer types/subtypes. In a case study, 27 predicted candidates among 56 commercially available compounds were experimentally validated to have binding affinities on oestrogen receptor α with IC50 or EC50 values ≤10 μM. Furthermore, two dual ligands with both agonistic and antagonistic activities ≤1 μM would provide potential lead compounds for the development of novel targeted therapy in breast cancer or osteoporosis.
Conclusion and Implications
In summary, bSDTNBI would provide a powerful tool for the MoA assessment on both old drugs and novel compounds in drug discovery and development.
Abbreviations
- bSDTNBI
balanced substructure‐drug‐target network‐based inference
- DTI
drug–target interaction
- eP
precision enhancement
- eR
recall enhancement
- ERα
oestrogen receptor α
- E2
estradiol
- MoA
mechanism of action
- NBI
network‐based inference
- P
precision
- R
recall
- ROC
receiver operating characteristic
Tables of Links
| TARGETS | |
|---|---|
| Nuclear hormone receptors a | GPCRs b |
| ERα, oestrogen receptor α | 5‐HT1A receptor |
| PPARγ | 5‐HT1D receptor |
| RARB | Enzymes c |
| RXRA | CA1 |
| Dipeptidyl peptidase IV |
These Tables list key protein targets and ligands in this article that are hyperlinked to corresponding entries in http://www.guidetopharmacology.org, the common portal for data from the IUPHAR/BPS Guide to PHARMACOLOGY (Southan et al., 2016), and are permanently archived in the Concise Guide to PHARMACOLOGY 2015/16 (a,b,cAlexander et al., 2015a,b,c).
Introduction
Drug discovery and development is a complex, expensive and time‐consuming process with high risk (DiMasi et al., 2003; Adams and Brantner, 2006) and only about 10% of drug candidates in phase I trials were finally approved by the U.S. Food and Drug Administration (FDA) (Hay et al., 2014). Many drug candidates with ideal effects in vitro and good pharmacokinetic properties failed in phases II and III because of low efficacy or safety problems (Arrowsmith, 2011a,b). One possible reason of this high clinical attrition rate might be due to the classical hypothesis of ‘one gene, one drug, one disease’ in the traditional drug discovery paradigm (Hopkins, 2008; Zhang et al., 2015). Recent studies have suggested that a single drug might have interactions with multiple targets in vivo, rather than acting as a ‘magic bullet’ that selectively binds to a specific target (Roth et al., 2004; Yildirim et al., 2007; Hopkins, 2008). The on‐target and off‐target effects of drugs lead to both desired therapeutic effects and undesired side effects or toxicity. Such a novel paradigm of ‘one drug, multiple targets’ under a systems pharmacology framework enables us to identify new drug–target interactions (DTIs) for further understanding chemical mechanism of action (MoA), enabling the characterization of drug side effects and the identification of old drugs for new uses (i.e. drug repositioning). Currently, there are over 68 million commercially available compounds with biologically relevant representations in chemical databases (e.g. ZINC database), including a large number of described natural products (Lucas et al., 2015). However, the traditional experimental assays are always expensive and time‐consuming. Therefore, it is urgent to develop novel computational methods for DTI prediction and chemical MoA assessment to accelerate drug discovery and development with greater efficiency and low cost.
Currently, there are several types of computational methods for DTI prediction and drug repositioning, including molecular docking‐based (Luo et al., 2011; Lu et al., 2015), pharmacophore‐based (Cheng et al., 2010; Xu et al., 2010), machine learning‐based (Yamanishi et al., 2008; Yamanishi et al., 2010; Cheng et al., 2012a), similarity‐based (Campillos et al., 2008; Keiser et al., 2009; Cheng et al., 2013), network‐based (Cheng et al., 2012c, 2012d) and network perturbation methods (Woo et al., 2015). Compared with traditional methods such as molecular docking and machine learning, network‐based ones have obvious advantages. For example, network‐based methods do not rely on either three‐dimensional structures of target proteins or negative samples.
In recent years, several network‐based methods were proposed and successfully demonstrated their potential applications in DTI prediction and drug repositioning for speeding up drug discovery and development. For instance, Cheng et al., 2012d presented three network‐based methods derived from recommendation algorithms for social networks, namely drug‐based similarity inference, target‐based similarity inference and network‐based inference (NBI) (Cheng et al., 2012d). Furthermore, five old drugs were identified via NBI and then experimentally validated to have potential binding effects on oestrogen receptors (ERs) or dipeptidyl peptidase IV in vitro (Cheng et al., 2012d). As an improvement of NBI, they further developed two weighted NBI methods, edge‐weighted NBI (EWNBI) and node‐weighted NBI (NWNBI), by assigning the weighted values to edges and nodes in the DTI network respectively (Cheng et al., 2012c). These two improved methods slightly outperformed original NBI. Other additional knowledge, such as chemical structure similarity and target similarity, was also demonstrated to have potential in improving model performance for network‐based methods (Chen et al., 2012; Alaimo et al., 2013).
However, these network‐based methods can only predict potential targets for known drugs in existing DTI networks, due to lack of connections between novel compounds and existing DTI networks. To address this deficiency, our group recently proposed a new network‐based method, named substructure‐drug‐target network‐based inference (SDTNBI), for DTI prediction and drug repositioning (Wu et al., 2016). SDTNBI employed chemical substructures to bridge the gap between new chemical entities and known DTI networks. By utilizing a way of resource diffusion, it can prioritize potential targets for old drugs, clinically failed drugs and new chemical entities in a large scale. However, there are still several potential limitations in SDTNBI. For instance, it is not known if introducing tunable parameters to SDTNBI could improve the method performance.
In this study, we have made a further improvement on SDTNBI, namely balanced substructure‐drug‐target network‐based inference (bSDTNBI), to identify the MoA for both old drugs and new chemical entities. The model performance was improved by introducing three parameters into the original SDTNBI by adjusting: (i) the initial resource allocation of different nodes (i.e. substructure nodes and target nodes); (ii) the weighted values of different edges (i.e. drug‐substructure associations and DTIs); and (iii) the influence of hub nodes respectively (Figure 1). High performance was yielded in both 10‐fold and leave‐one‐out cross validations, outperforming previously published methods. As a proof of concept, several old drugs (e.g. anti‐diabetic or tricyclic anti‐depressant drugs) were computationally identified to target well‐known cancer gene products (proteins) via bSDTNBI, providing potential drug repurposing candidates for the development of novel targeted cancer therapy. Furthermore, 56 commercially available compounds predicted to target on oestrogen receptor α (ERα) were purchased and experimentally validated by in vitro bioassays, with approximate 50% success rate, such that we were able to identify 27 active compounds with IC50 or EC50 values < 10 μM.
Figure 1.
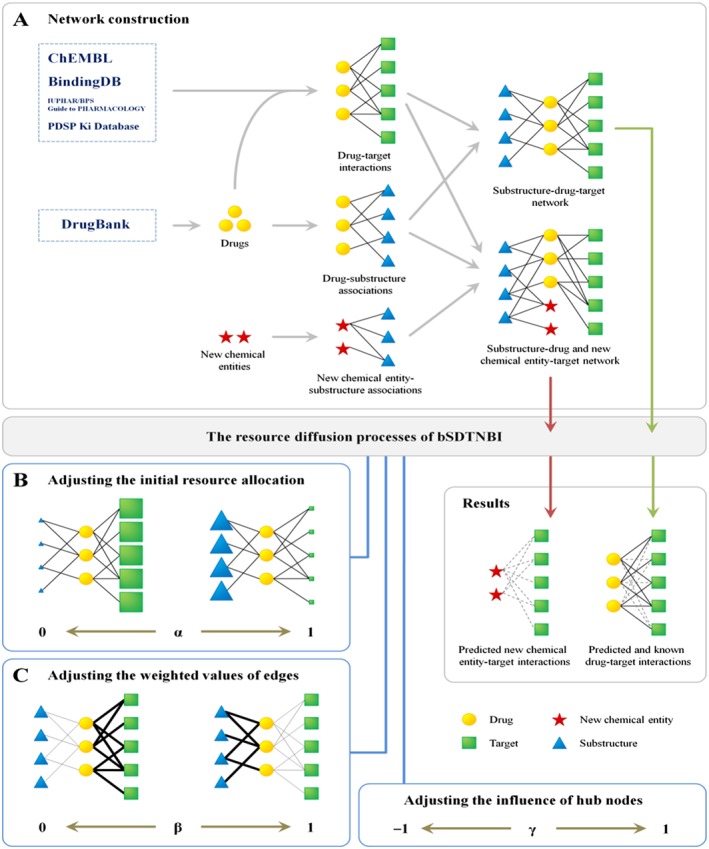
Schematic diagram of bSDTNBI. (A) The construction of substructure‐drug (and new chemical entity)‐target network, (B) adjusting the initial resource allocation of different node types by parameter α, (C) adjusting the weighted values of different edge types by parameter β.
Methods
Construction of DTI networks
Two benchmark DTI networks for GPCRs and the kinase superfamily (Kinases for short) were constructed as described in our previous study (Cheng et al., 2012c). A global DTI network covering human genome‐wide target proteins was further built. Specifically, bioactivity data for DTI pairs were collected from four databases, including ChEMBL (version 20, accessed in June, 2015) (Gaulton et al., 2012), BindingDB (downloaded in December, 2015) (Liu et al., 2007), IUPHAR/BPS Guide to PHARMACOLOGY (downloaded in December, 2015) (Pawson et al., 2014) and PDSP Ki Database (downloaded in December, 2015) (Roth et al., 2000). Drug molecules were extracted from the DrugBank database (version 4.3) (Law et al., 2014). All chemical structures from these databases were prepared by the OpenBabel toolkit (version 2.3.2) (O'Boyle et al., 2011). In the preparation processes, dative bonds were standardized, salt ions were removed, chemical structures were converted into canonical SMILES format and molecular weights were calculated. After extracting the bioactivity data related to the drugs from the prepared bioactivity databases, only those items meeting the following five criteria were retained: (i) Ki, Kd, IC50 or EC50 ≤ 10 μM; (ii) the target protein can be represented by a unique UniProt accession number; (iii) the target protein was marked as ‘reviewed’ in the UniProt database (Apweiler et al., 2004); (iv) the target protein is from Homo sapiens; (v) the molecular weight of compound ranged from 100 ‐600 Daltons. Finally, the global DTI network was built with the filtered bioactivity data.
Description of chemical substructures
In this study, we selected four commonly used types of fingerprints to generate chemical substructures for molecules in each dataset, including Substructure Fingerprint (FP4), Klekota‐Roth Fingerprint (KR), MACCS Fingerprint (MACCS) and PubChem Fingerprint (PubChem). Those fingerprints were calculated via the PaDEL‐Descriptor software (version 2.18) (Yap, 2011).
Overview of bSDTNBI method
As shown in Figure 1, bSDTNBI can (i) use resource diffusion processes in a ‘substructure‐drug‐target network’ to prioritize potential targets for known drugs, or (ii) use those in a ‘substructure‐drug and new chemical entity‐target network’ to predict potential targets for both known drugs and new chemical entities. For convenience, these two networks were called ‘substructure‐drug‐target network’ below, because new chemical entities can be labelled as special drugs without known targets. The resource diffusion processes in bSDTNBI are similar to those we have used in the original SDTNBI (Wu et al., 2016). The main improvement is that three tunable parameters (symbolized as α, β and γ) were introduced to adjust (i) the initial resource allocation of different node types; (ii) the weighted values of different edge types; and (iii) the influence of hub nodes respectively. By varying these parameters in their definition domains, we can search which parameter values will contribute to the performance of the models built via bSDTNBI. The details of the resource diffusion processes and the three parameters were described in Supporting Information.
Parameter optimization
To maximize the performance of the models built via bSDTNBI, the values of the three introduced parameters should be selected appropriately. Here, a grid search approach using 10‐fold cross validation was employed to achieve this goal. To reduce the computation time, the procedure of parameter optimization was divided into two steps. At first, we assumed that γ = 0, namely ignoring the influence of hub nodes. The optimal values of α and β were searched in the range of 0 ≤ α < 1 and 0 ≤ β < 1 with a step length of 0.1. Then, under the optimal values of α and β, the optimal value of parameter γ was searched in the range of −1.0 to 1.0 with a step length of 0.1. Moreover, for the issue of the number of resource diffusion processes (symbolized as k), we selected k = 2 as described in our previous study (Wu et al., 2016).
Benchmark evaluation
In this study, both 10‐fold and leave‐one‐out cross validations were employed to evaluate the performance of bSDTNBI and other methods. These two types of cross‐validations utilize different ways to generate the pairs of test set and training set, which were described in our previous study (Wu et al., 2016).
Ten‐fold cross validation
During 10‐fold cross validation, 10% of DTIs were randomly separated from the substructure‐drug‐target network as the test set in turn. The remnant network containing the other 90% of DTIs and all drug‐substructure associations was used as the training set. In this study, in order to reduce the randomness, the 10‐fold cross validation was repeated by 10 times.
Leave‐one‐out cross validation
The predictive ability for new chemical entities was further evaluated by leave‐one‐out cross validation. During leave‐one‐out cross validation, DTIs for each drug were separated from the substructure‐drug‐target network to use as the test set in turn. The remnant network containing the DTIs of the other drugs and all drug‐substructure associations was used as the training set.
Evaluation indicator calculation
For each pair of test set and training set, bSDTNBI was utilized in the training set, and then several types of evaluation indicators were calculated by comparing the newly predicted DTIs with the test set. Specifically, on the one hand, a receiver operating characteristic (ROC) curve was drawn for each test‐training pair, and the AUC was computed to assess the model performance. For a model, higher AUC values in cross validations usually mean higher ability of distinguishing positive DTIs from all possible DTIs (Lü et al., 2012). On the other hand, considering that people are often concerned only with the predicted targets ranked in the top‐L places for each drug, we calculated other four types of L‐dependent evaluation indicators: precision (P), recall (R), precision enhancement (eP) and recall enhancement (eR). In general, with a given L value, higher values of P(L), R(L), eP(L) and eR(L) reveal higher model performance. The details of these evaluation indicators were described in our previous studies (Cheng et al., 2012c, 2012d; Wu et al., 2016). In addition, if more than one group of evaluation indicators were generated, the mean values and standard deviations (mean ± SD) of each evaluation indicator were further calculated to measure the model performance.
Construction of cancer drug‐gene network
To demonstrate the potential application of drug repositioning via bSDTNBI, we next showed how to identify new MoA for anticancer drugs and repurpose old drugs for the development of targeted cancer therapy. At first, cancer driver genes for 15 cancer types or subtypes were collected from The Cancer Genome Atlas, as described in a previous study (Cheng et al., 2016b) and cancer‐associated genes across 15 cancer types or subtypes were further collected from four public databases, including the Online Mendelian Inheritance in Man database (Hamosh et al., 2005), HuGE Navigator (Yu et al., 2008), PharmGKB (Hewett et al., 2002) and Comparative Toxicogenomics Database (Davis et al., 2009). Then, potential targets ranked in top five with highest scores for approved drugs were predicted by the best global model of bSDTNBI during 10‐fold cross validation. Finally, a global cancer drug‐gene network was generated using the CytoScape software (version 3.3.0) (Shannon et al., 2003). Circles representing drug nodes were coloured by their first‐level Anatomical Therapeutic Chemical Classification codes described in our previous studies (Cheng et al., 2012c, 2012d).
Identifying novel ligands for oestrogen receptor α (ERα)
To test the application of bSDTNBI, we experimentally assayed several novel predicted ligands for ERα as a case study. The compound collection we used was collected from Enamine (http://www.enamine.net/, downloaded in March 2013). All molecules in this database were firstly filtered by Lipinski's Rule of Five. Then, chemical similarity search was used to filter further, using the five ER ligands discovered by our previous study (Chen et al., 2014) as reference ligands. Here, the FCFP_4 fingerprint was used to perform the chemical similarity screening according to a previous study (Hu et al., 2012). Compounds with Tanimoto coefficients between 0.45 and 0.99 were used as input for bSDTNBI prediction. The best global model during 10‐fold cross validation was utilized to predict potential targets for these compounds. For each compound, if ERα was ranked in top 20 with the highest predictive scores, this compound was kept as a potential ligand for ERα. Based on this cut‐off, 56 commercially available compounds from the top predicted candidates were purchased for further experimental assays on ERα.
Yeast two‐hybrid assay
To evaluate the activity of the purchased compounds, the yeast two‐hybrid system for ERα was carried out as described previously (Shen et al., 2010). In brief, we transformed two expression plasmids, pGBKT7‐ERα‐LBD (amino acid residues 301–553) and pGADT7‐SRC1 (amino acid residues 613–773), into yeast cell AH109 by Yeast Protocols Handbook. Yeast transformants were cultured in ‐Trp, ‐Leu selective media, and then added 1 nM Estradiol (E2) in antagonist test (Shen et al., 2010). Each test was accompanied by E2 as a positive control and DMSO as a negative control (Kawamura et al., 2003). The culture (500 μL) in a small tube was mixed with indicated chemical and incubated for 24 h at 30°C. After incubation, 200 μL of the culture was placed into each of the 96 wells of a microplate and the absorbancy measured at 600 nm using Perkin Elmer Multimode Plate Reader (Evision). The supernatant (16 μL) was mixed with α‐galactosidase (48 μL) in 96 wells of a microplate and incubated for 2 h usually at 30°C. Before the reaction was stopped by the addition of 1 M Na2CO3 (136 μL) and the lysate reacted until development of a yellow colour. The absorbances at 410 nm were read on a microplate reader to estimate α‐galactosidase activity (Nishihara et al., 2000). The formula for calculating the α‐galactosidase activity as follows:
| (1) |
Where Vf = final volume of testing (200 μL), Vi = volume of medium supernatant, t = time of incubation (min), OD600 = optical density of yeast culture and ε × b = p‐nitrophenol molar absorptivity at 410 nm × the light path (cm) = 10.5 mL·μmol−1 (Shen et al., 2010).
Results
Statistics of the benchmark datasets
bSDTNBI uses the substructure‐drug‐target network to predict potential new targets for known drugs and new chemical entities. A substructure‐drug‐target network can be constructed by integrating known DTIs, drug‐substructure association and new chemical entity‐substructure associations (Figure 1A). In general, the bipartite graph was employed to represent a number of DTIs and those drugs and targets they connected (Yildirim et al., 2007), where nodes denote drugs or targets, and edges denote experimentally validated DTIs (e.g. binding affinity Ki, Kd, IC50 or EC50 ≤ 10 μM). In this study, three DTI networks were built: (i) GPCRs, containing 17 111 interactions between 4741 molecules and 97 GPCRs; (ii) Kinases, containing 13 647 interactions between 2827 molecules and 206 kinases; (iii) the global network (Global for short), containing 10 650 DTIs between 1872 drugs and 1085 human target proteins. The numbers of drugs, targets and interactions for these DTI networks were provided in Table 1. Furthermore, for each DTI network, drug‐substructure networks were built by generating substructures for all its drugs using the four selected types of fingerprints. The number of drugs, substructures and drug‐substructure associations for these drug‐substructure networks were provided in Table S1.
Table 1.
The statistics of DTI networks
| Target | ND | NT | NDT | Sparsity (%) |
|---|---|---|---|---|
| GPCRs | 4741 | 97 | 17 111 | 3.72 |
| Kinases | 2827 | 206 | 13 647 | 2.34 |
| Global | 1872 | 1085 | 10 650 | 0.52 |
ND, the number of drugs; NT, the number of targets; NDT, the number of DTIs; Sparsity, the ratio of NDT to the number of all possible DTIs.
Performance of bSDTNBI in cross validation
In a substructure‐drug‐target network, each drug node has two types of neighbour nodes representing substructures and targets respectively (Figure 1A). However, in our previous study of original SDTNBI (Wu et al., 2016), we did not differentiate them during the resource diffusion processes. Firstly, in initial resource allocation, for each drug, an equal amount of initial resource was allocated to each of its neighbour nodes, no matter if it is a substructure node or a target node (Wu et al., 2016). Meanwhile, the equal‐weighted values were set for each of its edges, no matter if it is a drug‐substructure association or a DTI (Wu et al., 2016). These factors without distinction of different node types and edge types might result in potential unbalances and decrease the method performance. To solve this problem, two parameters (symbolized as α and β) were introduced to balance the initial resource allocation of different node types and the weighted values of different edge types respectively.
In addition, in a real DTI network, some proteins can be targeted by multiple drugs, and some drugs can act on various proteins (Yildirim et al., 2007). For example, FDA approved kinase inhibitors often have binding affinities with multiple kinases harbouring similar ATP binding pockets, which have demonstrated their high efficiency for targeted cancer therapies in clinical practice (Knight et al., 2010). GPCRs are often targeted by multiple small molecules due to their promiscuous ligand‐binding pockets (Jacobson et al., 2014). These drug nodes and target nodes connecting a large number of neighbours (i.e. with high degree) are called hub nodes. In network‐based resource diffusion processes, hub nodes usually receive more amount of resource, resulting in higher predicted scores and rankings in prediction results (Cheng et al., 2012c, 2012d). This could cause a high risk of false positive rate. To allow for this, a parameter (symbolized as γ) was introduced to balance the influence of hub nodes.
In this study, the 10‐fold cross validation was used to optimize the introduced three parameters and evaluate the performance of bSDTNBI. The parameters α and β were firstly optimized under the condition of ignoring the influence of hub nodes (γ = 0). The relationships among α, β and the average AUC value for the models of Global, GPCRs and Kinases in 10‐fold cross validation were shown in Figure 2, Figure S1 and S2 respectively. These evaluations revealed that the model performance was influenced by both α and β, and was changed dramatically by α compared with β. For most models, their performance can be maximized (or nearly maximized) when α = 0.1 and β = 0.1. Hence, we considered 0.1 as an appropriate value for both α and β. Under this condition, the highest AUC values 0.957 ± 0.003, 0.992 ± 0.001 and 0.981 ± 0.002 were obtained for the models of Global‐KR, GPCRs‐KR and Kinases‐KR in 10‐fold cross validation respectively. These figures suggest that higher model performance can result from allocating more amount of initial resource to target nodes than those of substructure nodes (giving a small α value), and setting bigger weighted values of DTIs than those of drug‐substructure associations (giving a small β value).
Figure 2.
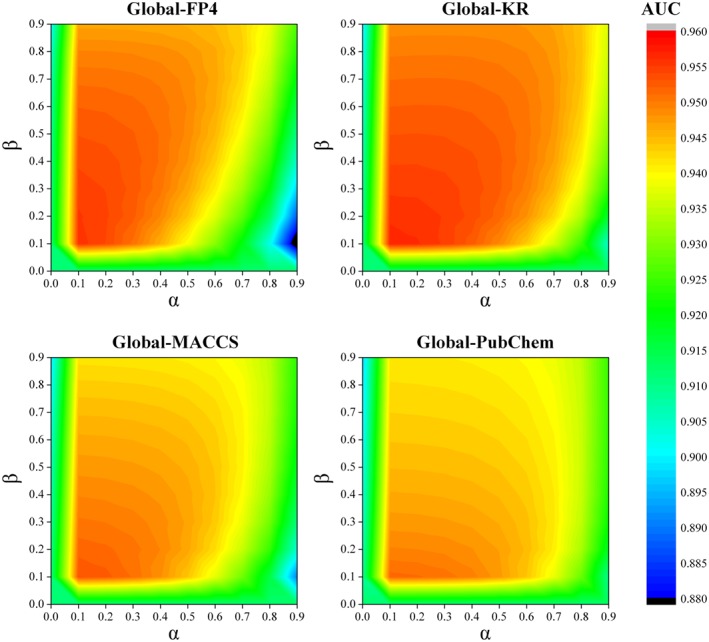
The relationships among two parameters α, β and the average AUC value for the models of Global in 10‐fold cross validation. These figures suggest that higher model performance can be yielded from allocating more amount of initial resource to target nodes than those of substructure nodes (giving a small α value), and setting bigger weighted values of DTIs than those of drug‐substructure associations (giving a small β value).
Subsequently, the influence of hub nodes was investigated under the above selected condition by 10‐fold cross validation. The relationships among γ and the average AUC value for the models of Global, GPCRs and Kinases were given in Figure 3. For each model, its AUC value was maximized by setting a negative γ. Figure 3 revealed that the best performance was yielded by setting γ = −0.5 for the models of Global, and γ = −0.4 for the models of GPCRs and Kinases. Under the optimal condition, the evaluation indicators for the models of Global, GPCRs and Kinases were given in Table 2. The highest AUC values 0.961 ± 0.003, 0.993 ± 0.001 and 0.983 ± 0.002 were obtained for the models of Global‐KR, GPCRs‐KR and Kinases‐KR in 10‐fold cross validation respectively. These observations suggest that the model performance can be further improved by appropriately weakening the influence of hub nodes by setting a negative γ.
Figure 3.
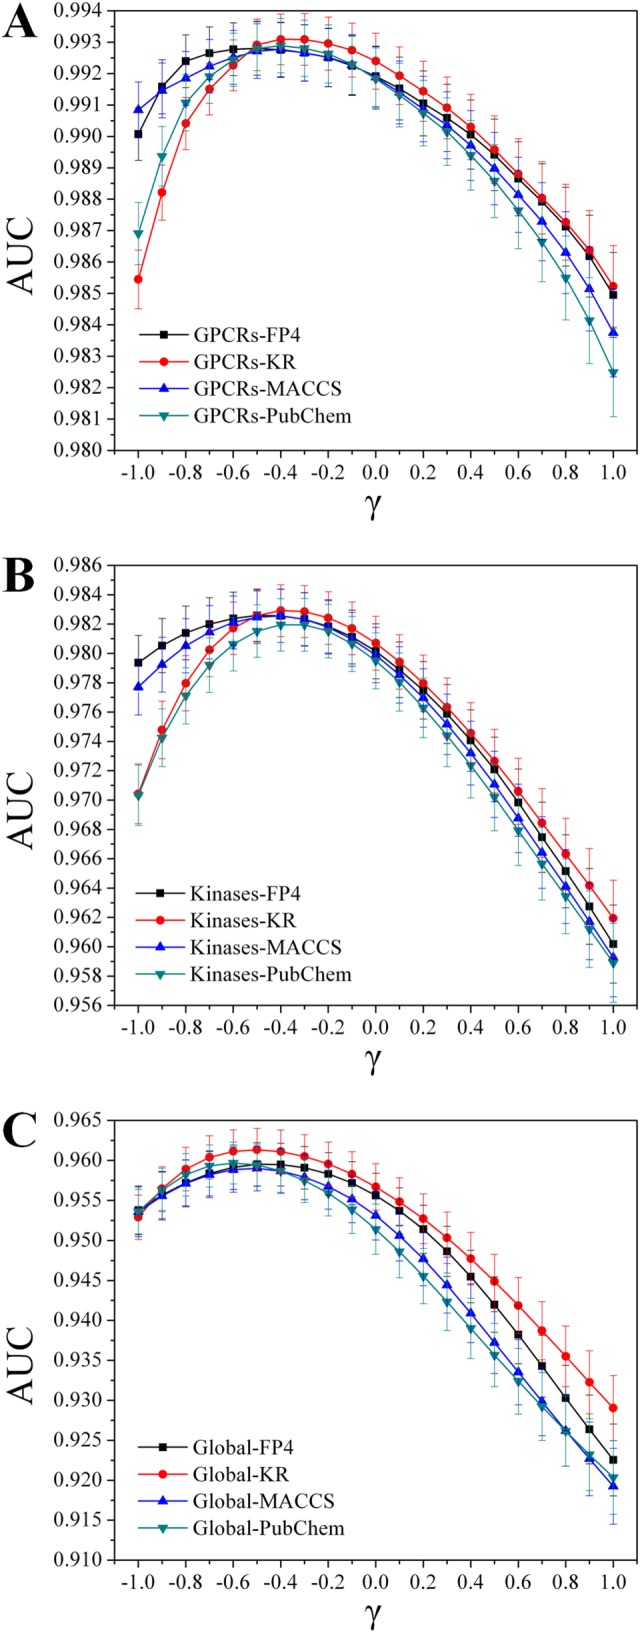
The relationships among parameter γ and the AUC value for the models of (A) GPCRs, (B) Kinases and (C) Global in 10‐fold cross validation. These figures suggest that the model performance can be further improved by appropriately weakening the influence of hub nodes by setting a negative γ.
Table 2.
The performance of the models built via NBI, SDTNBI and bSDTNBI under the optimal condition in 10‐fold cross validation
| Method | Target | FP | P (L = 20) | R (L = 20) | eP (L = 20) | eR (L = 20) | AUC |
|---|---|---|---|---|---|---|---|
| NBI | Global | – | 0.072 ± 0.002 | 0.770 ± 0.017 | 34.73 ± 0.87 | 40.75 ± 0.93 | 0.912 ± 0.005 |
| GPCRs | – | 0.058 ± 0.001 | 0.998 ± 0.001 | 4.74 ± 0.06 | 4.74 ± 0.06 | 0.988 ± 0.001 | |
| Kinases | – | 0.061 ± 0.001 | 0.963 ± 0.005 | 9.72 ± 0.09 | 9.79 ± 0.09 | 0.974 ± 0.002 | |
| SDTNBI | Global | FP4 | 0.061 ± 0.002 | 0.659 ± 0.018 | 31.82 ± 0.87 | 34.89 ± 1.00 | 0.951 ± 0.003 |
| KR | 0.059 ± 0.002 | 0.635 ± 0.019 | 30.97 ± 0.94 | 33.62 ± 1.03 | 0.949 ± 0.003 | ||
| MACCS | 0.053 ± 0.002 | 0.530 ± 0.021 | 27.72 ± 0.98 | 28.06 ± 1.16 | 0.939 ± 0.003 | ||
| PubChem | 0.046 ± 0.002 | 0.428 ± 0.020 | 23.91 ± 0.94 | 22.64 ± 1.06 | 0.927 ± 0.004 | ||
| GPCRs | FP4 | 0.057 ± 0.001 | 0.980 ± 0.003 | 4.65 ± 0.06 | 4.66 ± 0.06 | 0.966 ± 0.002 | |
| KR | 0.057 ± 0.001 | 0.976 ± 0.004 | 4.63 ± 0.06 | 4.64 ± 0.07 | 0.960 ± 0.002 | ||
| MACCS | 0.055 ± 0.001 | 0.945 ± 0.006 | 4.47 ± 0.07 | 4.49 ± 0.07 | 0.931 ± 0.002 | ||
| PubChem | 0.052 ± 0.001 | 0.903 ± 0.007 | 4.27 ± 0.06 | 4.29 ± 0.06 | 0.918 ± 0.003 | ||
| Kinases | FP4 | 0.055 ± 0.001 | 0.868 ± 0.010 | 8.75 ± 0.12 | 8.83 ± 0.13 | 0.956 ± 0.003 | |
| KR | 0.056 ± 0.001 | 0.877 ± 0.009 | 8.82 ± 0.11 | 8.92 ± 0.11 | 0.958 ± 0.003 | ||
| MACCS | 0.047 ± 0.001 | 0.737 ± 0.013 | 7.40 ± 0.14 | 7.50 ± 0.14 | 0.925 ± 0.003 | ||
| PubChem | 0.042 ± 0.001 | 0.671 ± 0.012 | 6.72 ± 0.13 | 6.83 ± 0.13 | 0.903 ± 0.003 | ||
| bSDTNBI | Global | FP4 | 0.067 ± 0.002 | 0.747 ± 0.017 | 35.06 ± 0.90 | 39.50 ± 0.92 | 0.960 ± 0.003 |
| KR | 0.069 ± 0.002 | 0.767 ± 0.015 | 35.85 ± 0.91 | 40.57 ± 0.87 | 0.961 ± 0.003 | ||
| MACCS | 0.067 ± 0.002 | 0.736 ± 0.018 | 34.99 ± 0.93 | 38.95 ± 1.00 | 0.959 ± 0.003 | ||
| PubChem | 0.067 ± 0.002 | 0.728 ± 0.019 | 34.89 ± 0.91 | 38.53 ± 1.02 | 0.959 ± 0.003 | ||
| GPCRs | FP4 | 0.058 ± 0.001 | 0.997 ± 0.001 | 4.73 ± 0.06 | 4.74 ± 0.06 | 0.993 ± 0.001 | |
| KR | 0.058 ± 0.001 | 0.997 ± 0.001 | 4.74 ± 0.06 | 4.74 ± 0.06 | 0.993 ± 0.001 | ||
| MACCS | 0.058 ± 0.001 | 0.997 ± 0.001 | 4.73 ± 0.06 | 4.74 ± 0.06 | 0.993 ± 0.001 | ||
| PubChem | 0.058 ± 0.001 | 0.997 ± 0.001 | 4.73 ± 0.06 | 4.74 ± 0.06 | 0.993 ± 0.001 | ||
| Kinases | FP4 | 0.062 ± 0.001 | 0.966 ± 0.005 | 9.76 ± 0.09 | 9.83 ± 0.09 | 0.983 ± 0.002 | |
| KR | 0.062 ± 0.001 | 0.967 ± 0.005 | 9.77 ± 0.09 | 9.84 ± 0.09 | 0.983 ± 0.002 | ||
| MACCS | 0.061 ± 0.001 | 0.966 ± 0.005 | 9.75 ± 0.09 | 9.82 ± 0.09 | 0.983 ± 0.002 | ||
| PubChem | 0.061 ± 0.001 | 0.963 ± 0.005 | 9.72 ± 0.09 | 9.80 ± 0.09 | 0.982 ± 0.002 |
Values of evaluation indicators are expressed as mean ± SD. FP, the fingerprint type used in generating drug‐substructure linkages.
Besides 10‐fold cross validation, leave‐one‐out cross validation was further employed to evaluate the models built via bSDTNBI. Under the optimal condition, the evaluation indicators for the models of Global, GPCRs and Kinases were given in Table 3. The highest AUC values were 0.919 ± 0.144, 0.965 ± 0.061 and 0.960 ± 0.080 for the models of the models of Global, GPCRs and Kinases in leave‐one‐out cross validation, respectively, further suggesting the high performance during predicting targets for novel compounds via bSDTNBI.
Table 3.
The performance of the models built via SDTNBI and bSDTNBI under the optimal condition in leave‐one‐out cross validation
| Method | Target | FP | P (L = 20) | R (L = 20) | eP (L = 20) | eR (L = 20) | AUC |
|---|---|---|---|---|---|---|---|
| SDTNBI | Global | FP4 | 0.076 ± 0.144 | 0.353 ± 0.410 | 19.16 ± 22.22 | 19.16 ± 22.22 | 0.892 ± 0.146 |
| KR | 0.102 ± 0.171 | 0.479 ± 0.435 | 25.96 ± 23.60 | 25.96 ± 23.60 | 0.911 ± 0.149 | ||
| MACCS | 0.070 ± 0.160 | 0.243 ± 0.364 | 13.19 ± 19.76 | 13.19 ± 19.76 | 0.868 ± 0.160 | ||
| PubChem | 0.063 ± 0.152 | 0.212 ± 0.344 | 11.52 ± 18.66 | 11.52 ± 18.66 | 0.860 ± 0.167 | ||
| GPCRs | FP4 | 0.154 ± 0.063 | 0.877 ± 0.261 | 4.25 ± 1.26 | 4.25 ± 1.26 | 0.922 ± 0.092 | |
| KR | 0.166 ± 0.059 | 0.940 ± 0.179 | 4.56 ± 0.87 | 4.56 ± 0.87 | 0.951 ± 0.072 | ||
| MACCS | 0.147 ± 0.068 | 0.834 ± 0.312 | 4.04 ± 1.51 | 4.04 ± 1.51 | 0.908 ± 0.103 | ||
| PubChem | 0.150 ± 0.067 | 0.850 ± 0.301 | 4.12 ± 1.46 | 4.12 ± 1.46 | 0.915 ± 0.105 | ||
| Kinases | FP4 | 0.143 ± 0.080 | 0.648 ± 0.338 | 6.67 ± 3.48 | 6.67 ± 3.48 | 0.906 ± 0.099 | |
| KR | 0.187 ± 0.107 | 0.815 ± 0.290 | 8.40 ± 2.99 | 8.40 ± 2.99 | 0.949 ± 0.084 | ||
| MACCS | 0.134 ± 0.083 | 0.600 ± 0.346 | 6.18 ± 3.56 | 6.18 ± 3.56 | 0.894 ± 0.104 | ||
| PubChem | 0.135 ± 0.085 | 0.603 ± 0.344 | 6.21 ± 3.54 | 6.21 ± 3.54 | 0.896 ± 0.103 | ||
| bSDTNBI | Global | FP4 | 0.045 ± 0.053 | 0.393 ± 0.433 | 21.30 ± 23.50 | 21.30 ± 23.50 | 0.891 ± 0.149 |
| KR | 0.095 ± 0.121 | 0.593 ± 0.427 | 32.17 ± 23.15 | 32.17 ± 23.15 | 0.919 ± 0.144 | ||
| MACCS | 0.049 ± 0.064 | 0.373 ± 0.422 | 20.21 ± 22.91 | 20.21 ± 22.91 | 0.888 ± 0.149 | ||
| PubChem | 0.065 ± 0.097 | 0.395 ± 0.418 | 21.44 ± 22.67 | 21.44 ± 22.67 | 0.897 ± 0.144 | ||
| GPCRs | FP4 | 0.158 ± 0.059 | 0.898 ± 0.228 | 4.36 ± 1.11 | 4.36 ± 1.11 | 0.926 ± 0.090 | |
| KR | 0.169 ± 0.058 | 0.956 ± 0.154 | 4.64 ± 0.75 | 4.64 ± 0.75 | 0.965 ± 0.061 | ||
| MACCS | 0.149 ± 0.066 | 0.850 ± 0.291 | 4.12 ± 1.41 | 4.12 ± 1.41 | 0.914 ± 0.100 | ||
| PubChem | 0.153 ± 0.065 | 0.867 ± 0.282 | 4.20 ± 1.37 | 4.20 ± 1.37 | 0.924 ± 0.098 | ||
| Kinases | FP4 | 0.143 ± 0.075 | 0.671 ± 0.344 | 6.91 ± 3.54 | 6.91 ± 3.54 | 0.912 ± 0.100 | |
| KR | 0.197 ± 0.107 | 0.863 ± 0.266 | 8.89 ± 2.74 | 8.89 ± 2.74 | 0.960 ± 0.080 | ||
| MACCS | 0.137 ± 0.073 | 0.643 ± 0.338 | 6.62 ± 3.48 | 6.62 ± 3.48 | 0.901 ± 0.101 | ||
| PubChem | 0.142 ± 0.081 | 0.648 ± 0.342 | 6.67 ± 3.52 | 6.67 ± 3.52 | 0.905 ± 0.099 |
Values of evaluation indicators are expressed as mean ± SD. FP, the fingerprint type used in generating drug‐substructure linkages.
Comparison with previous methods
As an improvement of the previously developed NBI and SDTNBI methods (Cheng et al., 2012d; Wu et al., 2016), the newly developed bSDTNBI has several key differences. bSDTNBI can predict potential targets for those compounds without known targets, such as clinically failed drugs and newly synthesized chemical entities, whereas NBI cannot. Compared with the unweighted network approach SDTNBI, bSDTNBI introduced three parameters to adjust the initial resource allocation of different node types, the weighted values of different edge types and the influence of hub nodes respectively. As described above, a reasonable selection of the parameter values could solve several potential problems, such as the imbalance resulting from the hub nodes.
We tested whether the model performance would benefit from this improvement. The performance of bSDTNBI was compared with NBI and SDTNBI, via 10‐fold or leave‐one‐out cross validation. NBI that cannot predict potential targets for new chemical entities was excluded during leave‐one‐out cross validation. All models participated in evaluation were built under the aforementioned optimal condition: (i) k = 2 for the models built via SDTNBI; (ii) k = 2, α = 0.1, β = 0.1 and γ = −0.5 for the models of Global built via bSDTNBI; and (iii) k = 2, α = 0.1, β = 0.1 and γ = −0.4 for the models of GPCRs and Kinases built via bSDTNBI. Tables 2 and 3 reveal that bSDTNBI outperformed SDTNBI across four types of fingerprints in both 10‐fold and leave‐one‐out cross validations. The performance of bSDTNBI was comparable with or marginally outperformed NBI in prioritizing potential targets for known drugs in 10‐fold cross validation. These results suggested that balancing the initial resource allocation of different node types, the weighted values of different edge types and the influence of hub nodes in resource diffusion processes could play critical roles in improving the accuracy of predicting potential targets for both old drugs and new chemical entities. Altogether, bSDTNBI outperform several previously published methods.
Discovery of new MoA of anticancer drugs and repurposing existing drugs for targeted cancer therapy
In this case study, a global cancer drug‐gene network (Figure 4) was built, which contains: (i) 2100 known and 1355 newly predicted DTIs between 666 approved drugs and 369 cancer gene products, and (ii) 1533 cancer‐gene associations connecting 15 cancer types and subtypes. Figure 4 provides useful information for repurposing approved therapeutic agents as novel anticancer indications or exploring new MoA for known anticancer agents. The detailed data were provided in our website (http://lmmd.ecust.edu.cn/methods/bsdtnbi/).
Figure 4.
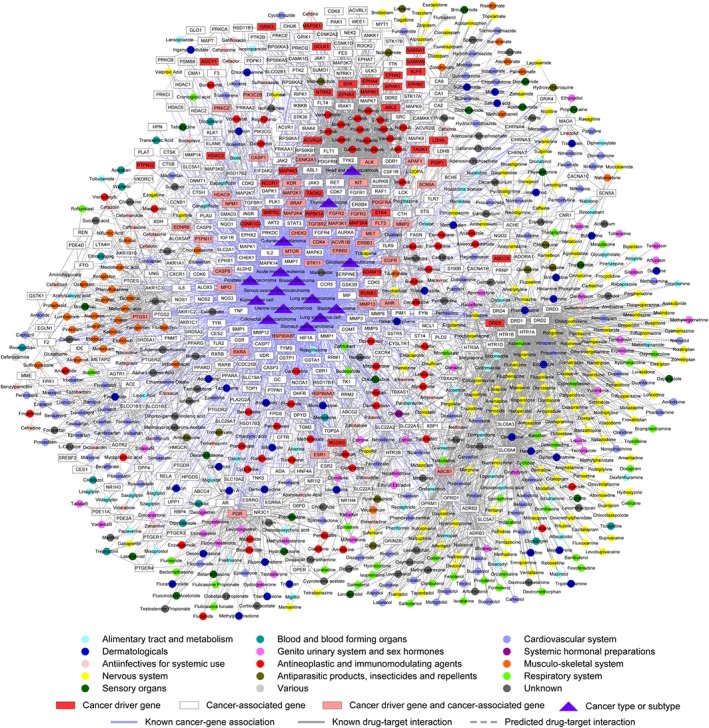
The newly discovered drug‐gene‐disease network by bSDTNBI. This figure was generated by CytoScape (version 3.3.0, http://www.cytoscape.org/). Circles representing drug nodes were coloured by their first‐level Anatomical Therapeutic Chemical Classification codes.
Recent studies have suggested that tricyclic anti‐depressant agents (e.g. clomipramine and promethazine) could induce apoptosis in several types of cancer cells, such as small cell lung cancer (Jahchan et al., 2013) and glioma (Shchors et al., 2015). However, the MoA for these anticancer drugs remains unclear (Cheng et al., 2016a; Li et al., 2016). As shown in Figure 4, clomipramine and promethazine were predicted to target on 5‐HT1A or 5‐HT1D receptors with the high predicted score via bSDTNBI. 5‐HT1A and 5‐HT1D receptors might be involved in various cancers (Figure 4), including stomach adenocarcinoma, bladder carcinoma, lung adenocarcinoma and lung squamous cell carcinoma. A recent study suggested that all four serotonin receptors exhibit differential expression patterns in breast cancer specimens, and a strong staining for HTR1A was observed on the membrane of cancer cells (Kopparapu et al., 2013). In addition, pharmacological studies showed that clomipramine significantly induced the expression of 5‐HT1A receptors in mice (Kim et al., 2013). Such experimental evidence was in good agreement with our prediction. Collectively, targeting serotonin receptors (e.g.5‐HT1A receptors) by tricyclic anti‐depressant agents might be a potential MoA for their anticancer effect. Further experimental studies would be necessary to validate our prediction, which we hope that the anticancer study will be prompted by the findings herein.
Moreover, recent studies suggested that targeting cancer cell metabolism pathways might provide a novel targeted cancer therapy via regulating tumour cell nutrients and energy profiles (Zhao et al., 2015; Kim et al., 2016). For instance, metformin, the most commonly prescribed drug for type 2 diabetes, was identified as a promising agent for cancer prevention and treatment in various cancer types (Quinn et al., 2013). Therefore, we computationally investigated new MoA for several anti‐diabetic drugs (e.g. dapagliflozin, pioglitazone and rosiglitazone) by targeting cancer‐associated gene products, such as CA1, PPARG, RARB and RXRA (Figure 4). Consistent with our prediction, recent preclinical studies demonstrated that dapagliflozin (Saito et al., 2015), pioglitazone (Mahmoud and El Shazly, 2013) and rosiglitazone (Tikoo et al., 2009) could provide potential targeted therapies in various cancer types, such as hepatocellular carcinoma, colon cancer and renal adenocarcinoma. Put together, bSDTNBI would provide a useful tool to identify new indications for old drugs for the development of potential targeted therapies in cancer.
Identifying novel ligands for oestrogen receptor α
ERs are members of the nuclear receptor superfamily. Previous studies have suggested that ERs serve as potential targets for various complex diseases, such as cancer (e.g. breast cancer), osteoporosis, neurodegenerative diseases, cardiovascular disease and obesity (Deroo and Korach, 2006; Nilsson et al., 2011). To examine the application of bSDTNBI for identifying new drug targets or lead compounds for drug discovery and development, we showed how to identify novel ligands targeting ERα. Before bSDTNBI prediction, 6116 unique compounds were identified via chemical similarity search as described in Methods our previous study (Shen et al., 2012). Then, 56 commercially available compounds computationally identified by bSDTNBI were purchased for bioassays. Among these compounds, 27 of them showed potential activity on ERα with EC50 or IC50 ≤ 10 μM (Table 4 and Table S2). The experimental results suggested approximate 50% success rate through combining bSDTNBI and chemical similarity search in predicting targets for novel compounds. Among 27 potential hits, 18 compounds showed micromolar and sub‐micromolar antagonistic activities to ERα (Table 4). Two highly antagonistic compounds, Z25219066 and Z19674832 (Table 4 and Table S2), with IC50 of 0.37 μM and 0.2 μM, respectively, would provide potential lead compounds for the development of targeted breast cancer therapy by inhibiting ERα. In addition, among 27 potential hits, five compounds only showed micromolar and sub‐micromolar agonistic activities to ERα. For example, Z25218942 and Z25218345 showed EC50 value of 0.89 μM and 0.74 μM, respectively, providing potential lead compounds for treatment of osteoporosis by activating ERα.
Table 4.
The in vitro bioassay results for newly predicted ligands with EC50 or IC50 ≤ 10 μM on ERα
| Compound ID | Rank | EC50 (μM) | IC50 (μM) | Compound ID | Rank | EC50 (μM) | IC50 (μM) |
|---|---|---|---|---|---|---|---|
| Z92457891 | 1 | 0.33 | 1.07 | Z56802474 | 3 | 1.35 | NA |
| Z25218907 | 1 | NA | 8.51 | Z55027883 | 3 | NA | 1.03 |
| Z25218929 | 1 | NA | 1.28 | Z46032399 | 4 | NA | 1.11 |
| Z25219066 | 1 | NA | 0.37 | Z46628474 | 4 | NA | 3.68 |
| Z54109200 | 1 | NA | 6.17 | Z19674177 | 4 | NA | 3.71 |
| Z46032404 | 1 | NA | 0.58 | Z19675184 | 4 | NA | 0.8 |
| Z25218942 | 1 | 0.89 | NA | Z286056758 | 4 | NA | 4.25 |
| Z991569394 | 1 | 0.97 | 0.2 | Z19674828 | 5 | NA | 1.32 |
| Z56868143 | 1 | 6.16 | NA | Z19674832 | 5 | NA | 0.2 |
| Z46032353 | 2 | NA | 8.22 | Z46628031 | 5 | NA | 2.99 |
| Z25218345 | 2 | 0.74 | NA | Z19674818 | 6 | 0.79 | 0.26 |
| Z25219162 | 2 | 1.83 | NA | Z19697324 | 13 | NA | 2.05 |
| Z95162908 | 2 | NA | 7.08 | Z19697748 | 20 | NA | 0.96 |
| Z56797264 | 3 | 0.99 | 3.8 | – | – | – | – |
| E2a | – | 0.00024 | NA | Tamoxifena | – | NA | 3.34 |
The compound identifiers are from the Enamine database. Rank is the position of ERα in the predicted target list for the corresponding compound. NA means non‐activity or EC50 or IC50 > 10 μM on ERα.
Two control compounds (E2 and Tamoxifen).
In natural biological systems, the same ligand may be an antagonist in some tissues while an agonist in other tissues, which was called a dual‐effect ligand (Kansra et al., 2005). For example, tamoxifen, an ER antagonist in breast, was approved for breast cancer treatment, but as ER agonist in bone, thereby preventing osteoporosis potentially (Shang and Brown, 2002; Kansra et al., 2005). Interestingly, among 27 hits with EC50 or IC50 ≤ 10 μM, four compounds were revealed as having both antagonistic and agonistic activities on ERα (Table 4 and Table S2). For example, two compounds, Z991569394 and Z19674818, computationally identified by bSDTNBI, were experimentally verified as dual‐effect molecules on ERα with EC50 or IC50 value less than 1 μM. On the one hand, Z991569394 and Z19674818 were revealed to have the potential agonistic activities on ERα with EC50 value of 0.97 and 0.79 μM respectively. On the other hand, these two compounds further showed a higher antagonistic activity on ERα with IC50 value of 0.20 and 0.26 μM respectively. These results suggested that Z991569394 and Z19674818 could serve as potential lead compounds for the development of targeted therapy in breast cancer or osteoporosis via dually targeting ERα. Altogether, we demonstrated that bSDTNBI showed potential application for identifying specific antagonistic or agonistic ERα ligands, or dual‐effect ERα ligands with both antagonistic and agonistic activities for drug discovery and development.
Development of toolkit
The newly developed bSDTNBI method and the previously published SDTNBI and NBI methods were all implemented in a toolkit named as NetInfer via C++ programming language. NetInfer provides a uniform platform, which allows users to apply operations such as prediction, cross validation or external validation to their in‐house networks. The format of input and output files of this toolkit have been described in our previous article (Wu et al., 2016). NetInfer runs fast and is light‐weight. It can predict potential targets for thousands of drugs in a few seconds, and have no reliance on extra matrix or linear algebra libraries. The binary program, benchmark sets and thousands of newly predicted DTIs are available upon request. In addition, the manuals of bSDTNBI in NetInfer were given in our website (http://lmmd.ecust.edu.cn/methods/bsdtnbi/).
Discussion
In this study, we developed an improved NBI method, named bSDTNBI, for systematic prediction of chemical MoA. bSDTNBI can be utilized in prediction of potential targets for old drugs, clinical failed drugs and new chemical entities. High performance was yielded in both 10‐fold and leave‐one‐out cross validations. We computationally explored new MoA of anticancer drugs (e.g. tricyclic anti‐depressant agents), and identified hundreds of existing drugs (e.g. anti‐diabetic drugs) for the development of potential targeted therapies on 15 cancer types/subtypes via bSDTNBI. Furthermore, 27 new potential ERα ligands were experimentally validated with EC50 or IC50 values less than 10 μM, with approximate 50% success rate for target identification to new chemical entities. Collectively, bSDTNBI would provide a powerful tool for identification of chemical MoA in drug discovery and development.
Advantages
As a network‐based method, bSDTNBI has several obvious advantages compared with others for DTI prediction and drug repositioning, such as molecular docking‐based (Luo et al., 2011), and machine learning‐based methods (Yamanishi et al., 2008; Yamanishi et al., 2010; Cheng et al., 2012a). bSDTNBI can cover more types of targets without known three‐dimensional protein structures. Although machine learning‐based models have been widely used to predict potential targets for old drugs and novel compounds, they have several limitations. Machine learning‐based models require both positive and negative samples as input. However, collection of high‐quality negative samples is always challenging due to lack of experimentally validated negative data. Generating negative samples with the principle of ‘one versus the rest’ may partly alleviate this problem (Cheng et al., 2012a), but the accuracy of models was often reduced due to the low quality of samples. In this study, bSDTNBI only utilizes positive DTI pairs and chemoinformatics information to predict potential targets for known drugs and new chemical entities, where negative samples are not needed.
Furthermore, bSDTNBI can predict potential target for old drugs, clinically failed drugs and new chemical entities with a higher accuracy compared with our previous method, SDTNBI (Wu et al., 2016). The higher performance was yielded via adjusting three important issues in the original SDTNBI. Specifically, for bSDTNBI, three key parameters were used to adjust the initial resource allocation of different node types, the weighted values of different edge types and the influence of hub nodes respectively. Based on systematic evaluation, we found that bSDTNBI yielded the best performance when (i) more amount of initial resource was allocated to target nodes than that of substructure nodes; (ii) bigger weighted values were set for DTIs than that of drug‐substructure associations; and (iii) the influence of hub nodes were properly weakened. Under the optimal condition, bSDTNBI yielded higher performance in both 10‐fold and leave‐one‐out cross validations in comparison to SDTNBI across four types of fingerprints evaluated here.
Meanwhile, we found that KR fingerprint always outperform other types of fingerprints in bSDTNBI. As shown in Table S1, the drug‐substructure networks generated by KR fingerprint had lower sparisity. This suggests that the KR fingerprint could generate more specific chemical substructures to differentiate molecules with different bioactivities. The finding was similar to those we found in our previous studies (Cheng et al., 2012b; Wu et al., 2016).
Limitations
Several possible limitations still exist in bSDTNBI. For example, bSDTNBI could not predict potential DTIs for those novel target proteins that are absent from the known substructure‐drug‐target network. Moreover, the interaction types and binding affinities of DTIs have not been considered yet. We are actively developing new methods to solve this limitation. For example, we may predict potential DTIs for those novel target proteins by integrating a human protein–protein interaction network (Cheng et al., 2014). Nonetheless, bSDTNBI would provide a powerful tool for identifying the MoA for known drugs and novel compounds during drug discovery and development.
Author contributions
Y.T. and F.C. conceived and directed the project. F.C., Z.W., J.H. and Y.T. designed the study. Z.W., F.C., W.L., D.W., A.L, H.B. and J.L. collected the materials and carried out the experiments. Z.W., F.C., W.L. and G.L., analysed the data. F.C., Z.W., J.H. and Y.T. interpreted the results and wrote the manuscript.
Conflict of interest
The authors declare no conflicts of interest.
Declaration of transparency and scientific rigour
This Declaration acknowledges that this paper adheres to the principles for transparent reporting and scientific rigour of preclinical research recommended by funding agencies, publishers and other organisations engaged with supporting research.
Supporting information
Figure S1 The relationship among two parameters α, β, and the average AUC value for the models of GPCRs in 10‐fold cross validation.
Figure S2 The relationship among two parameters α, β, and the average AUC value for the models of kinases in 10‐fold cross validation.
Table S1 The statistics of drug‐substructure networks.
Table S2 The in vitro bioassay results of newly predicted ligands for oestrogen receptor α.
Supporting info item
Acknowledgments
This work was supported by the National Natural Science Foundation of China (grants 81373328, 81573020 and 81673356), the National Key Research and Development Program (grant 2016YFA0502304) and the 111 Project (grant B07023).
Wu, Z. , Lu, W. , Wu, D. , Luo, A. , Bian, H. , Li, J. , Li, W. , Liu, G. , Huang, J. , Cheng, F. , and Tang, Y. (2016) In silico prediction of chemical mechanism of action via an improved network‐based inference method. British Journal of Pharmacology, 173: 3372–3385. doi: 10.1111/bph.13629.
Contributor Information
Jin Huang, Email: huangjin@ecust.edu.cn.
Feixiong Cheng, Email: fxcheng1985@gmail.com.
Yun Tang, Email: ytang234@ecust.edu.cn.
References
- Adams CP, Brantner VV (2006). Estimating the cost of new drug development: is it really $802 million? Health Aff 25: 420–428. [DOI] [PubMed] [Google Scholar]
- Alaimo S, Pulvirenti A, Giugno R, Ferro A (2013). Drug‐target interaction prediction through domain‐tuned network‐based inference. Bioinformatics 29: 2004–2008. [DOI] [PMC free article] [PubMed] [Google Scholar]
- Alexander SPH, Cidlowski JA, Kelly E, Marrion N, Peters JA, Benson HE et al. (2015a). The concise guide to PHARMACOLOGY 2015/16: Nuclear hormone receptors. Br J Pharmacol 172: 5956–5978. [DOI] [PMC free article] [PubMed] [Google Scholar]
- Alexander SPH, Davenport AP, Kelly E, Marrion N, Peters JA, Benson HE et al. (2015b). The concise guide to PHARMACOLOGY 2015/16: G protein‐coupled receptors. Br J Pharmacol 172: 5744–5869. [DOI] [PMC free article] [PubMed] [Google Scholar]
- Alexander SPH, Fabbro D, Kelly E, Marrion N, Peters JA, Benson HE et al. (2015c). The concise guide to PHARMACOLOGY 2015/16: Enzymes. Br J Pharmacol 172: 6024–6109. [DOI] [PMC free article] [PubMed] [Google Scholar]
- Apweiler R, Bairoch A, Wu CH, Barker WC, Boeckmann B, Ferro S et al. (2004). UniProt: the Universal Protein knowledgebase. Nucleic Acids Res 32: D115–D119. [DOI] [PMC free article] [PubMed] [Google Scholar]
- Arrowsmith J (2011a). Phase II failures: 2008–2010. Nat Rev Drug Discov 10: 328–328. [DOI] [PubMed] [Google Scholar]
- Arrowsmith J (2011b). Trial watch phase III and submission failures: 2007–2010. Nat Rev Drug Discov 10: 87–87. [DOI] [PubMed] [Google Scholar]
- Campillos M, Kuhn M, Gavin AC, Jensen LJ, Bork P (2008). Drug target identification using side‐effect similarity. Science 321: 263–266. [DOI] [PubMed] [Google Scholar]
- Chen L, Wu D, Bian HP, Kuang GL, Jiang J, Li WH et al. (2014). Selective ligands of estrogen receptor beta discovered using pharmacophore mapping and structure‐based virtual screening. Acta Pharmacol Sin 35: 1333–1341. [DOI] [PMC free article] [PubMed] [Google Scholar]
- Chen X, Liu MX, Yan GY (2012). Drug‐target interaction prediction by random walk on the heterogeneous network. Mol Biosyst 8: 1970–1978. [DOI] [PubMed] [Google Scholar]
- Cheng FX, Zhou YD, Li J, Li WH, Liu GX, Tang Y (2012a). Prediction of chemical‐protein interactions: multitarget‐QSAR versus computational chemogenomic methods. Mol Biosyst 8: 2373–2384. [DOI] [PubMed] [Google Scholar]
- Cheng FX, Zhou YD, Li WH, Liu GX, Tang Y (2012c). Prediction of chemical‐protein interactions network with weighted network‐based inference method. PLoS One 7: e41064. [DOI] [PMC free article] [PubMed] [Google Scholar]
- Cheng FX, Hong HX, Yang SY, Wei YQ (2016a). Individualized network‐based drug repositioning infrastructure for precision oncology in the panomics era. Brief Bioinform. doi:10.1093/bib/bbw051. [DOI] [PubMed] [Google Scholar]
- Cheng FX, Ikenaga Y, Zhou YD, Yu Y, Li WH, Shen J et al. (2012b). In silico assessment of chemical biodegradability. J Chem Inf Model 52: 655–669. [DOI] [PubMed] [Google Scholar]
- Cheng FX, Jia PL, Wang Q, Zhao ZM (2014). Quantitative network mapping of the human kinome interactome reveals new clues for rational kinase inhibitor discovery and individualized cancer therapy. Oncotarget 5: 3697–3710. [DOI] [PMC free article] [PubMed] [Google Scholar]
- Cheng FX, Li WH, Wu ZR, Wang XC, Zhang C, Li J et al. (2013). Prediction of polypharmacological profiles of drugs by the integration of chemical, side effect, and therapeutic space. J Chem Inf Model 53: 753–762. [DOI] [PubMed] [Google Scholar]
- Cheng FX, Liu C, Jiang J, Lu WQ, Li WH, Liu GX et al. (2012d). Prediction of drug‐target interactions and drug repositioning via network‐based inference. PLoS Comp Biol 8: e1002503. [DOI] [PMC free article] [PubMed] [Google Scholar]
- Cheng FX, Xu ZJ, Liu GX, Tang Y (2010). Insights into binding modes of adenosine A(2B) antagonists with ligand‐based and receptor‐based methods. Eur J Med Chem 45: 3459–3471. [DOI] [PubMed] [Google Scholar]
- Cheng FX, Zhao JF, Fooksa M, Zhao ZM (2016b). A network‐based drug repositioning infrastructure for precision cancer medicine through targeting significantly mutated genes in the human cancer genomes. J Am Med Inform Assoc 23: 681–691. [DOI] [PMC free article] [PubMed] [Google Scholar]
- Davis AP, Murphy CG, Saraceni‐Richards CA, Rosenstein MC, Wiegers TC, Mattingly CJ (2009). Comparative toxicogenomics database: a knowledgebase and discovery tool for chemical‐gene‐disease networks. Nucleic Acids Res 37: D786–D792. [DOI] [PMC free article] [PubMed] [Google Scholar]
- Deroo BJ, Korach KS (2006). Estrogen receptors and human disease. J Clin Invest 116: 561–570. [DOI] [PMC free article] [PubMed] [Google Scholar]
- DiMasi JA, Hansen RW, Grabowski HG (2003). The price of innovation: new estimates of drug development costs. J Health Econ 22: 151–185. [DOI] [PubMed] [Google Scholar]
- Gaulton A, Bellis LJ, Bento AP, Chambers J, Davies M, Hersey A et al. (2012). ChEMBL: a large‐scale bioactivity database for drug discovery. Nucleic Acids Res 40: D1100–D1107. [DOI] [PMC free article] [PubMed] [Google Scholar]
- Hamosh A, Scott AF, Amberger JS, Bocchini CA, McKusick VA (2005). Online Mendelian Inheritance in Man (OMIM), a knowledgebase of human genes and genetic disorders. Nucleic Acids Res 33: D514–D517. [DOI] [PMC free article] [PubMed] [Google Scholar]
- Hay M, Thomas DW, Craighead JL, Economides C, Rosenthal J (2014). Clinical development success rates for investigational drugs. Nat Biotechnol 32: 40–51. [DOI] [PubMed] [Google Scholar]
- Hewett M, Oliver DE, Rubin DL, Easton KL, Stuart JM, Altman RB et al. (2002). PharmGKB: the pharmacogenetics knowledge base. Nucleic Acids Res 30: 163–165. [DOI] [PMC free article] [PubMed] [Google Scholar]
- Hopkins AL (2008). Network pharmacology: the next paradigm in drug discovery. Nat Chem Biol 4: 682–690. [DOI] [PubMed] [Google Scholar]
- Hu GP, Kuang GL, Xiao W, Li WH, Liu GX, Tang Y (2012). Performance evaluation of 2D fingerprint and 3D shape similarity methods in virtual screening. J Chem Inf Model 52: 1103–1113. [DOI] [PubMed] [Google Scholar]
- Jacobson KA, Costanzi S, Paolettal S (2014). Computational studies to predict or explain G protein coupled receptor polypharmacology. Trends Pharmacol Sci 35: 658–663. [DOI] [PMC free article] [PubMed] [Google Scholar]
- Jahchan NS, Dudley JT, Mazur PK, Flores N, Yang D, Palmerton A et al. (2013). A drug repositioning approach identifies tricyclic antidepressants as inhibitors of small cell lung cancer and other neuroendocrine tumors. Cancer Discov 3: 1364–1377. [DOI] [PMC free article] [PubMed] [Google Scholar]
- Kansra S, Yamagata S, Sneade L, Foster L, Ben‐Jonathan N (2005). Differential effects of estrogen receptor antagonists on pituitary lactotroph proliferation and prolactin release. Mol Cell Endocrinol 239: 27–36. [DOI] [PubMed] [Google Scholar]
- Kawamura Y, Ogawa Y, Nishimura T, Kikuchi Y, Nishikawa J, Nishihara T et al. (2003). Estrogenic activities of UV stabilizers used in food contact plastics and benzophenone derivatives tested by the yeast two‐hybrid assay. J Health Sci 49: 205–212. [Google Scholar]
- Keiser MJ, Setola V, Irwin JJ, Laggner C, Abbas AI, Hufeisen SJ et al. (2009). Predicting new molecular targets for known drugs. Nature 462: 175–U148. [DOI] [PMC free article] [PubMed] [Google Scholar]
- Kim JW, Ahn HS, Baik JH, Yoon BJ (2013). Administration of clomipramine to neonatal mice alters stress response behavior and serotonergic gene expressions in adult mice. J Psychopharmacol 27: 171–180. [DOI] [PubMed] [Google Scholar]
- Kim P, Cheng FX, Zhao JF, Zhao ZM (2016). ccmGDB: a database for cancer cell metabolism genes. Nucleic Acids Res 44: D959–D968. [DOI] [PMC free article] [PubMed] [Google Scholar]
- Knight ZA, Lin H, Shokat KM (2010). Targeting the cancer kinome through polypharmacology. Nat Rev Cancer 10: 130–137. [DOI] [PMC free article] [PubMed] [Google Scholar]
- Kopparapu PK, Tinzl M, Anagnostaki L, Persson JL, Dizeyi N (2013). Expression and localization of serotonin receptors in human breast cancer. Anticancer Res 33: 363–370. [PubMed] [Google Scholar]
- Law V, Knox C, Djoumbou Y, Jewison T, Guo AC, Liu YF et al. (2014). DrugBank 4.0: shedding new light on drug metabolism. Nucleic Acids Res 42: D1091–D1097. [DOI] [PMC free article] [PubMed] [Google Scholar]
- Li J, Lei KC, Wu ZR, Li WH, Liu GX, Liu JW et al. (2016). Network‐based identification of microRNAs as potential pharmacogenomic biomarkers for anticancer drugs. Oncotarget . doi:10.18632/oncotarget.10052. [DOI] [PMC free article] [PubMed] [Google Scholar]
- Liu TQ, Lin YM, Wen X, Jorissen RN, Gilson MK (2007). BindingDB: a web‐accessible database of experimentally determined protein‐ligand binding affinities. Nucleic Acids Res 35: D198–D201. [DOI] [PMC free article] [PubMed] [Google Scholar]
- Lü LY, Medo M, Yeung CH, Zhang YC, Zhang ZK, Zhou T (2012). Recommender systems. Phys Rep‐Rev Sec Phys Lett 519: 1–49. [Google Scholar]
- Lu WQ, Cheng FX, Jiang J, Zhang C, Deng XK, Xu ZY et al. (2015). FXR antagonism of NSAIDs contributes to drug‐induced liver injury identified by systems pharmacology approach. Sci Rep 5: 8114. [DOI] [PMC free article] [PubMed] [Google Scholar]
- Lucas X, Gruning BA, Bleher S, Gunther S (2015). The purchasable chemical space: a detailed picture. J Chem Inf Model 55: 915–924. [DOI] [PubMed] [Google Scholar]
- Luo H, Chen J, Shi LM, Mikailov M, Zhu H, Wang KJ et al. (2011). DRAR‐CPI: a server for identifying drug repositioning potential and adverse drug reactions via the chemical‐protein interactome. Nucleic Acids Res 39: W492–W498. [DOI] [PMC free article] [PubMed] [Google Scholar]
- Mahmoud MF, El Shazly SM (2013). Pioglitazone protects against cisplatin induced nephrotoxicity in rats and potentiates its anticancer activity against human renal adenocarcinoma cell lines. Food Chem Toxicol 51: 114–122. [DOI] [PubMed] [Google Scholar]
- Nilsson S, Koehler KF, Gustafsson JA (2011). Development of subtype‐selective oestrogen receptor‐based therapeutics. Nat Rev Drug Discov 10: 778–792. [DOI] [PubMed] [Google Scholar]
- Nishihara T, Nishikawa J, Kanayama T, Dakeyama F, Saito K, Imagawa M et al. (2000). Estrogenic activities of 517 chemicals by yeast two‐hybrid assay. J Health Sci 46: 282–298. [Google Scholar]
- O'Boyle NM, Banck M, James CA, Morley C, Vandermeersch T, Hutchison GR (2011). Open babel: an open chemical toolbox. J Cheminform 3: 14. [DOI] [PMC free article] [PubMed] [Google Scholar]
- Pawson AJ, Sharman JL, Benson HE, Faccenda E, Alexander SPH, Buneman OP et al. (2014). The IUPHAR/BPS guide to PHARMACOLOGY: an expert‐driven knowledgebase of drug targets and their ligands. Nucleic Acids Res 42: D1098–D1106. [DOI] [PMC free article] [PubMed] [Google Scholar]
- Quinn BJ, Kitagawa H, Memmott RM, Gills JJ, Dennis PA (2013). Repositioning metformin for cancer prevention and treatment. Trends Endocrinol Metab 24: 469–480. [DOI] [PubMed] [Google Scholar]
- Roth BL, Lopez E, Patel S, Kroeze WK (2000). The multiplicity of serotonin receptors: uselessly diverse molecules or an embarrassment of riches? Neuroscientist 6: 252–262. [Google Scholar]
- Roth BL, Sheffler DJ, Kroeze WK (2004). Magic shotguns versus magic bullets: selectively non‐selective drugs for mood disorders and schizophrenia. Nat Rev Drug Discov 3: 353–359. [DOI] [PubMed] [Google Scholar]
- Saito T, Okada S, Yamada E, Shimoda Y, Osaki A, Tagaya Y et al. (2015). Effect of dapagliflozin on colon cancer cell. Endocr J 62: 1133–1137. [DOI] [PubMed] [Google Scholar]
- Shang YF, Brown M (2002). Molecular determinants for the tissue specificity of SERMs. Science 295: 2465–2468. [DOI] [PubMed] [Google Scholar]
- Shannon P, Markiel A, Ozier O, Baliga NS, Wang JT, Ramage D et al. (2003). Cytoscape: a software environment for integrated models of biomolecular interaction networks. Genome Res 13: 2498–2504. [DOI] [PMC free article] [PubMed] [Google Scholar]
- Shchors K, Massaras A, Hanahan D (2015). Dual targeting of the autophagic regulatory circuitry in gliomas with repurposed drugs elicits cell‐lethal autophagy and therapeutic benefit. Cancer Cell 28: 456–471. [DOI] [PubMed] [Google Scholar]
- Shen J, Jiang J, Kuang GL, Tan CF, Liu GX, Huang J et al. (2012). Discovery and structure‐activity analysis of selective estrogen receptor modulators via similarity‐based virtual screening. Eur J Med Chem 54: 188–196. [DOI] [PubMed] [Google Scholar]
- Shen J, Tan CF, Zhang YY, Li X, Li WH, Huang J et al. (2010). Discovery of potent ligands for estrogen receptor beta by structure‐based virtual screening. J Med Chem 53: 5361–5365. [DOI] [PubMed] [Google Scholar]
- Southan C, Sharman JL, Benson HE, Faccenda E, Pawson AJ, Alexander SPH et al. (2016). The IUPHAR/BPS guide to PHARMACOLOGY in 2016: towards curated quantitative interactions between 1300 protein targets and 6000 ligands. Nucleic Acids Res 44: D1054–D1068. [DOI] [PMC free article] [PubMed] [Google Scholar]
- Tikoo K, Kumar P, Gupta J (2009). Rosiglitazone synergizes anticancer activity of cisplatin and reduces its nephrotoxicity in 7, 12‐dimethyl benz{a}anthracene (DMBA) induced breast cancer rats. BMC Cancer 9: 12. [DOI] [PMC free article] [PubMed] [Google Scholar]
- Woo JH, Shimoni Y, Yang WS, Subramaniam P, Iyer A, Nicoletti P et al. (2015). Elucidating compound mechanism of action by network perturbation analysis. Cell 162: 441–451. [DOI] [PMC free article] [PubMed] [Google Scholar]
- Wu ZR, Cheng FX, Li J, Li WH, Liu GX, Tang Y (2016). SDTNBI: an integrated network and chemoinformatics tool for systematic prediction of drug–target interactions and drug repositioning. Brief Bioinform . doi:10.1093/bib/bbw012. [DOI] [PubMed] [Google Scholar]
- Xu ZJ, Cheng FX, Da CX, Liu GX, Tang Y (2010). Pharmacophore modeling of human adenosine receptor A(2A) antagonists. J Mol Model 16: 1867–1876. [DOI] [PubMed] [Google Scholar]
- Yamanishi Y, Araki M, Gutteridge A, Honda W, Kanehisa M (2008). Prediction of drug‐target interaction networks from the integration of chemical and genomic spaces. Bioinformatics 24: I232–I240. [DOI] [PMC free article] [PubMed] [Google Scholar]
- Yamanishi Y, Kotera M, Kanehisa M, Goto S (2010). Drug‐target interaction prediction from chemical, genomic and pharmacological data in an integrated framework. Bioinformatics 26: i246–i254. [DOI] [PMC free article] [PubMed] [Google Scholar]
- Yap CW (2011). PaDEL‐Descriptor: an open source software to calculate molecular descriptors and fingerprints. J Comput Chem 32: 1466–1474. [DOI] [PubMed] [Google Scholar]
- Yildirim MA, Goh KI, Cusick ME, Barabasi AL, Vidal M (2007). Drug‐target network. Nat Biotechnol 25: 1119–1126. [DOI] [PubMed] [Google Scholar]
- Yu W, Gwinn M, Clyne M, Yesupriya A, Khoury MJ (2008). A navigator for human genome epidemiology. Nat Genet 40: 124–125. [DOI] [PubMed] [Google Scholar]
- Zhang C, Hong HX, Mendrick DL, Tang Y, Cheng FX (2015). Biomarker‐based drug safety assessment in the age of systems pharmacology: from foundational to regulatory science. Biomark Med 9: 1241–1252. [DOI] [PubMed] [Google Scholar]
- Zhao YZ, Hu QX, Cheng FX, Su N, Wang AX, Zou YJ et al. (2015). SoNar, a highly responsive NAD(+)/NADH sensor, allows high‐throughput metabolic screening of anti‐tumor agents. Cell Metab 21: 777–789. [DOI] [PMC free article] [PubMed] [Google Scholar]
Associated Data
This section collects any data citations, data availability statements, or supplementary materials included in this article.
Supplementary Materials
Figure S1 The relationship among two parameters α, β, and the average AUC value for the models of GPCRs in 10‐fold cross validation.
Figure S2 The relationship among two parameters α, β, and the average AUC value for the models of kinases in 10‐fold cross validation.
Table S1 The statistics of drug‐substructure networks.
Table S2 The in vitro bioassay results of newly predicted ligands for oestrogen receptor α.
Supporting info item