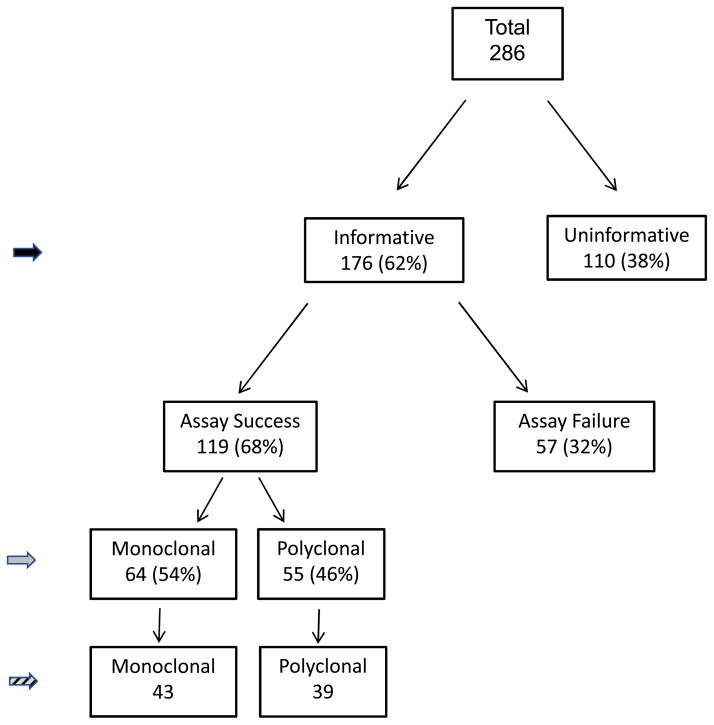
Figure 2.
Flow diagram of PHPT patients studied. Solid grey arrowhead indicates patients examined to determine the prevalence of monoclonal and polyclonal tumors in the study cohort and the clinical and biochemical features of patients with monoclonal and polyclonal tumors (summarized in table 1). Hatched arrowhead indicates patients examined to determine surgical and pathologic results in patients with monoclonal and polyclonal tumors (summarized in table 2).

