

Abstract
Objective. To define quality and associated metrics related to Doctor of Pharmacy degree programs.
Methods. A three round Delphi process and online survey tool were employed to constitute and query an expert panel of randomly selected pharmacy deans representing a proportional share of public and private schools. Participants were asked about measures used to evaluate the quality of their schools; agreement was assessed for each quality category and metric identified; rankings were reported in order of importance.
Results. Deans from 15 public pharmacy schools and 17 private pharmacy schools agreed to participate. Nine quality categories and 35 specific quality metrics were identified. Both public and private school leaders identified and agreed on nine categories of quality measures, with “placement” ranked as the most important measurement category.
Conclusion. Identifying categories and metrics to assess quality may provide a foundation from which to compare quality across institutions.
Keywords: education quality, benchmarking, pharmacy school
INTRODUCTION
Over the past three decades, expansion of the market for institutions educating future pharmacists has been well-documented.1-4 Large expansions in pharmacy education after 2005 involving increased class sizes within existing schools combined with an unprecedented growth of new schools has more than doubled the number of graduating pharmacists produced in the United States.1,5 Since the aforementioned expansion, some have questioned the overall caliber of education as well as the availability of qualified practice faculty members.3 This growth in pharmacy education notably altered the landscape of Doctor of Pharmacy (PharmD) degree programs, as in many cases the attributes of new schools are substantially different when compared to older more established institutions.4 Knapp and Knapp found that during the expansion of new schools between 1996 and 2007, new pharmacy schools were more likely to be private institutions and less likely to be associated with academic health centers or have PhD enrollees.4
Bosso and colleagues suggested benchmarking as a means for academic pharmacy departments to measure quality and identify opportunities for improvement, but they explained that benchmarking is most successful when an accepted standard is available.6 Maine and Vlasses evaluated mean first-time licensure pass rates and graduate, faculty, and preceptor survey results from 2004 to 2010 and concluded that school expansion did not reduce education quality.7 Currently, no definition or consensus exists to measure and assess pharmacy school quality. While a wide variety of subjective and objective data points exist to measure various outcomes such as licensure scores, grant funding, or peer rankings produced by the US News and World Report (USNWR), the validity and/or usefulness of these measures is unknown. This study utilizes a Delphi technique to ascertain consensus from a group of pharmacy school deans in order to determine potential measures of pharmacy school quality.
METHODS
A Delphi process consisting of three rounds and an online survey tool was conducted. Delphi methods were originally developed by the RAND Corporation in the 1950s to build consensus from a group of experts through a series of questionnaires.8-10 Expert panelists representing current leaders in pharmacy schools were queried regarding the measures they use to evaluate the quality of their school. This expert panel approach was taken to increase content validity.9 Anonymity of the panelists was maintained throughout all rounds in order to reduce the effects of dominant individuals in the group-based processes.10
In this study, deans of fully accredited colleges or schools of pharmacy in 2015 were identified using the American Association of Colleges of Pharmacy (AACP) Pharmacy College Application Service (PharmCAS). To achieve a fair representation of both public (48%) and private (52%) institutions, respondents were separated into two groups (ie, public and private institutions) and were then randomly selected from each group until 14 public and 16 private school representatives agreed to participate for a total panel of 30. Delphi panels typically include fewer than 50 panelists with the majority of studies having 15-20 participants.10 A panel size of 30 was targeted to include a representative pool of public and private institutions. Invitations were sent via personal email communication. Invited panelists were allowed one week to respond before the process moved to the next random subject. This study was reviewed by the University of Maryland, Baltimore Institutional Review Board and considered exempt.
In the first round, panelists were provided with an open-response template survey asking to provide their opinions regarding appropriate measures of quality for PharmD programs. Background and demographic information was also collected during the first round including years in academia, years as dean, and terminal degree. These open-ended questions provided the panelists freedom of response in order to help identify all potential items related to quality. After receiving first round survey responses, two research team members independently categorized each item and disagreements were discussed with the full research team. Similar measurements identified in the responses were then grouped and all non-identical statements were included within each category for the second round questionnaire.11
In the second round, panelists were provided with the categories of quality measures from responses in round 1 and the specific statements in each category.11 Construct validity was ensured by replicating previously described techniques.9,11,12 Initially, panelists were asked to rate their level of agreement using a 4-point Likert scale (1-strongly disagree, 2-disagree, 3-agree, 4-strongly agree) with each category generated from the first round. Participants were also asked to comment on any areas of disagreement with the categories as appropriate measures of pharmacy school quality. Consensus level was defined a priori as a minimum of 75% of respondents agreeing or strongly agreeing with a given category. While there are no specific requirements defining consensus in a Delphi, study methods vary from 51% to 100% agreement to reach consensus.12 A consensus level of 75% was chosen for this study to ensure that an item receiving 100% agreement from one school type would still require agreement from nearly half of the panelists from the other school type.
Panelists were then asked to rate relative levels of agreement with each individual item as a measure of quality, focusing on whether or not the panel thought the item was appropriate to use. Second, the panelists were asked to rate their level of agreement that each measure of quality fits within each category assignment using the same 4-point Likert scale. A consensus level was determined a priori as a minimum of 75% respondents agreeing or strongly agreeing with each item and each item category assignment.
Results of the second round were provided to panelists at the beginning of the third round survey. In the third round, panelists were asked to rank each category that achieved consensus in the second round in terms of importance of that item as a measure of pharmacy school quality. Participants were also asked to rank individual measurements within each category on importance for measuring the particular category determined from round 2. Level of agreement with the ranking in round 3 was measured using Kendall’s coefficient of concordance.13 For categories with only one measurement, the option of “other” was provided to allow panelists to rank the measurement.13
RESULTS
Round 1
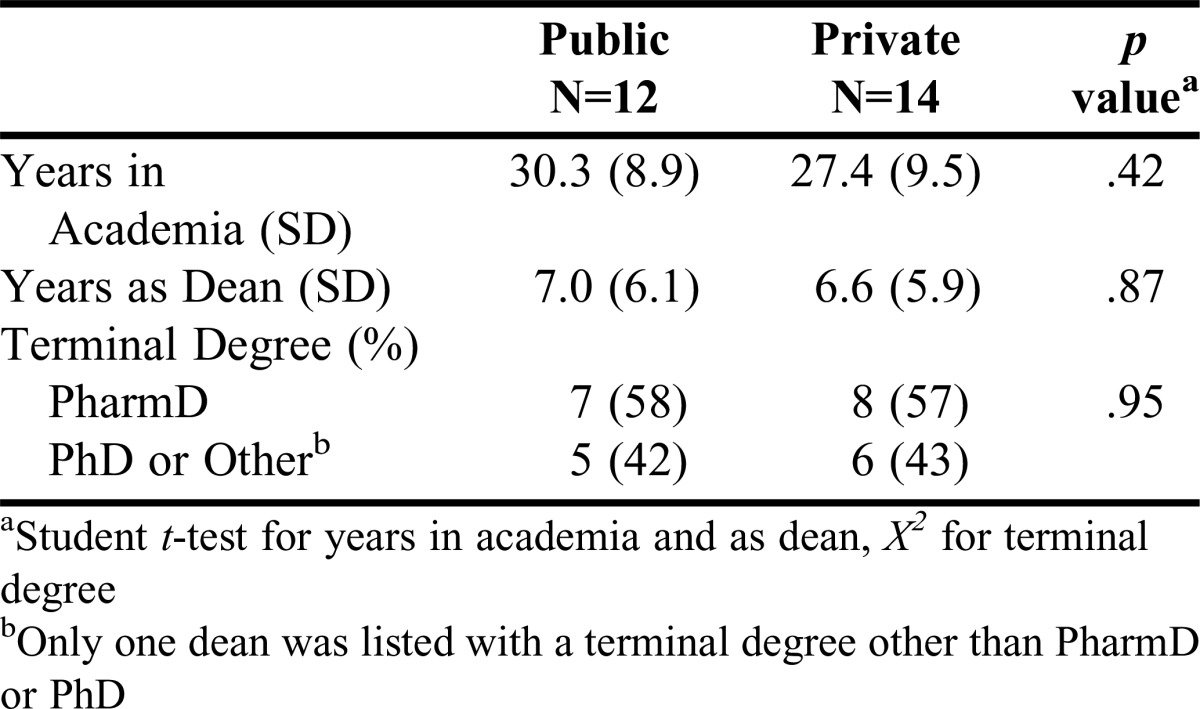
Following recruitment, deans from 15 public pharmacy schools and 17 private pharmacy schools initially agreed to serve on the panel. Three deans who agreed to participate were lost to follow-up, while six different deans did not participate in all rounds of the process. In round 1, responses were received from 12 (80%) and 14 (82%) deans of public and private schools, respectively. There were no statistically significant differences between public and private school deans in terms of either experience and/or terminal degree obtained (Table 1). The open responses contained 73 potential quality metrics for use in round 2, from which the study team identified nine separate categorical areas that were associated as measures of PharmD program quality (eg, operational, placement, recruitment, scholarship, service, stakeholder feedback, testing, student success, and curriculum).
Table 1.
Delphi Panel Characteristics by Public and Private School
Round 2
Round 2 sought agreement with the categories and individual metrics identified from the previous round. Responses were received from 13 (87%) public school deans and 14 (82%) private school deans. Based on this response rate, 21 of the 27 respondents were required to agree or strongly agree in order to achieve the 75% threshold that was determined a priori. The panel agreed with all nine categories (Table 2) and 35 (48%) of the 73 metrics that were mentioned in round 1. There were seven different metrics for operational, four for placement, three for recruitment, four for scholarship, three for service, seven for stakeholder feedback, two for testing, one for student success, and four for curriculum.
Table 2.
Categories of Quality Measures for PharmD Education and Panel Agreement

Round 3
The nine categories and 35 metrics identified in round 2 were sent to panelists for rankings and a response of 13 (87%) public school deans and 12 (71%) private school deans was obtained. Of the 25 responses, rankings were not completed by two deans resulting in a final sample of 12 (80%) public school and 11 (65%) private school deans. Panelists ranked both the categories and the individual metrics within each category (Tables 3 and 4). Weak agreement was reached in the order of categories, with placement as the most important category for quality. “Individual measures of testing” and “student success” reached the strongest levels of agreement (Table 4).
Table 3.
Category Rankings and Level of Concordance
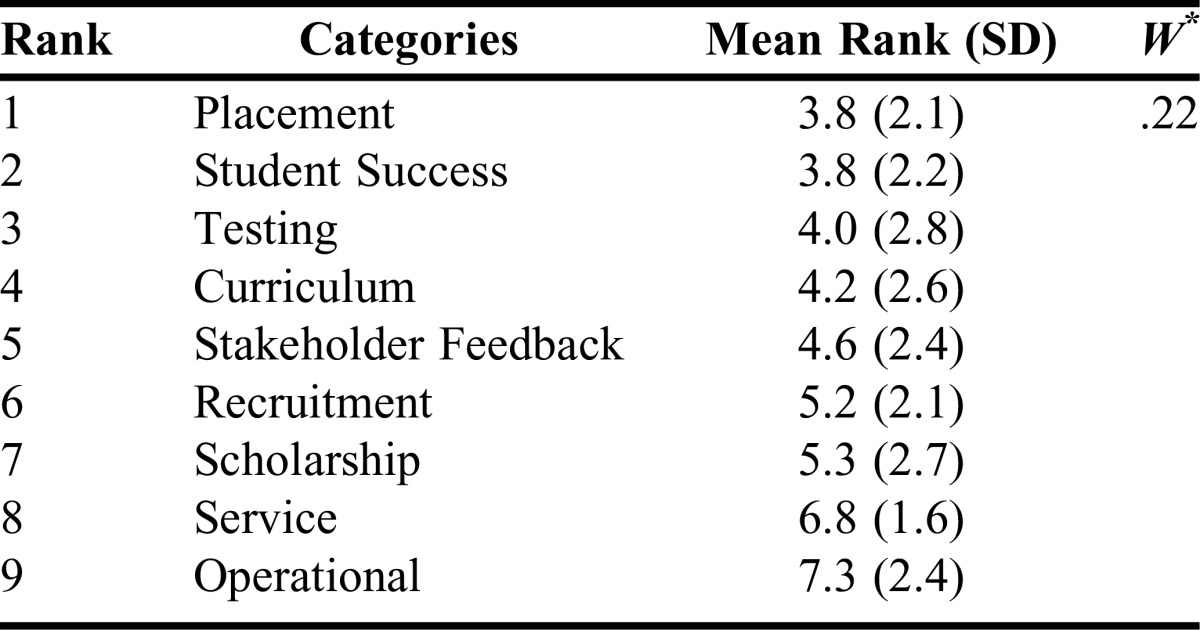
Table 4.
Ranking of Quality Metrics for Each Category with Level of Concordance

DISCUSSION
A simple search of the term “quality” in the American Journal of Pharmaceutical Education (AJPE) returns over 1,500 results. Broad use of the term may reflect stakeholders’ recognition that the word represents a construct the academy strives to achieve in all facets of pharmacy education. Additionally, educators recognize quality or quality improvement as an important theme across all standards by which pharmacy education is measured. The term “quality” is a component of the Accreditation Council for Pharmacy Education’s (ACPE) mission statement.14 Despite commonly referring to quality, the construct becomes much less clear when a common definition or paradigm is used or applied to colleges and schools of pharmacy.
In 2011, Ried proposed a model for curricular quality assessment and improvement built around the knowledge, skills, and attitudes necessary to create a competent practitioner.15 This model demonstrates how pharmacy schools can incorporate continuous quality improvement with a focus on achieving outcomes critical to the mission of the organization. Similar to Ried’s model, our study finds that deans utilize metrics such as licensure examination pass rates, preceptor evaluations, employer feedback, and peer evaluations to assess quality performance. However, we find that in addition to these measures, deans also value indirect (non-curricular) assessments such as faculty and student participation in scholarly activities.
Hall and colleagues implemented a continuous quality-improvement program by identifying five organizational goals or “pillars” to serve as the foundation from which they would measure success at a pharmacy school.16 The pillars (people, service, quality, growth, and financial) created a framework for the team to set 1-year goals and establish “key performance indicators” which could help measure college progress.16 Deans in our study agreed that student satisfaction and placement were important to assess quality, but our panel did not identify faculty satisfaction or faculty attrition as metrics. This may have been implied as 85% of our panel agreed that “recruitment” was an important category for quality; however, evaluating faculty satisfaction and turnover were never explicitly mentioned.
One area of controversy that is frequently discussed in association with the measuring or benchmarking of pharmacy schools involves the administrator survey and subsequent ranking conducted by USNWR.17,18 Our panel identified this instrument and its associated output as a measurement of quality in round 1, but it was eliminated during the next round with 22 (81%) deans dismissing the survey as a metric (13 of which, strongly disagreed). While a visit to any school of pharmacy recently voted into the top tier of this survey would likely reveal that the program uses that publication’s ranking as an indicator of quality, an overwhelming majority of our panel rejected this as a measure of quality for PharmD programs.
One significant finding from the Delphi process relates to the importance of employment placement of graduates and success of students in the program. These items were ranked first and second out of nine categories. With a focus on placement, one could reasonably extrapolate the incentive for existing schools to promote a supply/demand scenario that favors a pharmacist shortage in the workforce. However, a pharmacist shortage enabling a 100% placement rate would make it difficult to benchmark against other schools. If market conditions reduce the percentages of graduates who successfully gain employment, the metric would become more useful for measurement but harmful to new graduates with potentially sizable student debt levels.
In terms of student success, during the open response round our panelists identified several measures that related to attrition, grades, satisfaction, or stress observed by students in the program. However, the only metric that reached agreement for inclusion was related to student stress or satisfaction. Future research may be warranted to better define student success in a school of pharmacy and how it may be correlated to the quality of a PharmD program.
The demands and expectations for a dean may be notably different given the type of institution, particularly whether the school is publicly or privately owned.19 Knapp and Knapp evaluated the attributes of colleges and schools of pharmacy in terms of “old” and “new with grads” and determined that old schools were predominantly public with PhD enrollees while new schools were more likely to be private with few PhD students.4 Robles and colleagues determined that faculty at private institutions considered significantly fewer publications as acceptable for advancement compared with public school faculty.20 Understanding the variability of existing organizations, our study specifically recruited a ratio of deans representing both public and private institutions and set a high level of agreement to ensure that responses from one type of institution would not completely override the other. However, we did not stratify responses by institution type to reduce potential bias between rounds. Replicating the current study in separate public and private school expert panels could provide insight into perceived or real differences in the way school type influences quality measures.
Future research into quantitative methods to determine results for each of the categories and metrics identified by this expert panel would advance the usefulness of a quality construct for pharmacy education. While we recognize the importance of factors such as “student success” while enrolled in an individual program, assigning a quantitative score to compare across institutions may be extremely challenging. However, if pharmacy leaders can agree on a set of core quality measures, the Academy could make significant advances in determining how program performance is assessed.
Limitations
A central component of any Delphi technique involves the appropriate selection of experts.21,22 While deans of schools of pharmacy are undoubtedly responsible and accountable for leading pharmacy education, this may not necessarily engender this group as experts on the construct of quality. However, the research methods utilized here were a compromise between identifying experts on quality measures and the inclusion of stakeholders in leadership positions across both public and private institutions with the ability to comment on different quality metrics. We measured participant experience and other individual characteristics rather than the characteristics of the program represented. School-specific qualities among the panel could influence panelists’ perspectives which may be a future area of investigation.
Another source of bias within Delphi processes may be revealed between rounds as the research team aggregates and analyzes results to formulate an appropriate questionnaire for subsequent rounds. While this could not be completely eliminated, our strategy to mitigate investigator biases after the first round was to assign two research team members to independently categorize the open responses and then subsequently present these findings to the full 4-person research team for discussion. Additionally, consensus was determined a priori for round 2 and final round results were reported with all ranking agreement levels provided.
CONCLUSION
An expert panel including deans of both public and private schools of pharmacy identified and agreed on nine categories of quality measures for PharmD education, with “placement” ranked as the most important measurement category. The panel also identified specific metrics to assess each quality category providing a foundation for further investigation into measuring and comparing PharmD education quality across differing institutions.
REFERENCES
- 1.Brown DL. A looming joblessness crisis for new pharmacy graduates and the implications it holds for the academy. Am J Pharm Educ. 2013;77(5):Article 90. doi: 10.5688/ajpe77590. [DOI] [PMC free article] [PubMed] [Google Scholar]
- 2.Brown D. From shortage to surplus: the hazards of uncontrolled academic growth. Am J Pharm Educ. 2010;74(10):Article 185. doi: 10.5688/aj7410185. [DOI] [PMC free article] [PubMed] [Google Scholar]
- 3.DiPiro JT. Is the quality of pharmacy education keeping up with pharmacy school expansion? Am J Pharm Educ. 2003;67(2):Article 48. [Google Scholar]
- 4.Knapp DA, Knapp DE. Attributes of colleges and schools of pharmacy in the United States. Am J Pharm Educ. 2009;73(5):Article 96. doi: 10.5688/aj730596. [DOI] [PMC free article] [PubMed] [Google Scholar]
- 5.Grabenstein JD. Trends in the numbers of US colleges of pharmacy and their graduates, 1900 to 2014. Am J Pharm Educ. 2016;80(2):Article 25. doi: 10.5688/ajpe80225. [DOI] [PMC free article] [PubMed] [Google Scholar]
- 6.Bosso JA, Chisholm-Burns M, Nappi J, Gubbins PO, Ross LA. Benchmarking in academic pharmacy departments. Am J Pharm Educ. 2010;74(8):Article 140. doi: 10.5688/aj7408140. [DOI] [PMC free article] [PubMed] [Google Scholar]
- 7.Maine LL, Vlasses PH. Assessing quality in pharmacy education in an era of rapid expansion. J Am Pharm Assoc. 2012;52(4):528–534. doi: 10.1331/JAPhA.2012.11229. [DOI] [PubMed] [Google Scholar]
- 8.Helmer O. Analysis of the Future: The Delphi Method. Santa Monica, CA: Rand Corp; 1967. [Google Scholar]
- 9.Meadows AB, Maine LL, Keyes EK, Pearson K, Finstuen K. Pharmacy executive leadership issues and associated skills, knowledge, and abilities. J Am Pharm Assoc (2003) 2005;45(1):55–62. doi: 10.1331/1544345052843183. [DOI] [PubMed] [Google Scholar]
- 10.Hsu C-C, Sandford BA. The Delphi Technique: making sense of consensus. Pract Assessment Res Eval. 2007;12(10):1–8. [Google Scholar]
- 11.Green B, Jones M, Hughes D, Williams A. Applying the Delphi Technique in a study of GPs’ information requirements. Health Soc Care Community. 1999;7(3):198–205. doi: 10.1046/j.1365-2524.1999.00176.x. [DOI] [PubMed] [Google Scholar]
- 12.Traynor AP, Boyle CJ, Janke KK. Guiding principles for student leadership development in the doctor of pharmacy program to assist administrators and faculty members in implementing or refining curricula. Am J Pharm Educ. 2013;77(10):Article 221. doi: 10.5688/ajpe7710221. [DOI] [PMC free article] [PubMed] [Google Scholar]
- 13.Schmidt RC. Managing Delphi surveys using nonparametric statistical techniques. Decis Sci. 1997;28(3):763–774. [Google Scholar]
- 14.Accreditation Council for Pharmacy Education strategic plan. https://www.acpe-accredit.org/about/mission.asp . Published 2016. Accessed August 25, 2016.
- 15.Ried LD. A model for curricular quality assessment and improvement. Am J Pharm Educ. 2011;75(10):Article 196. doi: 10.5688/ajpe7510196. [DOI] [PMC free article] [PubMed] [Google Scholar]
- 16.Hall PD, DiPiro JT, Rowen RC, McNair D. A continuous quality improvement program to focus a follege of pharmacy on programmatic advancement. Am J Pharm Educ. 2013;77(6):Article 117. doi: 10.5688/ajpe776117. [DOI] [PMC free article] [PubMed] [Google Scholar]
- 17.Ascione FJ. In pursuit of prestige: the folly of the US News and World Report survey. Am J Pharm Educ. 2012;76(6):Article 103. doi: 10.5688/ajpe766103. [DOI] [PMC free article] [PubMed] [Google Scholar]
- 18.Schlesselman L, Coleman CI. College and school of pharmacy characteristics associated with US News and World Report rankings. Am J Pharm Educ. 2013;77(3):Article 55. doi: 10.5688/ajpe77355. [DOI] [PMC free article] [PubMed] [Google Scholar]
- 19.Cohen JL. Today’s mandate for pharmacy deans: anticipating change. Am J Pharm Educ. 2009;73(1):Article 19. doi: 10.5688/aj730119. [DOI] [PMC free article] [PubMed] [Google Scholar]
- 20.Robles JR, Youmans SL, Byrd DC, Polk RE. Perceived barriers to scholarship and research among pharmacy practice faculty: survey report from the AACP scholarship/research faculty development task force. Am J Pharm Educ. 2009;73(1):Article 17. doi: 10.5688/aj730117. [DOI] [PMC free article] [PubMed] [Google Scholar]
- 21.Dalkey N, Helmer O. An experimental application of the Delphi method to the use of experts. Manage Sci. 1963;9(3):458–467. [Google Scholar]
- 22.Okoli C, Pawlowski SD. The Delphi method as a research tool: an example, design considerations and applications. Inf Manag. 2004;42(1):15–29. [Google Scholar]