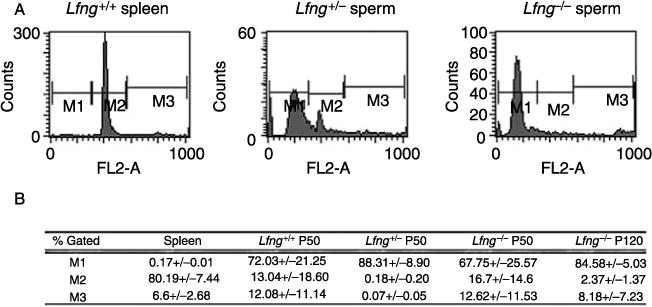
Figure 3.

FACS Analysis of the Lfng−/− spermatozoa. (A) Representative histograms of FACS analysis of spermatozoa. Spermatozoa were collected from the vas deferens and cauda epididymis. PI intensity (FL2-A) was used to assess nuclear DNA content. Spleen is purified spleen cells and serves as the diploid control. M1, haploid cells (200);M2, diploid G1 population (400);M3, tetraploid G2 population (800). All experiments were done with a minimum of five replicates/genotype. Gating for each sample was identical and based on the diploid spleen cells and aggregated material was excluded as much as possible. (B) Lfng−/− spermatozoa do not demonstrate increased aneuploidy. These are aggregated percentages of the gated cells + s.d. for each genotype at P50 and for Lfng−/− at P120. All experiments were done with a minimum of five replicates/genotype.
