Abstract
Background
Acute hepatitis B virus infection in adults is generally self-limiting but may lead to chronicity in a minority of patients.
Methods
We included 9 patients with acute hepatitis B virus (HBV) infection and collected longitudinal follow-up samples. Natural killer (NK) cell characteristics were analyzed by flowcytometry. HBV-specific T-cell function was analyzed by in vitro stimulation with HBV peptide pools and intracellular cytokine staining.
Results
Median baseline HBV DNA load was 5.12 log IU/mL, and median ALT was 2652 U/mL. Of 9 patients, 8 cleared HBsAg within 6 months whereas 1 patient became chronically infected. Early time points after infection showed increased CD56bright NK cells and an increased proportion of cells expressing activation markers. Most of these had normalized at week 24, while the proportion of TRAIL-positive CD56bright NK cells remained high in the chronically infected patient. In patients who cleared HBV, functional HBV-specific CD8+ and CD4+ responses could be observed, whereas in the patient who developed chronic infection, only low HBV-specific T-cell responses were observed.
Conclusions
NK cells are activated early in the course of acute HBV infection. Broad and multispecific T-cell responses are observed in patients who clear acute HBV infection, but not in a patient who became chronically infected.
Keywords: acute hepatitis B, HBV-specific T cells, NK cells, TRAIL
Infection with the hepatitis B virus (HBV) affects large numbers of individuals worldwide. As much as one-third of the global population has encountered HBV at some point in their life. Infection with HBV at an early age will lead to chronicity in the majority of cases (>95%), resulting in an estimated 240 million patients worldwide who are chronically infected with HBV [1, 2]. When an acute HBV infection is encountered later in life, the virus will be spontaneously cleared in most cases [3]. Less than 5% of immunocompetent adult patients, however, fail to clear the virus and become chronically infected with HBV. The mechanisms that lead to chronicity of hepatitis B infection are largely unknown. For clearance of the virus in the acute setting, both the innate and the adaptive immune system are important [4–7]. The innate immune system is responsible for early containment of the viruses and initial activation of adaptive immune responses. Although HBV has been shown to act as a “stealth” virus in woodchucks and chimpanzees, evading early intrahepatic immune responses [8, 9], it is uncertain whether these early innate responses are induced during acute HBV infection in man [10]. Other players of the innate immune system, natural killer (NK) cells, are activated early during infection, before HBV-specific T cells arise [11, 12]. Later on during infection, functionally active HBV-specific T cells can be detected, which are thought to play an important role in viral clearance. In chimpanzees, depletion of CD8+ T cells at week 6 of infection leads to failure to clear the infection [5]. During chronic infection, HBV-specific T cells are exhausted and their function is impaired [13]. However, whether these HBV-specific T cells were functionally active during the initial phases of infection is unknown. In acute hepatitis C infection, patients with self-limited infection have significant T cell responses compared with little or no responses in those who evolve to chronicity [14].
Acute hepatitis B infection is asymptomatic in the majority of cases, which makes it difficult to study. However, previous studies have focused on blood donors that became HBsAg positive (n = 2) or a local outbreak (n = 5) for the initial phases of infection [11, 15]. Here we examine the early dynamics of NK and HBV-specific T cell responses in symptomatic patients with acute HBV infection who presented at our clinic.
PATIENTS AND METHODS
Patients
Patients were included at the Gastroenterology and Hepatology Department of the Academic Medical Center in Amsterdam. Acute infection was diagnosed based on HBsAg and HBV DNA positivity, further serology, biochemistry, and anamnesis reporting risk of acquiring HBV. Patients were assessed at the outpatient clinic at first visit (clinical onset), which was defined as baseline (BL). Follow-up was at weeks 1, 4, 12, and 24. All patients were HIV seronegative and were not co-infected with hepatitis C or hepatitis delta virus. The study was approved by the Ethical Review Board of the Academic Medical Center Amsterdam, and all patients gave written informed consent. The study was conducted in accordance with Declaration of Helsinki, Good Clinical Practice guidelines, and local regulatory requirements.
Laboratory Testing
Biochemical and virological analyses were carried out by local laboratories in accordance with good laboratory practice. Qualitative detection of serum hepatitis B surface antigen (HBsAg) and antibody to hepatitis B surface antigen (anti-HBs) was performed by enzyme immunoassay (AxSYM; Abbott Laboratories, Abbott Park, IL). Quantitation of plasma HBV DNA levels was done by the Roche COBAS TaqMan 48 assay (F. Hoffmann-La Roche Ltd., Diagnostics Division, Basel, Switzerland), with a dynamic range between 20 and 1.70 × 10⁸ IU/mL. HBV genotype was determined by sequencing a part of the polymerase gene with dideoxynucleotide technology.
Sampling
Peripheral blood samples were obtained at baseline and during follow-up (weeks 1, 4, 12, and 24). Sampling included serum and plasma as well as peripheral blood mononuclear cells (PBMCs), which were isolated using standard density gradient centrifugation and subsequently cryopreserved until the day of analysis. Ten (serum/plasma) and 9 (PBMC) healthy blood donors were included for comparison. These were anonymous and therefore not age-, sex-, or ethnicity-matched to the patients.
Cytokine Measurements IP-10 and IL-18
Levels of IP-10 and IL-18 were measured in available patients’ serum and/or plasma samples (n = 9) with a DuoSet ELISA (R&D Systems, Minneapolis, MN). Values were extrapolated from standard curves (IP-10 range, 15.8–4000 pg/mL; IL-18 range, 8.2–2250 pg/mL). Serum samples from 10 healthy controls were included in the analyses.
Immune Phenotyping by Flowcytometry
PBMCs were washed in PBA (PBS containing 0.01% [w/v] NaN3, 0.5% [w/v] bovine serum albumin, and 2 mM EDTA) and 1.0 × 10⁶ cells were incubated for 30 minutes in the dark at 4°C with different combinations of fluorescent label-conjugated mouse monoclonal antibodies (mAbs). For phenotypic analysis, the following mAbs were used: CD3 V500, CD56 BUV395, CD16 BV786, CD16 BV421, CD27 BUV737, HLA-DR FITC, CD38 PE-Cy7, PD-1 BV421, CD14 PE-CF594, CD19 PE-CF594 (BD Biosciences, San Jose, CA), CD8 BV711 CD8 BV785, CD57 Alexa Fluor 647 (Biolegend), life/dead fixable red stain (Invitrogen, Camarillo, CA), NKp46 PerCP-efluor 710, CD45RA efluor 605 (eBioscience, San Diego, CA), NKG2A PE (Beckman Coulter, Fullerton, CA), and TRAIL APC (Miltenyi Biotec, Bergisch Gladbach, Germany). For intracellular staining, cells were fixed after surface staining with FACS Lysing Solution (BD) and subsequently permeabilized (FACS Permeabilizing Solution 2 [BD]). Cells were incubated for 30 minutes in the dark at 4oC with 1 or more of the following antibodies: perforin FITC (BD Biosciences), granzyme B PE (Sanquin, Amsterdam, the Netherlands), Ki67 BV711 (Biolegend, San Diego, CA), Eomes PerCP-efluor 710, and T-bet Pe-Cy7 (eBioscience, San Diego, CA). Measurements were done using LSR Fortessa flow cytometer (BD Biosciences, Europe) and FACS Diva Software. Analysis was done using FlowJo v. 10 (FlowJo LLC, Ashland, OR); gating strategies are summarized in Supplementary Figure 1.
NK Cell Function
PBMCs from all acute hepatitis B virus (AHB) patients (n = 8) at baseline and all patients (n = 9) at week 24 were cultured in the presence of CD107a FITC (BD Biosciences, San Jose, CA) and stimulated with IL-12 (0.5 ug/mL) and IL-15 (10 ug/mL) overnight. After stimulation, PBMCs were incubated with different antibodies for extracellular and intracellular staining, CD3 V500, CD56 BUV395, TNF-α AF700 (BD Biosciences, San Jose, CA), IFN-γ AF750 (Life Technologies, Eugene, OR), and MIP-1β PE-Cy7 (eBioscience, San Diego, CA), as described above. Measurements and analyses were done as described above.
Intracellular Staining HBV-Specific T Cells
A peptide library of HBV genotype A consisting of 15-mer peptides with 10 overlapping residues was obtained from Chiron Mimotopes (Victoria, Australia). PBMCs were cultured for 10 days with 5 pools of, in total, 315 peptides covering all proteins of HBV genotype A at 1 µg/mL/peptide. The PBMCs were restimulated for 6 hours at day 10 in the presence of CD107a PE (BD Biosciences, San Jose, CA), Brefeldin A, and monensin. The production of cytokines was evaluated by intracellular staining with IFN-γ BV421, MIP-1β Pe-Cy7, TNF-α AF700, and IL-2 APC monoclonal antibodies (BD Biosciences, San Jose, CA) after staining with surface markers as described above. Measurements and analyses were done as described above.
Statistical Analyses
The 2-tailed Mann-Whitney U test was used for analysis of differences between groups. For longitudinal analysis in individual patients, the Wilcoxon signed rank test was used. P values <.05 were considered statistically significant. GraphPad Prism version 6.07 for Windows (GraphPad Software, La Jolla, CA) was used for analyses.
RESULTS
Patients
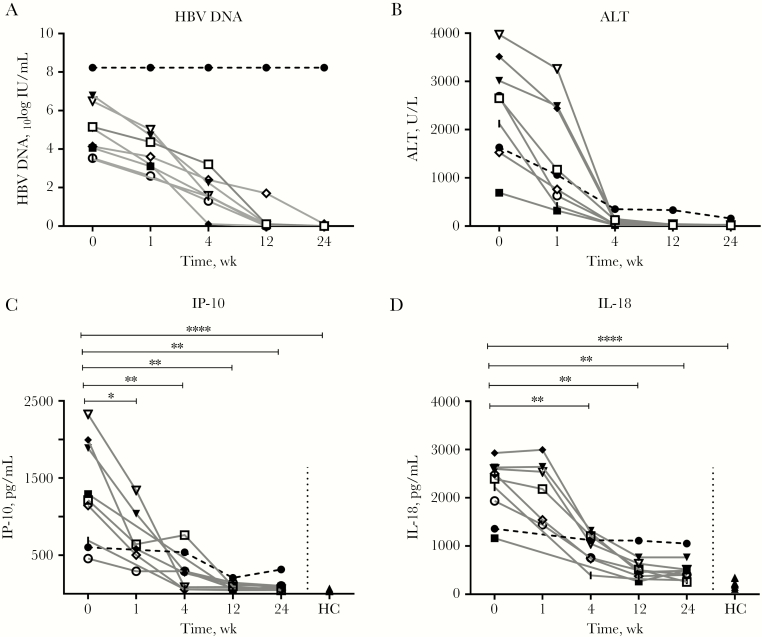
Nine patients with acute hepatitis B infection were included in the study (for baseline characteristics, see Table 1). Patients were infected with genotype A (n = 5) or genotype B, D, E, or F (all n = 1). At BL, the median HBV DNA load was 5.12 log IU/mL (interquartile range [IQR], 3.80–6.64) (Figure 1A) and the median ALT was 2652 U/mL (IQR, 1554–3390 U/mL) (Figure 1B). Six months after infection, 8 of 9 patients had spontaneously cleared the virus, of which 6 had formation of anti-HBs antibodies. One patient, infected with HBV genotype A, did not clear HBsAg within 6 months. At 6 months after initial presentation, the viral load in this patient was >1.7 × 10⁸ IU/mL (upper limit of quantification) and ALT was 454 U/mL (Figure 1A, B). In all patients, IP-10 and IL-18 levels were measured. At baseline, the plasma levels of IP-10 were increased in patients with acute HBV infection (n = 8), as compared with week 24 when viral clearance had occurred (median, 1254 and 63.5 pg/mL, respectively; P ≤ .0001) (Figure 1C). In addition, baseline IL-18 levels were significantly increased in patients with AHB infection (median, 2447 pg/mL) as compared with week 24 (median, 447.3 pg/mL; P = .008) (Figure 1D). At week 24, IP-10 levels had normalized, while IL-18 levels were still increased as compared with healthy controls (median, 210.5 pg/mL; P = .0005) (Figure 1D).
Table 1.
Baseline Characteristics
| Patient | Genotype | Sex | Age, y | Baseline HBV DNA, 10log IU/mL | ALT, U/L | Bilirubin, µmol/L | Clearance < 6 mo |
|---|---|---|---|---|---|---|---|
| 1 | D | M | 30 | 5.16 | 2652 | n.a. | Yes |
| 2 | B | F | 42 | 3.48 | 2126 | 78 | Yes |
| 3 | A | M | 51 | 8.23 | 1631 | 30 | No |
| 4 | A | M | 29 | 4.06 | 690 | 393 | Yes |
| 5 | A | F | 54 | 5.08 | 3514 | 194 | Yes |
| 6 | A | M | 53 | 6.79 | 3016 | 246 | Yes |
| 7 | F | M | 49 | 6.49 | 3970 | 257 | Yes |
| 8 | A | M | 38 | 4.14 | 1528 | 338 | Yes |
| 9 | E | M | 42 | 3.53 | 2686 | 219 | Yes |
Figure 1.
Viral load, ALT, and cytokine production decreases in patients who cleared infection. Hepatitis B virus (HBV) DNA (A), ALT (B), IP-10 (C), and IL-18 (D) levels were measured in all 9 patients with acute HBV throughout the course of infection and in 6 or more healthy controls. The Mann-Whitney U test and Wilcoxon test were used to determine statistical significance. ****P < .0001; **P < .01; *P < .05. Patient 1 (□), patient 2 (|), patient 3 (●), patient 4 (■), patient 5 (◆), patient 6 (▼), patient 7 (▽), patient 8 (◇), patient 9 (○), and healthy controls (●). Abbreviations: HBV, hepatitis B virus; HC, healthy controls.
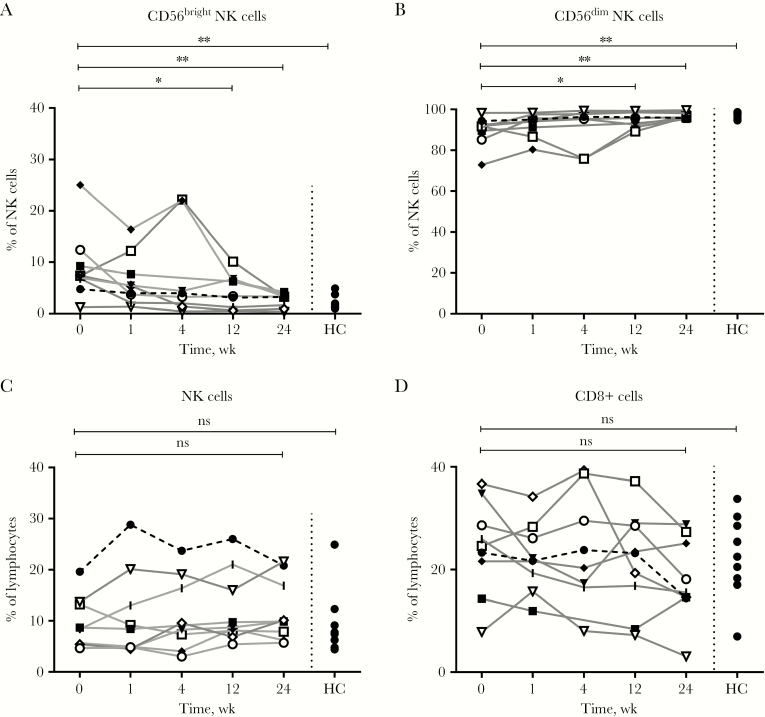
Early time points after infection (baseline and week 1) showed an increase in the proportion of CD56bright NK cells (baseline median, 7.4%) as compared with the time point after clearance of the virus (week 24: median, 3.3%; P = .008) and healthy controls (median, 1.4%; P = .0037) (Figure 2A). Furthermore, the proportion of CD56dim NK cells was decreased (Figure 2B) early during infection, while the proportion of total NK and total CD8+ T cells was not significantly different from that of week 24 or the healthy controls (Figure 2C, D). There was no significant change in the proportion of effector and memory CD8+ T cells. However, the memory T-cell population was activated, as demonstrated by the significant increase in PD-1, Ki67, HLA-DR/CD38, perforin, and granzyme B–positive memory T cells (Supplementary Figure 2).
Figure 2.
The proportions of CD56bright natural killer (NK) cells were increased and CD56dim cells were decreased in acute hepatitis B virus patients during the early phase of infection. The proportions of CD56bright (A) and CD56dim (B) NK cells, total NK cells (C), and total CD8+ T cells (D) in 9 patients with acute hepatitis B virus (HBV) infection as well as in 9 healthy controls (HCs) were analyzed using immune phenotyping by flowcytometry. The Mann-Whitney U test and Wilcoxon test were used to determine statistical significance. **P < .01; *P < .05. Patient 1 (□), patient 2 (|), patient 3 (●), patient 4 (■), patient 5 (◆), patient 6 (▼),patient 7 (▽),patient 8 (◇), patient 9 (○), and healthy controls (●). Abbreviations: HC, healthy controls; NK, natural killer; ns, nonsignificant.
Early NK Cell Activation
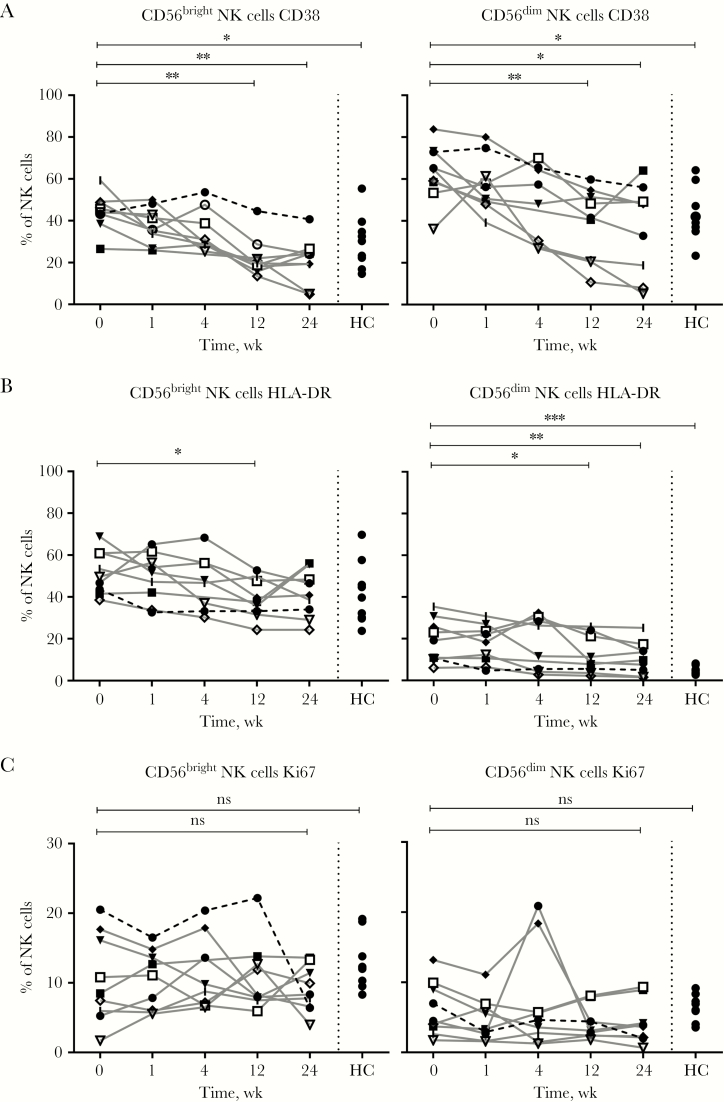
To investigate the role of NK cells at different time points during acute infection, we measured the expression of several markers of NK cell activation. The proportion of CD56bright NK cells expressing CD38 was elevated at baseline (median, 44.9%; P = .008) and normalized during the course of infection, until it was significantly lower at week 12 (median, 19.2%), week 24 (median, 21.8%), and compared with healthy controls (median, 30.3%; P = .0206) (Figure 3A). The proportion of CD56dim NK cells expressing CD38 showed a similar significant decline in AHB patients throughout the course of infection (Figure 3A). HLA-DR was expressed on an increased proportion of CD56dim NK cells at baseline (median, 15.1%) in AHB patients as compared with week 24 (median, 8.6%; P = .008) and healthy controls (median, 4.6%; P = .0003) (Figure 3B). Ki67, a marker for proliferation, was not differentially expressed on CD56bright or CD56dim NK cells between baseline, week 24, or healthy controls. (Figure 3C). The differentiation status of NK cells, as measured by CD57 and NKG2A expression, was not different in patients with acute hepatitis B infection as compared with healthy controls (Supplementary Figure 3).
Figure 3.
Natural killer (NK) cell activation markers are increased at baseline in acute hepatitis B virus (HBV) infection. Markers of NK cell activation CD38 (A), HLA-DR (B), Ki67 (C) in CD56bright (left) and CD56dim (right) NK cells were measured in 9 patients with acute HBV infection and in 9 healthy controls and analyzed using phenotyping by flowcytometry. The Mann-Whitney U test and Wilcoxon test were used to determine statistical significance. ***P < .001; **P < .01; *P < .05. Patient 1 (□), patient 2 (|), patient 3 (●), patient 4 (■), patient 5 (◆), patient 6 (▼),patient 7 (▽),patient 8 (◇), patient 9 (○), and healthy controls (●). Abbreviations: HC, healthy controls; NK, natural killer; ns, nonsignificant.
Long-term Increase in Effector Markers
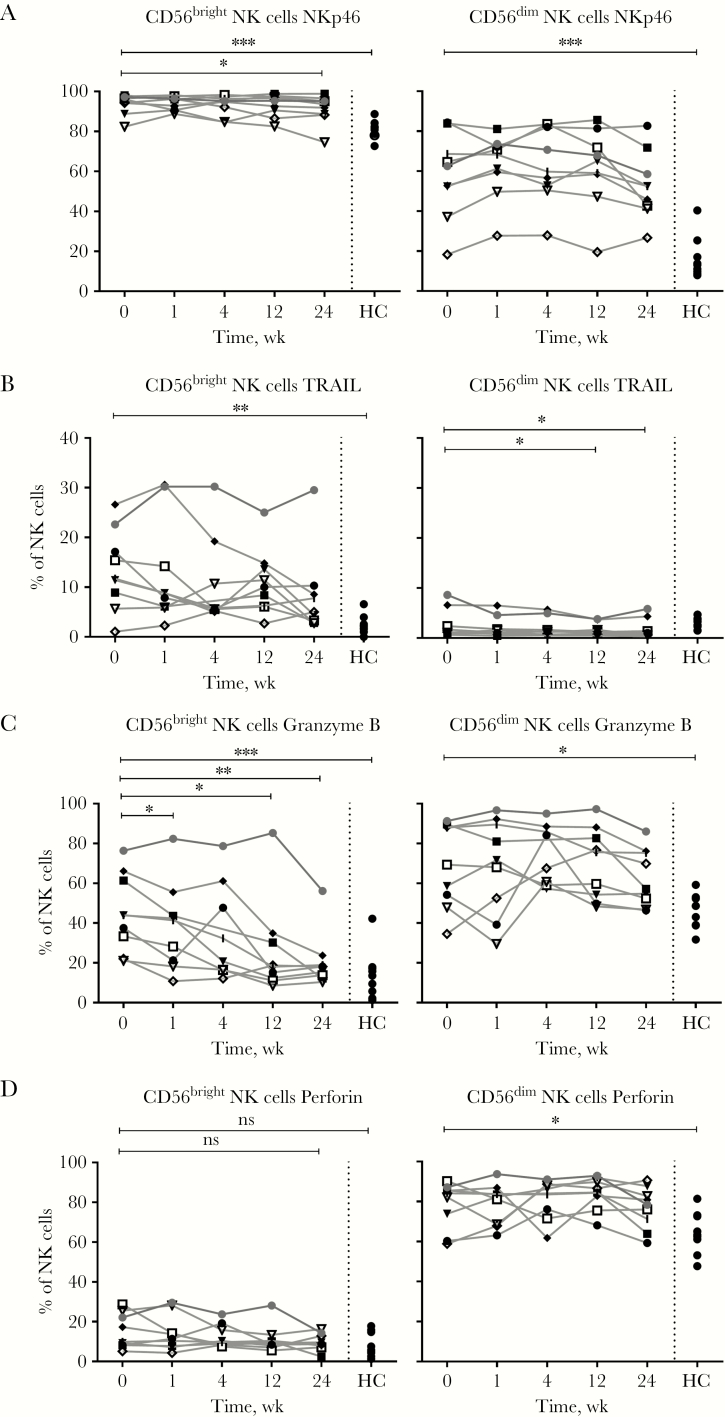
The proportion of CD56bright NK cells expressing NKp46, an activating receptor, was significantly increased at all time points during acute HBV infection, as compared with healthy controls (AHB baseline median, 95.2%; HC, 81.6%; P = .0003) (Figure 4A). This was similar for CD56dim NK cells (Figure 4A). The TNF-related apoptosis-inducing ligand TRAIL is generally expressed by a minority of CD56bright NK cells. At baseline acute HBV infection, the proportion of TRAIL+ CD56bright NK cells was significantly increased as compared with healthy controls (median, 11.6% and 2.2%, respectively; P = .006) and compared with week 24 (median, 4.7%; P = .03) (Figure 4B). Furthermore, TRAIL expression in the patient who was chronically infected was still elevated at week 24 after initial presentation (29.5% of CD56bright NK cells) (Figure 4B). The proportion of granzyme B– and perforin-positive CD56dim NK cells at baseline was significantly higher as compared with healthy controls (granzyme B: baseline AHB, 64%; HC, 48.6%; P = .04; perforin: baseline AHB, 83.1%; HC, 63.3%; P = .05) but did not significantly decrease during the 24-week period (Figure 4C, D). At baseline, granzyme B was expressed by a considerable proportion of CD56bright NK cells, which are generally thought to play a lesser role in cytotoxicity (Figure 4C). In particular, a high proportion of granzyme B–expressing CD56bright NK cells remained present in the patient who evolved to chronic infection (Figure 4C). During AHB infection, the proportion of NK cells producing interferon gamma (IFN-γ) in response to cytokine stimulation was increased at baseline and week 24 (median, 18.2% and 31%, respectively) as compared with healthy controls (median, 4.5%; P = .02 and .008, respectively) (Supplementary Figure 4). Tumor necrosis factor (TNF-α) and macrophage inflammatory protein-1β (MIP-1β) expression was not different in AHB-infected patients compared with healthy controls (Supplementary Figure 4).
Figure 4.
Natural killer (NK) cell activation markers (A and B) are increased in acute hepatitis B virus (HBV) infection. Effector markers NKp46 (A), TRAIL (B), Granzyme B (C), and Perforin (D) in CD56bright and CD56dim NK cells in 9 patients with acute HBV infection and in 9 healthy controls were analyzed using immune phenotyping by flowcytometry. The Mann-Whitney U test and Wilcoxon test were used to determine statistical significance. ***P < .001; **P < .01; *P < .05. Patient 1 (□), patient 2 (|), patient 3 (●), patient 4 (■), patient 5 (◆), patient 6 (▼),patient 7 (▽),patient 8 (◇), patient 9 (○), and healthy controls (●). Abbreviations: HC, healthy controls; NK, natural killer; ns, nonsignificant.
HBV-Specific T-Cell Responses
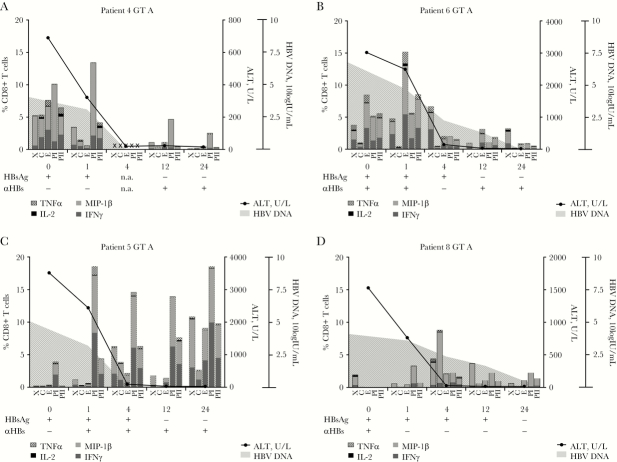
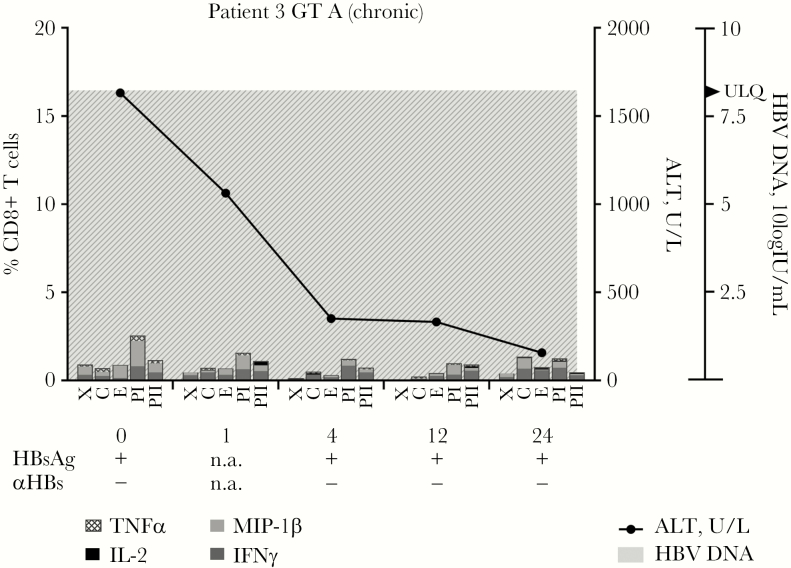
HBV-specific T-cell responses, measured by cytokine production in response to HBV peptide pools, were analyzed in 5 patients who were infected with HBV genotype A. Even though intra-individual differences were observed in the specificity and timing of the response, HBV-specific T-cell responses could be observed in all patients who spontaneously cleared the HBV infection during the 6 months of follow-up (Figure 5A–D). In the patient who became chronically infected, however, very low HBV-specific T-cell responses were observed at all time points (Figure 6). Patients who cleared the HBV infection could have an early peak of HBV-specific CD8+ T-cell responses at week 1 (patients 4 and 6) or a later peak (patients 5 and 8) (Figure 6). The specificity of the T-cell response also differed between patients. In patients 4 and 5, the highest observed sum of cytokine responses was observed in response to the polymerase peptide pool, whereas in patient 6 the highest cytokine production was against the envelope pool, and in patient 8 against the core peptide pool. CD4+ T-cell responses mostly followed the same patterns (Supplementary Figure 5).
Figure 5.
Hepatitis B virus (HBV)–specific CD8+ T-cell responses in patients who cleared acute HBV infection. Cytokine production, upon HBV peptide stimulation, has been analyzed in CD8+ T cells from acute hepatitis B virus genotype A patients (n = 4) who cleared the virus. TNFα, IL-2, MIP-1β, and IFNγ production was measured using flowcytometry. Peptide pools: C, core protein; E, envelope protein; PI, polymerase protein pool I; PII, polymerase protein pool II; X, x protein. Abbreviations: GT, genotype; HBV, hepatitis B virus; n.a., not available.
Figure 6.
Hepatitis B virus (HBV)–specific CD8+ T-cell responses are decreased in a patient developing chronic HBV infection. Peripheral blood mononuclear cells (PBMCs) were isolated from an HBV genotype A–infected patient who evolved to chronic infection after acute HBV infection. These PBMCs were stimulated with HBV-derived peptides and TNFα, IL-2, MIP-1β, and IFNγ production was measured via flowcytometry. Peptide pools: C, core protein; E, envelope protein; PI, polymerase protein pool I; PII, polymerase protein pool II; X, x protein. Abbreviations: GT, genotype; HBV, hepatitis B virus; n.a., not available.
DISCUSSION
Here were show the temporal dynamics of NK cells and T cells in 9 patients during acute hepatitis B infection, of which 1 developed chronicity. HBV is a noncytopathic virus; however, immune responses mounted by the host can cause serious liver damage. Whereas viral clearance can occur without clinical symptoms or cell destruction [4, 11], in our patient cohort, hepatocyte damage was apparent by ALT elevations. As we observed a significant increase in the proportion of total peripheral memory T cells expressing makers of activity and cytolytic proteins, HBV-nonspecific bystander T cells could have played a role in hepatocyte injury [16, 17], as seen in mouse models of acute fulminant HBV infection [18].
At the time of presentation at the clinic, plasma levels of IP-10, an interferon-stimulated gene (ISG), were significantly increased, suggesting broad innate immune activation via the interferon pathway. Previous studies have shown no significant induction of type I interferons in the initial phases of acute HBV infection in chimpanzees [8] or woodchucks [9]. Also, in man, type I interferon production was not observed early during infection [10]; still, it has not been ruled out that other interferon types such as IFN-λ are induced [10]. As we included patients who already were symptomatic, it is more likely that local danger signals or production of interferons by lymphocytes had activated the ISG pathway [8].
Early during the infection, the proportion of CD56bright NK cells was significantly increased as compared with time points after clearance of the virus. Furthermore, we observed a striking increase in the proportion of CD38 and HLA-DR- and Ki67-positive NK cells, indicating activation of these cells. Previously, it was shown that in patients with symptomatic infection, NK cell function is inhibited before peak viremia, and NK cells only become activated after peak viremia [10]. As we only included patients after peak viremia, we may have missed the described inhibition of NK cells in the preclinical phase of infection. Moreover, we observed an increased capacity of NK cells to produce IFN-γ at baseline in patients with AHB. The proportion of NK cells expressing perforin and granzyme B was increased in patients with an acute HBV infection. While in mice hepatocytes infected with a recombinant adenovirus have been suggested to be resistant to perforin-mediated killing [19], the increase in the proportion of NK cells expressing cytotoxic molecules suggests that they could have a role in hepatocyte damage. As such, an increase in perforin expression by HBV-specific T cells has been observed in acute HBV infection [20].
As the proportion of TRAIL-expressing CD56bright NK cells was significantly increased, TRAIL-mediated killing of infected hepatocytes could also be responsible for ALT elevations [21]. However, in 2 previously described patients who cleared the infection without any symptoms or ALT elevations, NK cells were activated early in the course of acute HBV infection, emphasizing that these cells can be important in noncytopathic elimination of HBV [11]. While Ki67, HLA-DR, and CD38 normalized after clearance of the virus, other NK cell markers were still increased at week 24 as compared with healthy controls, including NKp46, TRAIL, perforin, and granzyme B. In line with this, baseline elevated levels of IL-18, which is associated with NK cell activation [22], were still significantly elevated at week 24. Interestingly, in patients with chronic hepatitis B, TRAIL expression is significantly elevated [23]. Similarly, in the patient who evolved to chronic infection, TRAIL remained expressed on a significant proportion of CD56bright NK cells. Whether this TRAIL-positive population is a cause or a result of chronic infection remains unanswered. During chronic infection, TRAIL has been suggested to play a role in the killing of infected hepatocytes [21], as well as in NK cell–mediated clearance of HBV-specific T cells [24].
Even though HBV-specific T cells seem to be inhibited by IL-10 and arginase early during infection [10, 25], their presence is highly associated with viral clearance [5, 10, 26]. From acute HCV infection, we know that evolution to chronicity is associated with weak and transient responses of HCV-specific T cells [14, 27]. Clearance of the infection, on the other hand, is associated with the appearance of multispecific HCV-specific CD8+ T-cell responses against multiple epitopes [27]. However, in 2 blood donors with acute HBV infection who were followed during asymptomatic infection, HBV-specific T-cell responses reached their peak when HBV DNA was already declining, emphasizing the importance of other immune mechanisms for antiviral activity [11]. Early T-cell responses in these patients were directed against envelope and polymerase proteins [11]. In 2 other patients, early responses were directed against polymerase and the X protein, followed by responses against core and envelope [10]. Here we observed broad reaction to all HBV proteins in 2 patients at the earliest time point (patients 4 and 6). A more delayed and narrow HBV-specific T-cell response was observed in 2 other patients while they already showed ALT elevation and viral load decline (patients 5 and 8). Previously, a lack of T-cell responses was associated with persistently high HBV DNA levels and the need for treatment in an immunosuppressed patient [15]. This association was also seen in mice that were chronically infected with the lymphocytic choriomeningitis virus. In this mouse model, high viral titres were associated with functional impairment of CD8 T cells, a diminished production of IL-2 by virus-specific CD4 T cells, and persistence of infection to chronicity [28, 29]. In the 1 patient who did not clear HBV infection and was not immunocompromised, the observed narrow T-cell response may have led to chronic infection. This is in line with the evolution of chronicity in woodchucks infected with the woodchuck hepatitis virus [30], as well as observations in acute hepatitis C virus patients [14].
Acute HBV infection can present in many different ways: with or without ALT elevations, and with or without symptoms. Therefore, the underlying mechanisms may also differ between cases. As 1 of the patients in this study developed chronic infection, we had the unique opportunity to analyze early events that could be associated with failure to clear HBV. Our data suggest that the absence of HBV-specific T-cell response at all time points could play a role in progression to chronic infection. Furthermore, a substantial population of CD56bright NK cells expressing TRAIL, as seen in chronic HBV infection, was present at all time points in this patient. A better understanding of the early course of acute infection and the evolution to chronicity may help the development of novel therapeutics targeting chronic hepatitis B virus infection.
Supplementary Data
Supplementary materials are available at Open Forum Infectious Diseases online. Consisting of data provided by the authors to benefit the reader, the posted materials are not copyedited and are the sole responsibility of the authors, so questions or comments should be addressed to the corresponding author.
Supplementary Material
Acknowledgments
Author contributions. F.S., A.N., and S.W. performed the clinical study and sample collection; F.S., R.E., A.N., M.S., E.L., N.K., and H.R. were involved in study design; F.S., R.E., M.S., and K.D. performed experiments and data analyses; F.S. wrote the manuscript; F.S., R.E., A.N., S.W., M.S., H.Z., E.L., N.K., and H.R. critically revised the manuscript.
Potential conflicts of interest. Sophie Willemse served as a speaker, a consultant, and an advisory board member for AbbVie, Bristol-Myers-Squibb, Gilead Sciences, Janssen Therapeutics, and Roche. Henk Reesink received grants and personal fees from Roche, Bristor Myers Squibb, Gilead Sciences, Abbvie, Janssen-Cilag, MSD, PRA-international, Regulus Therapeutics, and Replicor; received personal fees from Alnylam; and received a grant from Boehringer Ingelheim. All other authors: no conflicts declared. All authors have submitted the ICMJE Form for Disclosure of Potential Conflicts of Interest. Conflicts that the editors consider relevant to the content of the manuscript have been disclosed.
Presented in part: The Liver Meeting AASLD 2016 Boston, Joint BSI/NVVI conress 2016 Liverpool.
References
- 1. Schweitzer A, Horn J, Mikolajczyk RT et al. . Estimations of worldwide prevalence of chronic hepatitis B virus infection: a systematic review of data published between 1965 and 2013. Lancet 2015; 386:1546–55. [DOI] [PubMed] [Google Scholar]
- 2. Ott JJ, Stevens GA, Groeger J, Wiersma ST. Global epidemiology of hepatitis B virus infection: new estimates of age-specific HBsAg seroprevalence and endemicity. Vaccine 2012; 30:2212–9. [DOI] [PubMed] [Google Scholar]
- 3. Revill P, Yuan Z. New insights into how HBV manipulates the innate immune response to establish acute and persistent infection. Antivir Ther 2013; 18:1–15. [DOI] [PubMed] [Google Scholar]
- 4. Guidotti LG, Rochford R, Chung J et al. . Viral clearance without destruction of infected cells during acute HBV infection. Science 1999; 284:825–9. [DOI] [PubMed] [Google Scholar]
- 5. Thimme R, Wieland S, Steiger C et al. . CD8(+) T cells mediate viral clearance and disease pathogenesis during acute hepatitis B virus infection. J Virol 2003; 77:68–76. [DOI] [PMC free article] [PubMed] [Google Scholar]
- 6. Ferrari C, Penna A, Bertoletti A et al. . Cellular immune response to hepatitis B virus-encoded antigens in acute and chronic hepatitis B virus infection. J Immunol 1990; 145:3442–9. [PubMed] [Google Scholar]
- 7. Ferrari C. HBV and the immune response. Liver Int 2015; 35(Suppl 1):121–8. [DOI] [PubMed] [Google Scholar]
- 8. Wieland S, Thimme R, Purcell RH, Chisari FV. Genomic analysis of the host response to hepatitis B virus infection. Proc Natl Acad Sci U S A 2004; 101:6669–74. [DOI] [PMC free article] [PubMed] [Google Scholar]
- 9. Fletcher SP, Chin DJ, Ji Y et al. . Transcriptomic analysis of the woodchuck model of chronic hepatitis B. Hepatology 2012; 56:820–30. [DOI] [PMC free article] [PubMed] [Google Scholar]
- 10. Dunn C, Peppa D, Khanna P et al. . Temporal analysis of early immune responses in patients with acute hepatitis B virus infection. Gastroenterology 2009; 137:1289–300. [DOI] [PubMed] [Google Scholar]
- 11. Fisicaro P, Valdatta C, Boni C et al. . Early kinetics of innate and adaptive immune responses during hepatitis B virus infection. Gut 2009; 58:974–82. [DOI] [PubMed] [Google Scholar]
- 12. Rehermann B. Natural killer cells in viral hepatitis. Cell Mol Gastroenterol Hepatol 2015; 1:578–88. [DOI] [PMC free article] [PubMed] [Google Scholar]
- 13. Rehermann B, Lau D, Hoofnagle JH, Chisari FV. Cytotoxic T lymphocyte responsiveness after resolution of chronic hepatitis B virus infection. J Clin Invest 1996; 97:1655–65. [DOI] [PMC free article] [PubMed] [Google Scholar]
- 14. Urbani S, Amadei B, Fisicaro P et al. . Outcome of acute hepatitis C is related to virus-specific CD4 function and maturation of antiviral memory CD8 responses. Hepatology 2006; 44:126–39. [DOI] [PubMed] [Google Scholar]
- 15. Webster GJ, Reignat S, Maini MK et al. . Incubation phase of acute hepatitis B in man: dynamic of cellular immune mechanisms. Hepatology 2000; 32:1117–24. [DOI] [PubMed] [Google Scholar]
- 16. Abrignani S. Bystander activation by cytokines of intrahepatic T cells in chronic viral hepatitis. Semin Liver Dis 1997; 17:319–22. [DOI] [PubMed] [Google Scholar]
- 17. Maini MK, Boni C, Lee CK et al. . The role of virus-specific CD8(+) cells in liver damage and viral control during persistent hepatitis B virus infection. J Exp Med 2000; 191:1269–80. [DOI] [PMC free article] [PubMed] [Google Scholar]
- 18. Ando K, Moriyama T, Guidotti LG et al. . Mechanisms of class I restricted immunopathology. A transgenic mouse model of fulminant hepatitis. J Exp Med 1993; 178:1541–54. [DOI] [PMC free article] [PubMed] [Google Scholar]
- 19. Kafrouni MI, Brown GR, Thiele DL. Virally infected hepatocytes are resistant to perforin-dependent CTL effector mechanisms. J Immunol 2001; 167:1566–74. [DOI] [PubMed] [Google Scholar]
- 20. Urbani S, Boni C, Missale G et al. . Virus-specific CD8+ lymphocytes share the same effector-memory phenotype but exhibit functional differences in acute hepatitis B and C. J Virol 2002; 76:12423–34. [DOI] [PMC free article] [PubMed] [Google Scholar]
- 21. Dunn C, Brunetto M, Reynolds G et al. . Cytokines induced during chronic hepatitis B virus infection promote a pathway for NK cell-mediated liver damage. J Exp Med 2007; 204:667–80. [DOI] [PMC free article] [PubMed] [Google Scholar]
- 22. Serti E, Werner JM, Chattergoon M et al. . Monocytes activate natural killer cells via inflammasome-induced interleukin 18 in response to hepatitis C virus replication. Gastroenterology 2014; 147:209–20.e3. [DOI] [PMC free article] [PubMed] [Google Scholar]
- 23. Peppa D, Micco L, Javaid A et al. . Blockade of immunosuppressive cytokines restores NK cell antiviral function in chronic hepatitis B virus infection. PLoS Pathog 2010; 6:e1001227. [DOI] [PMC free article] [PubMed] [Google Scholar]
- 24. Peppa D, Gill US, Reynolds G et al. . Up-regulation of a death receptor renders antiviral T cells susceptible to NK cell-mediated deletion. J Exp Med 2013; 210:99–114. [DOI] [PMC free article] [PubMed] [Google Scholar]
- 25. Sandalova E, Laccabue D, Boni C et al. . Increased levels of arginase in patients with acute hepatitis B suppress antiviral T cells. Gastroenterology 2012; 143:78–87.e3. [DOI] [PubMed] [Google Scholar]
- 26. Boettler T, Panther E, Bengsch B et al. . Expression of the interleukin-7 receptor alpha chain (CD127) on virus-specific CD8+ T cells identifies functionally and phenotypically defined memory T cells during acute resolving hepatitis B virus infection. J Virol 2006; 80:3532–40. [DOI] [PMC free article] [PubMed] [Google Scholar]
- 27. Sung PS, Racanelli V, Shin EC. CD8(+)T-cell responses in acute hepatitis C virus infection. Front Immunol 2014; 5:266. [DOI] [PMC free article] [PubMed] [Google Scholar]
- 28. Wherry EJ, Blattman JN, Murali-Krishna K et al. . Viral persistence alters CD8 T-cell immunodominance and tissue distribution and results in distinct stages of functional impairment. J Virol 2003; 77:4911–27. [DOI] [PMC free article] [PubMed] [Google Scholar]
- 29. Fuller MJ, Zajac AJ. Ablation of CD8 and CD4 T cell responses by high viral loads. J Immunol 2003; 170:477–86. [DOI] [PubMed] [Google Scholar]
- 30. Menne S, Roneker CA, Roggendorf M et al. . Deficiencies in the acute-phase cell-mediated immune response to viral antigens are associated with development of chronic woodchuck hepatitis virus infection following neonatal inoculation. J Virol 2002; 76:1769–80. [DOI] [PMC free article] [PubMed] [Google Scholar]
Associated Data
This section collects any data citations, data availability statements, or supplementary materials included in this article.


