Abstract
Automated segmentation of portal vein (PV) for liver radiotherapy planning is a challenging task due to potentially low vasculature contrast, complex PV anatomy and image artifacts originated from fiducial markers and vasculature stents. In this paper, we propose a novel framework for automated PV segmentation from computed tomography (CT) images. We apply convolutional neural networks (CNN) to learn consistent appearance patterns of PV using a training set of CT images with reference annotations and then enhance PV in previously unseen CT images. Markov Random Fields (MRF) were further used to smooth the CNN enhancement results and remove isolated mis-segmented regions. Finally, CNN-MRF-based enhancement was augmented with PV centerline detection that relied on PV anatomical properties such as tubularity and branch composition. The framework was validated on a clinical database with 72 CT images of patients scheduled to liver stereotactic body radiation therapy. The obtained segmentation accuracy was DSC = 0.83 and η = 1.08 mm in terms of the median Dice coefficient and mean symmetric surface distance, respectively, when segmentation is encompassed into the PV region of interest. The obtained results indicate that CNN and anatomy analysis can be used for accurate segmentation of PV and potentially integrated into liver radiation therapy planning.
Keywords: Convolutional neural networks, portal vein, segmentation, liver cancer, radiotherapy planning, SBRT
Introduction
Liver cancer is among the most prevalent and lethal cancer types with estimated 40,710 new cases and 28,920 deaths in the US in 2017 [1]. Radiation therapy (RT) is considered to be one of the main treatment strategies for liver cancer and modern stereotactic body radiation therapy (SBRT) demonstrates two-year local control rates greater than 80% [2]. Planning of RT is a challenging ill-posed problem, where delivering tumoricidal dose to the cancer often involves irradiation of the surrounding healthy organs-at-risks (OARs). Such irradiation may compromise functioning of the OARs, and 9–30% of liver RTs result in OARs toxicities and hepatic function decline [3], [4]. A new type of post-treatment toxicity associated with irradiation of hepatobiliary tract, so called central liver toxicity, has been recently discovered [5]. Having hepatobiliary tract anatomically defined as the area around portal vein (PV), it becomes important to segment PV from computed tomography (CT) images during RT planning, and configure the radiation beams in such a way that the dose delivered to the vein is below safe dose constraints. Manual PV segmentation from CT image is time and labor consuming and may be subjected to human errors, therefore there is a high demand in automated segmentation solutions.
Segmentation of liver vasculature is of great importance for diagnosis of vasculature disease, liver vascular surgeries, liver transplantation planning, tumor vascularization analysis, etc. and therefore its automation has been receiving considerable attention in the literature [6]. The majority of the existing methods focus on thin and medium-size vessels that are usually located deep inside or at the peripheral sides of the liver [6]. Such vessels have strongly tubular shapes and therefore their positioning and orientation can be reliably estimated using eigenvectors and eigenvalues, i.e. the principal component analysis (PCA). Moreover, to recognize medium-size vessels, a relatively small image region containing a vessel needs to be observed opening a room for filter-PCA-based segmentation approaches. Frangi et al. [7] discovered that Hessian image filters tend to have high-high-low magnitude eigenvalues when applied on tubular structures and proposed a multi-scale Hessian filter for vessel enhancement, which has become a reference standard in the field. Following this direction, Hessian filters were augmented with Gabor filters [8], Gaussian filters [9], linear operators [10], flux maximizing flow [11] wavelets [12] and other techniques [13], [14] for more accurate enhancement. As noise can significantly compromise the appearance of vessels, noise reduction is shown to improve the filter performance and consequently the quality of enhancement [15], [16].
Filter-based approaches usually fail to enhance thick vessels, such as PV, due to limited fields of view of the filters and complex shape of the PV [17]. Alternative enhancement approaches including context-based voting [18], region growing [19]–[21], Gaussian mixture models [13], [22], active contours [23], [24], graph-cut [25] and statistical shape analysis [25], [26] do not specifically address PV segmentation problem. Recently, Zeng et al. [27] applied single-layer neural networks for segmentation for liver vasculature which was successful on segmentation of thin and medium-size but demonstrated limited success on PV segmentation. Bruyninckx et al. [28] applied support vector machines to automatically detect bifurcations of PV and then found the optimal graph connecting those bifurcations. Esneault et al. [29] combined graph cut and region growing for PV segmentation but only visual results were given in their paper. Automatic PV segmentation was proposed for magnetic resonance (MR)-based liver transplantation planning [30], [31], where, however, PVs have very distinctive intensity appearance and can be well-approximated using adaptive thresholding. We therefore conclude that PV segmentation has been poorly addressed in the literature and the existing results are not satisfactory for the clinical usage.
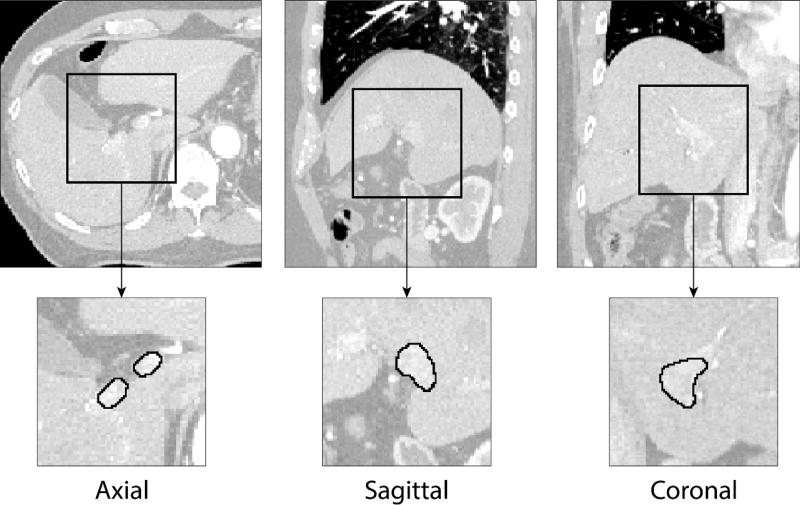
Segmentation of PV cannot be straightforwardly solved by the existing approaches due to highly variable vasculature contrast, which makes PV poorly visible in pre-radiotherapy CT images, and image artifacts originated from fiducial markers and vasculature stents, which additionally compromise the PV appearance. Another challenge is highly variable PV anatomy, as non-standard confluence of vein branches, trifurcations, etc. occur in more than 20% of cases [32]. The problem of labeling individual vessels of liver is non-trivial and can be partially automated using graph [33] and probabilistic [34] modeling. As a result, even manual or semi-automated PV segmentation may be inconsistent [35]. In this work, we develop a novel framework for automated PV segmentation from CT images of patients scheduled for liver SBRT (Fig. 1). There are three contributions of this research. First, we for the first time target the problem of segmenting PV for radiotherapy planning, where presence of tumor may significantly alter the PV anatomy and fiducial markers inserted into tumor may severely distort the PV appearance. Second, we propose an innovative segmentation methodology by combining the recent developments in deep learning with the PV anatomy features. Finally, we perform comprehensive validation of the proposed framework on a database of patients with liver metastases, hepatocellular carcinoma, cholangiocarcinoma and other primary liver cancers.
Figure 1.
Examples of portal vein manual segmentation (solid line) from liver CT images shown in axial, sagittal and coronal cross-sections. A relatively low level of contrast agent makes automated portal vein segmentation a challenging task.
The paper is organized as follows. Section 2 presents the methodology of convolutional neural networks, i.e. a concept of deep learning for image analysis, PV centerline detecting and combining deep learning with centerlines for PV segmentation. Section 3 validates the proposed methodology on a database of liver CT images. The obtained results are analyzed in Section 4, and summarized in Section 5.
Methodology
Portal vein enhancement with convolutional neural networks
Convolutional neural network (CNN) is a special form of machine learning classifier that is designed to learn consistent patterns from a training set of reference images with annotations and make predictions about previously unseen images. Without a need for hand-crafted image features, which are usually geometrically and mathematically limited, CNNs effectively model consistent intensity patterns of depicted objects with complex and highly variable appearance. During CNN training, convolutional layers of the network automatically generate appearance features and combine them into a hierarchical prediction models. To form a convolutional layer , features slide across its preceding layer , where X0 is the input image:
| (1) |
where is the m-th feature defined as a convolutional linear kernel of size Pl+1 and Rl+1, is additive bias and function f applies non-linearity to feature responses. A cell of convolutional layer is enhanced when the corresponding Pl+1 × Rl+1 region of the input layer is similar to the feature and suppressed otherwise. The non-linearity function f is defined using rectified linear units (ReLU) f(x) = max(x, 0) so that the regions of that are very different from have zero enhancement response in . Being applied in a sequence, i.e. , convolutional layers combine ensembles of simple features into more complicated hierarchies that efficiently capture the consistent appearance patterns of the depicted objects.
It can be observed that small changes in the kernels of the first convolutional layers will affect all subsequent layers and will be amplified as the network deepens. During training of CNNs, the kernel coefficients of the first layers will get saturated quickly, which will slow down network convergence. Ioffe and Szegedy [36] demonstrated that normalizing each layer reduces the probability of network saturation, makes training less sensitive to the selection of learning rate parameter and dramatically accelerates convergence. Thus, convolutional layer is augmented as:
| (2) |
where gbNorm normalize input features to zero mean and unit variance. Naturally, bias gets compensated during normalization and therefore can be removed.
In comparison to natural image analysis problems, where training images are easily accessible and require relatively short time for manual annotation, assembling databases of annotated medical three-dimensional (3D) images is very labor and time consuming and therefore such databases can hardly contain more than several hundred cases. The number of CNN parameters may be much higher than the number of training samples, which will lead to model overfitting and poor network performance on previously unseen images. To reduce overfitting, some network elements are randomly turned off during training [37] :
| (3) |
where is a matrix of the same size as containing random binary variables. Turning off some network elements prevents it from becoming highly restrictive.
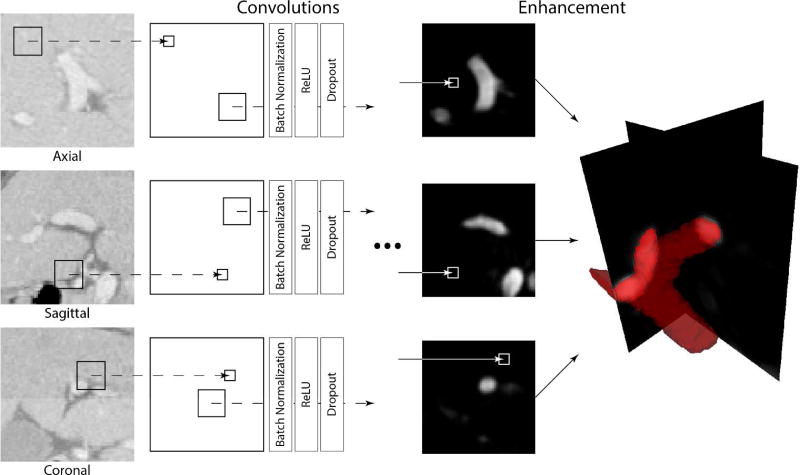
We define the CNN for PV enhancement using a sequence of four convolution-batch normalization-ReLU-dropout layers and the final convolutional layer with softmax activation function. As a result the network analyzes a square image region of size K × K and produces the segmentation of its internal area of size k × k. Similar approach has been shown effective on segmentation of brain tumors [38] and placenta [39]. To apply such CNN for PV enhancement from 3D CT images, we first train CNN on a database T of CT images with PVs annotated by an experienced clinician. The intensity patterns of PV make it distinguishable from other structures in the image. The trained CNN learn to extract these patterns and use them to enhance the vein in a new target image. Following the recent studies, combined two-dimensional (2D) CNNs trained on axial, sagittal and coronal patches exhibit similar performance to 3D CNNs, while 2D CNNs are less memory demanding and therefore more complex 2D networks can be used [40]. Portal vein enhancement is generated as a combination of axial, sagittal and coronal 2D CNNs (Fig. 2).
Figure 2.
A schematic illustration of the convolutional neural network (CNN) architecture used for enhancement of portal vein (PV) from CT images. Individual CNNs are applied on each orthogonal cross-section of the CT image in order to generate three PV enhancement maps. The maps are then averaged to form the resulting PV enhancement.
Although CNNs produce smooth enhancement map by simultaneously analyzing neighboring voxels, the results may still contain artifacts and isolated regions. We apply Markov Random Fields (MRFs) to additionally smoothen the enhancement results. For this aim, we describe the target image as a non-oriented graph 𝒢 = {𝒱, ℰ}, where vertices 𝒱 correspond to image voxels, and edges ℰ connect neighboring voxels. The MRFs optimally label 𝒢 by considering information about individual voxels – unary potentials, and neighboring voxels – binary potentials. If the CNN enhancement value for voxel y is 𝒫y, the unary potential of MRF for this voxel is ϕ(𝒫y, ly) = (if (ly == 1) then 1 − 𝒫y else 𝒫y), i.e. the cost for marking y as PV (ly == 1) is 1 − 𝒫y and marking y as background (ly == 0) is 𝒫y. The total cost for all unary potential is minimized when all voxels are labeled according to the CNN enhancement. The binary potential for neighboring voxels y and z is , where measures similarity between CNN enhancements 𝒫y and 𝒫z, and Δ(ly, lz) is an binary function that checks the identity of labels for y and z: Δ(ly, lz) = (if (ly == lz) then 0 else 1). The total cost for all binary potential is minimized when all voxels have the same label. The optimal labeling L of voxels 𝒱 in the target image is achieved by minimizing both unary and binary potentials:
| (4) |
By optimizing Equation 4, the CNN-based enhancement results are additionally smoothed and small groups of isolated mis-labeled voxels are removed. The optimization was very efficiently performed using publicly available software FastPD [41]. The final enhancement 𝒬 is the elementwise multiplication of CNN enhancement map 𝒫 and MRF label map L.
Centerline identification from CNN-based enhancement
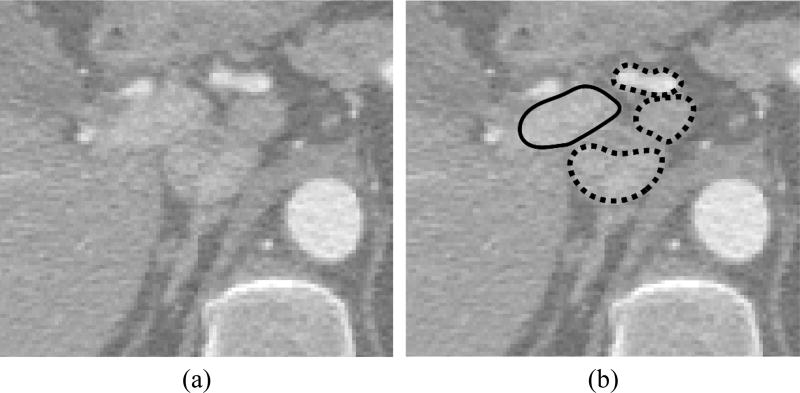
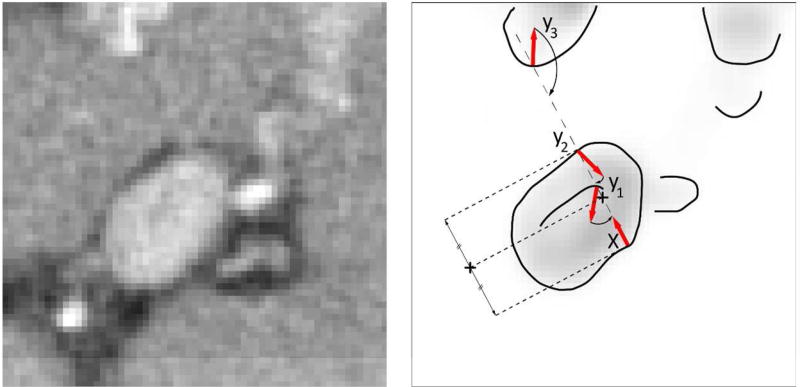
The proposed CNN+MRF-based algorithm will enhance not only PV but also structures that can be visually confused with PV (Fig. 3). Exclusion of such structures requires combined analysis of the appearance and anatomy of PV. We adopt the algorithm for center and centerline detection of anatomical structures that can be approximated with solids of revolution, e.g. vertebral bodies [42] and femoral heads [43]. Being a composition of tubular structures, a ray initialized at a PV surface point y and oriented according to the surface normal gy will meet another surface point z with normal gz oriented in the opposite direction |gy ∙ gz| ≈ −1 (Fig. 4). For every y, the location of the opposite point z can be obtained using the enhancement map 𝒬:
| (5) |
where ∇Qy and ‖∇Qy‖ are, respectively, the orientation and magnitude of the gradient computed at point y of the CNN enhancement map. Parameters Dmin and Dmax that represent the minimum and maximum diameter of PV define the searching domain for z. The local response for PV centerline detection is computed at the midpoint cy,z between y and z:
| (6) |
The local response A(cy,z) is higher for points that are likely to belong to the PV surface, i.e. with high gradient magnitudes ‖∇Qy‖ and ‖∇Qz‖, and with better congruence of gradient orientations |∇Qy ∙∇Qz| ≈ −1.
Figure 3.
An example of structures that are visually very similar to portal vein in (a) CT images and may be erroneously enhanced by convolutional neural networks. (b) The portal vein is outlined with solid line whereas neighboring similar structures with dashed lines.
Figure 4.
A schematic illustration of finding the portal vein centerline. Having a surface point x, i.e. a point with high magnitude of portal vein enhancement, meets three points y1, y2 and y3 that can potentially represent portal vein surface. Point y2 is selected as the optimal due to the high magnitude of its gradient and congruential gradient orientation against gradient of x
From the PV morphology, we can assume that a surface points y + Δy located close to y have the opposite points z + Δz with the distance d(y + Δy, z + Δz) similar to d(y, z). Moreover, the midpoints cy,z and cy+Δy,z+Δz for lines connecting the opposite points y and z, and y + Δy and z + Δz, respectively, will be located close to each other. We therefore detect PV centerline by accumulating the local responses (Eq. 6) for all points y and z:
| (7) |
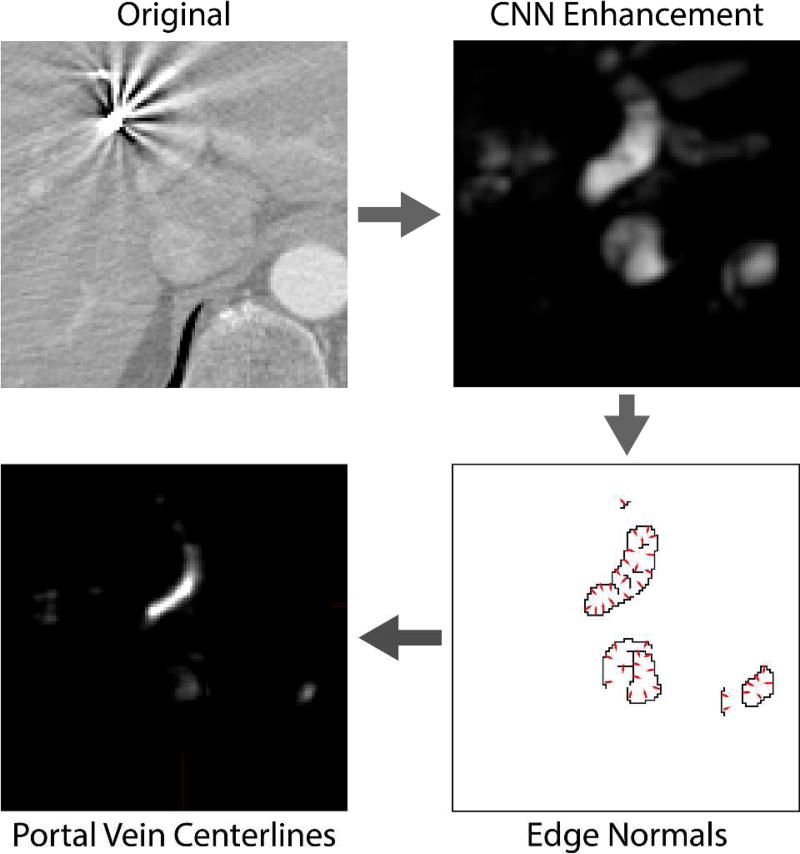
where P serves to skip points with low gradient magnitude ‖∇Qy‖, i.e. the points that do not likely represent PV surface being located inside homogenous regions of the enhancement map 𝒬. The PV centerline is the largest connected component in the response accumulation map A (Fig. 5).
Figure 5.
A schematic illustration of portal vein (PV) centerline detection. The original image is first analyzed by convolutional neural networks for enhancement of PV. To remove wrongly enhanced structures with the appearance similar to PV, we compute the locations where gradients computed on enhancement map mainly intersect. As PV can be roughly approximated with a set of tubular structures, the gradients on its surface intersect in the centerline of the PV.
Anatomy-based segmentation of portal vein
We combine the CNN+MRF-based enhancement map 𝒬 with centerline map A to segment the PV in the target image. For a point y of the PV centerline, the surrounding enhanced region is expected to belong to the PV. At the same time, other parts of the liver vasculature can be located close to PV and therefore may be erroneously included into segmentation (Fig. 3). We avoided such inclusion by estimating the partial radius of PV at point y:
| (8) |
where g is an orientation vector. The optimal radius is computed at the point with high magnitude ‖∇Qgr+y‖ of the enhancement map gradient, and gradient orientation ∇Qgr+y towards centerline point y. The average value of all partial radii at the point y for different directions g defines the PV radius at the point y:
| (9) |
where G is the set of all orientation vectors. Having radii along the PV centerline allows us to effectively identify and exclude liver vessels located close to the PV. The points inside the sphere with radius ry + Δr and center y are labeled as PV if the enhancement value is above 0.5 of the most enhanced point inside the sphere. The resulting labeling represent segmentation of the PV in the target image.
Experiments and Results
Image database
We have collected a database of 72 CT images of patients who underwent SBRT for treating liver metastases (37 cases), hepatocellular carcinoma (17 cases) and cholangiocarcinoma (14 cases) and other types of liver primary cancer (4 cases). The images were pre-selected from a collection of liver SBRTs administered at Stanford Medical Center from July 2004 to November 2015. The selection criteria was solely the level of contrast agent, which made at least a part of PV visually distinguishable for an experienced human observer. The presence of fiducial markers, stents and image artifacts was not considered a disqualifying factor. All images were axially reconstructed between 0.879 and 1.523 mm with the scan matrix of 512 × 512, and the slice thickness between 0.80 and 2.50 mm. The target organ of interest was anatomically defined as the PV between splenic confluence to the first bifurcation of the left and right PV branches. In all selected image, the level of contrast agent allowed visual identification of the PV or its parts by a human observer. All PVs were manually segmented by an experienced oncologist using MIM Software version 6.5 (MIM Software Inc., Cleveland, OH).
Implementation
The proposed framework was implemented in C++ and C# without code optimization, and executed on a personal computer with Intel Core i7 processor at 4.0 GHz and 32 GB of memory. The framework employed two publicly available toolboxes, including Computational Network Toolkit (CNTK) [44] for CNN training and execution and FastPD [41] for MRF-based enhancement smoothing. The NVIDIA GeForce GTX Titan X graphical processing unit (GPU) with 12 GB of memory was used by CNTK for CNN operation. During the training phase, generating an individual CNN took 35 min. During the segmentation phase, running CNN for PV enhancement took around 35 sec, MRF-based smoothing took less than 1 sec and anatomy-based segmentation took around 4 sec.
Segmentation Results
All images were separated into eight folders with nine images for eight-fold cross-validation, where, for example, segmentation of image with number 38 was based on networks trained on images with numbers 1–36 and 46–72. For CNN training, we randomly extracted 30000 samples from each training CT image, i.e. 10000 axially, 10000 coronally and 10000 sagittally oriented patches, of 41 × 41 mm size with the corresponding segmentation of 29 × 29 mm size. An input patch passes through 17-layer CNN containing four convolutional layers, where first two layers had the filter size of 4 × 4 and the last three layers have the filter size of 3 × 3. The number of filters per convolutional layer equals 40, excluding the last convolution layer with one filter for generation of the enhancement results. We ensured that 50% of all training samples cover at least one voxel of PV, i.e. there is at least a single non-zero element in the corresponding segmentation matrix, in order to avoid CNNs learning only on background voxels. Training was performed using the stochastic gradient descent scheme and having learning rate of 0.005 and momentum of 0.9. The dropout rate was set to 0.2 meaning that every matrix in average contains and randomly positioned zeros and ones, respectively. All training sample were automatically separated into batches of 500 samples and analyzed in 20 epochs, i.e. training runs 20 times through all samples. No measurable improvement was observed when increasing the number of epochs. The minimum and maximum radii of PV were defined as Dmin = 4 mm and Dmax = 15 mm for PV centerline detection. The parameter that balances the contribution of unary and binary potentials in MRF was set to be α = 5. The maximum number of iterations for MRF was set to be 50.
The performance of PV segmentation was evaluated by computing Dice coefficient (DSC) and the mean symmetric surface distance (MSSD) η between manual and automatic segmentation masks. Dice coefficient is defined as DSC = 2TP/(2TP + FN + FP), where TP is the number voxels classified as PV in both manual and automated segmentation, FN is the number of PV voxels misclassified as background by automated segmentation and FP is the number of background voxels misclassified as PV by automated segmentation. The MSSD is computed as:
| (10) |
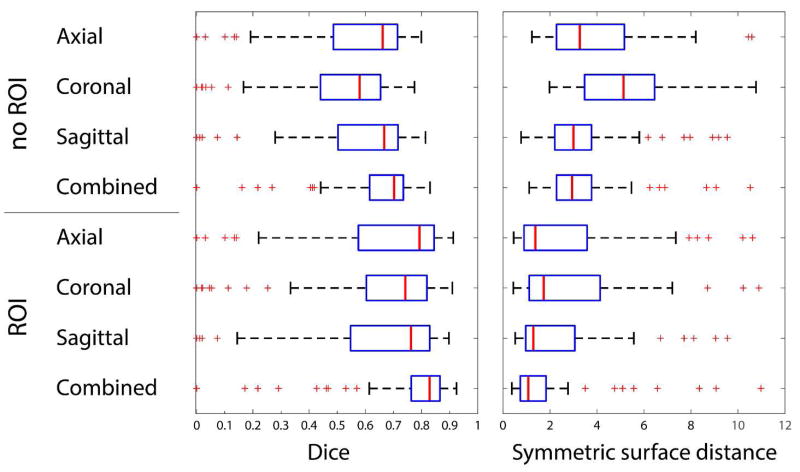
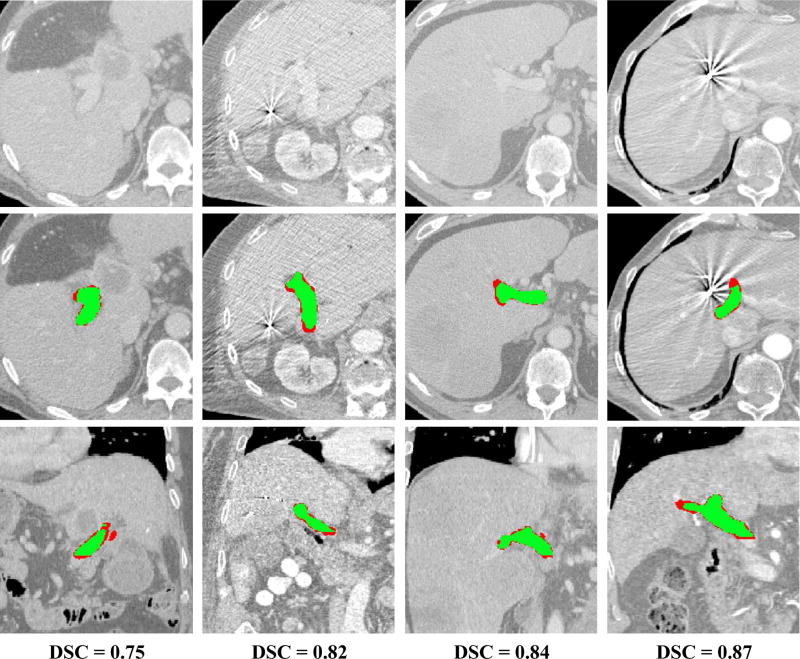
where Sman and Sauto are, respectively, the surface voxels for manual and automatic segmentation masks, ds,S is the distance between voxel s and the set of voxels S. Both error metrics were computed for segmentation using single axial, sagittal and coronal networks and combined axial-sagittal-coronal approach. Finally, we evaluated the segmentation performance when automated segmentation is restricted to the cuboid-shape region of interest (ROI) that is extracted from the corresponding manual segmentation. The goal of the ROIs is to separate segmentation error, where non-PV structures marked as PV, from over-segmentation of PV branches, where CNN enhances PV along its branches. For all 72 CT images, the median Dice coefficient was DSC = 0.70 and MSSD η = 2.94 mm for the combined axial-sagittal -coronal CNNs with no ROI, and the median Dice coefficient was DSC = 0.83 and MSSD η = 1.08 mm for the combined axial-sagittal-coronal CNNs with manual ROI. Figure 6 summarizes the performance of the proposed framework with different settings, while Figure 7 shows segmentation results for several selected cases.
Figure 6.
Results of portal vein segmentation from CT images given in terms of Dice and symmetric surface distance. The results are computed using axial, coronal, sagittal and combined CNNs and with or without a predefined region of interest. Manual regions of interest (ROIs) restrict the area where the portal vein is searched for. The ROIs serve to exclude the disagreement between manual and automated segmentations originated from vaguely defined borders of the PV region important for radiotherapy planning. The disagreement, which cannot be straightforwardly considered as an error, occurs when manual segmentation stops at a specific branch point, whereas CNN continues enhancing PV along the branch.
Figure 7.
Examples of segmentation results for four cases from the database. The results are shown in comparison to the original CT images (first raw) using axial (second raw) and coronal (third raw) cross-sections with segmentations. The Dice coefficient for each case is given in the fourth raw. The overlap between manual and automatic segmentation is colored in green, and mis-segmentations are colored in red.
Discussion
To the best of our knowledge, we presented the first attempt to segment PV from CT images using CNNs and PV anatomy features. Convolutional neural networks have demonstrated success on natural image analysis and dramatically outperform alternative machine learning algorithms [45]. In the field of medical imaging, CNNs won a challenge on brain structure segmentation [46] but, at the same, demonstrated moderate results on intervertebral disc segmentation challenge [47]. The CNNs performance considerably improves on structures with well-defined shape when CNNs are combined with statistical object models [48]. Although PV is a highly flexible object with no predefined shape, its anatomy, thickness and local tubularity can be used to distinguish PV from the surrounding structures with similar appearance. We detected the PV centerline from CNN-based enhancement by modifying the algorithm for vertebral body [42], femoral head [43] and human brain detection [49]. The resulting framework was successfully validated on a database of CT images of patients who underwent liver SBRT.
Segmentation of PV is an underinvestigated problem and, for the best of our knowledge, there is no publication with the similar settings that would allow us to directly compare the obtained results. Nevertheless, Bruyninckx et al. [28] segmented the whole portal vein including peripheral branches and obtained Dice coefficient from 0.53 to 0.68. Recently, Goceri et al. [31] reported Dice coefficient from 0.51 to 0.62 for segmentation of portal vein from MR images. The previous work emphasized that PV segmentation is compromised by image noise and the presence of hepatic arteries and other veins. Zeng et al. [27] has recently demonstrated the potential of single-layer neural networks for enhancement of liver vessels. As their work remains the only attempt of applying neural network for liver vasculature segmentation, our framework is novel and pioneers the usage of CNNs for liver vasculature segmentation. The CNNs has demonstrated promising results on medical images including segmentation of brain structures [46], [50] and OARs for head-and-neck radiotherapy [49]. As 3D CNNs usually require larger database and are more memory-demanding, we used a combination of 2D cross-sectional CNNs that are shown to produce accurate segmentation results [40]. The output of our CNNs is not a single value that corresponds to the enhancement of the central voxel of the 41 × 41 mm input patch but the enhancement map of 29 × 29 mm. If the single enhancement value-based architecture, commonly adopted in computer vision [45], require a CNN to process n3 patches to generate segmentation of n × n × n image, the proposed architecture allow skipping of image voxels and may reduce the number of the processed patches to for the same image size. For 3D images, the number of analyzed patches is such that each voxel is enhanced by each axial, sagittal and coronal CNN at least once.
The dramatic success of CNNs in computer vision is due to their ability to extract the distinctive appearance patters of natural objects of the same class even if the objects look very different [45]. In medical imaging, voxels that belong to the target organ usually have much more similar appearance but, at the same time, voxels of other organs and background may be very similar to the target organ too. The CNNs may therefore enhance voxels of arteries, other veins and vessel-like structures located near the PV. The appearance of such structures is very similar (Fig. 3) and the PV anatomy analyze is required. We relied on tubularity of the PV and detected its centerline by accumulating PV surface normals. The PV centerlines were correctly detected even when PV enhancement was inconsistent due to image artifacts and contrast variability. The combination of CNNs and the anatomy model addresses the main challenge of PV segmentation, i.e. distinguishing it from the surrounding structures with similar to PV appearance. In particular, vessels of similar to PV size located outside the liver and thin vessels located inside the liver would be enhanced less that PV. The structures with similar to PV appearance inside the liver are shorter and do not have inconsistent positioning, and therefore will not have a connected centerline comparable in length to the centerline of PV. Combining machine learning with sophisticated shape models is shown to result in accurate segmentation for vertebra, corpus callosum and prostate [48], [51], [52], but cannot be straightforwardly applied for PV segmentation, as PV has highly variable shape and non-standard confluence of branches. We proposed an accurate, robust and computationally efficient approach for segmentation of enhanced PV.
The reference manual PV segmentation was generated by an experienced oncologists in the slice-by-slice manner so the margins where segmentation stops may slightly vary from image to image. The same or different specialist will most likely continue segmenting along the vein branches for a number of image cross-sections or stop earlier and do not segment a number of image cross-sections. Such segmentation variability reduces Dice coefficient but does not necessarily represent an error because it still allows to correctly estimate the radiation dose delivered to PV. Moreover, PV outside the liver may not receive any radiation during the treatment and therefore its over-segmentation towards pancreas may have no effect on dose/volume metrics calculation. To remove the error originated from subjective PV under- and over-segmentation along branches, we restricted automated PV segmentation with the ROIs computed from manual PV segmentation. The ROIs allow distinguishing the segmentation disagreement originated from expanded branches from the actual segmentation error. It is important to note that CNNs do not enhance vasculature located far away from the liver region. This observation suggests that not only the appearance of the PV is modeled but also the appearance of the surrounding liver tissue. Indeed, the PV is surrounded by a relatively homogeneous liver tissue, and there is no other vessel in the abdominal region with the similar surrounding. Moreover, the CNNs do not enhance vessels located deeper inside the liver because they are thinner than PV and therefore have different appearance.
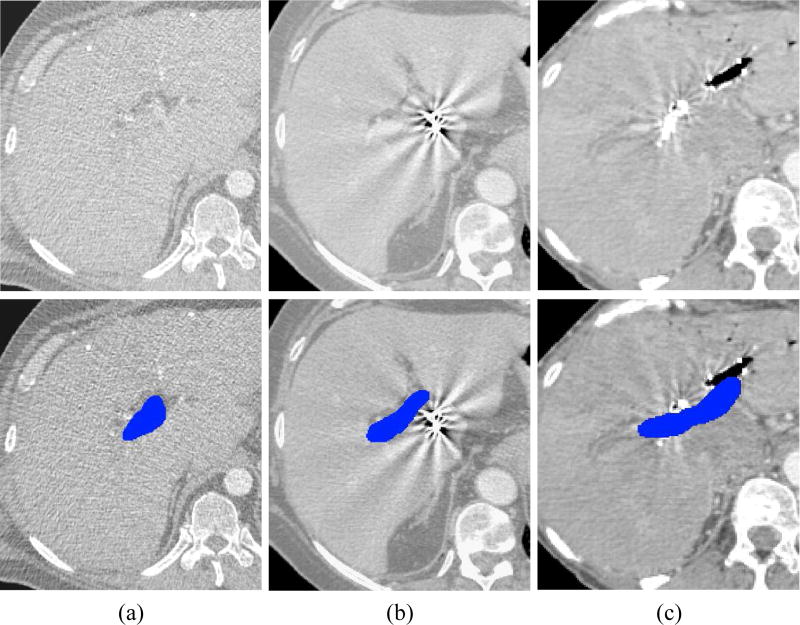
By validating the proposed framework on a clinical database of 72 CT images, we achieved segmentation accuracy of median DSC = 0.83 and MSSD η = 1.08 mm, when segmentations are restricted with ROIs. Despite generally accurate segmentation results, a number of outliers with poor segmentations has been observed mainly because of the following conditions. First, a low level of contrast made PV poorly visible and therefore difficult to enhance and segment (Fig. 8a). Second, fiducial markers positioned inside the liver for better treatment planning generate ray-like image artifacts that may severely distort the appearance of the surrounding structures including PV (Fig. 8b). Finally, the traces of vasculature interventions, e.g. stents, may dramatically reduce visibility of PV (Fig. 8c). Nevertheless, we conclude that the framework can accurately and robustly segment PV for almost all of the observed cases.
Figure 8.
Examples of (top) CT images with (bottom) the corresponding manual segmentations of portal vein (blue) that are challenging to segment automatically. (a) Example of low level of contrast agent. (b) Example of strong image artifacts originated from fiducial markers. (c) Example of vasculature stent.
Conclusion
In this paper, we presented a novel CNN framework for segmentation of PV from CT images. The performance was validated on a clinical database of images of liver SBRT patients. The obtained results are accurate considering the complexity of the problem, presence of image artifacts and natural variability of PV appearance. The study show the potential of using CNN with anatomy analysis to facilitate liver RT planning in the future.
Acknowledgments
This work was partially supported by NIH (1R01 CA176553 and EB016777), and Google and Varian research grants.
References
- 1.Siegel RL, Miller KD, Jemal A. Cancer Statistics, 2017. CA. Cancer J. Clin. 2017 Jan;67(1):7–30. doi: 10.3322/caac.21387. [DOI] [PubMed] [Google Scholar]
- 2.Høyer M, et al. Radiotherapy for liver metastases: a review of evidence. Int. J. Radiat. Oncol. Biol. Phys. 2012 Mar;82(3):1047–1057. doi: 10.1016/j.ijrobp.2011.07.020. [DOI] [PubMed] [Google Scholar]
- 3.Lee MT, et al. Phase I study of individualized stereotactic body radiotherapy of liver metastases. J. Clin. Oncol. Off. J. Am. Soc. Clin. Oncol. 2009 Apr;27(10):1585–1591. doi: 10.1200/JCO.2008.20.0600. [DOI] [PubMed] [Google Scholar]
- 4.Toesca DAS, et al. Central liver toxicity after SBRT: An expanded analysis and predictive nomogram. Radiother. Oncol. 2016 Nov; doi: 10.1016/j.radonc.2016.10.024. [DOI] [PubMed] [Google Scholar]
- 5.Osmundson EC, Wu Y, Luxton G, Bazan JG, Koong AC, Chang DT. Predictors of toxicity associated with stereotactic body radiation therapy to the central hepatobiliary tract. Int. J. Radiat. Oncol. Biol. Phys. 2015 Apr;91(5):986–994. doi: 10.1016/j.ijrobp.2014.11.028. [DOI] [PubMed] [Google Scholar]
- 6.Lesage D, Angelini ED, Bloch I, Funka-Lea G. A review of 3D vessel lumen segmentation techniques: Models, features and extraction schemes. Med. Image Anal. 2009 Dec;13(6):819–845. doi: 10.1016/j.media.2009.07.011. [DOI] [PubMed] [Google Scholar]
- 7.Frangi AF, Niessen WJ, Vincken KL, Viergever MA. Multiscale vessel enhancement filtering. Medical Image Computing and Computer-Assisted Intervention — MICCAI’98. 1998:130–137. [Google Scholar]
- 8.Soares JVB, Leandro JJG, Cesar Júnior RM, Jelinek HF, Cree MJ. Retinal vessel segmentation using the 2-D Gabor wavelet and supervised classification. IEEE Trans. Med. Imaging. 2006 Sep;25(9):1214–1222. doi: 10.1109/tmi.2006.879967. [DOI] [PubMed] [Google Scholar]
- 9.Gang L, Chutatape O, Krishnan SM. Detection and measurement of retinal vessels in fundus images using amplitude modified second-order Gaussian filter. IEEE Trans. Biomed. Eng. 2002 Feb;49(2):168–172. doi: 10.1109/10.979356. [DOI] [PubMed] [Google Scholar]
- 10.Palomera-Pérez MA, Martinez-Perez ME, Benítez-Pérez H, Ortega-Arjona JL. Parallel Multiscale Feature Extraction and Region Growing: Application in Retinal Blood Vessel Detection. IEEE Trans. Inf. Technol. Biomed. 2010 Mar;14(2):500–506. doi: 10.1109/TITB.2009.2036604. [DOI] [PubMed] [Google Scholar]
- 11.Kaftan JN, Tek H, Aach T. A two-stage approach for fully automatic segmentation of venous vascular structures in liver CT images. 2009;7259:725911–725911–12. [Google Scholar]
- 12.Bankhead P, Scholfield CN, McGeown JG, Curtis TM. Fast Retinal Vessel Detection and Measurement Using Wavelets and Edge Location Refinement. PLOS ONE. 2012 Mar;7(3):e32435. doi: 10.1371/journal.pone.0032435. [DOI] [PMC free article] [PubMed] [Google Scholar]
- 13.Kawajiri S, et al. Automated segmentation of hepatic vessels in non-contrast X-ray CT images. Radiol. Phys. Technol. 2008 Jul;1(2):214–222. doi: 10.1007/s12194-008-0031-4. [DOI] [PubMed] [Google Scholar]
- 14.Freiman M, Joskowicz L, Sosna J. A variational method for vessels segmentation: algorithm and application to liver vessels visualization. SPIE Medical Imaging. 2009:72610H–72610H. [Google Scholar]
- 15.Foruzan AH, Zoroofi RA, Sato Y, Hori M. A Hessian-based filter for vascular segmentation of noisy hepatic CT scans. Int. J. Comput. Assist. Radiol. Surg. 2012 Mar;7(2):199–205. doi: 10.1007/s11548-011-0640-y. [DOI] [PubMed] [Google Scholar]
- 16.Luu HM, Klink C, Moelker A, Niessen W, van Walsum T. Quantitative evaluation of noise reduction and vesselness filters for liver vessel segmentation on abdominal CTA images. Phys. Med. Biol. 2015;60(10):3905. doi: 10.1088/0031-9155/60/10/3905. [DOI] [PubMed] [Google Scholar]
- 17.Friedman J, Hastie T, Tibshirani R. Sparse inverse covariance estimation with the graphical lasso. Biostatistics. 2008 Jul;9(3):432–441. doi: 10.1093/biostatistics/kxm045. [DOI] [PMC free article] [PubMed] [Google Scholar]
- 18.Chi Y, et al. Segmentation of Liver Vasculature From Contrast Enhanced CT Images Using Context-Based Voting. IEEE Trans. Biomed. Eng. 2011 Aug;58(8):2144–2153. doi: 10.1109/TBME.2010.2093523. [DOI] [PubMed] [Google Scholar]
- 19.Shang Q, Clements L, Galloway RL, Chapman WC, Dawant BM. Adaptive directional region growing segmentation of the hepatic vasculature. 2008;6914:69141F–69141F–10. [Google Scholar]
- 20.Sboarina A, et al. Software for hepatic vessel classification: feasibility study for virtual surgery. Int. J. Comput. Assist. Radiol. Surg. 2010 Jan;5(1):39–48. doi: 10.1007/s11548-009-0380-4. [DOI] [PubMed] [Google Scholar]
- 21.Wang Y, Fang B, Pi J, Wu L, Wang PSP, Wang H. Automatic multi-scale segmentation of intrahepatic vessel in ct images for liver surgery planning. Int. J. Pattern Recognit. Artif. Intell. 2013 Jan;27(01):1357001. [Google Scholar]
- 22.Oliveira DA, Feitosa RQ, Correia MM. Segmentation of liver, its vessels and lesions from CT images for surgical planning. Biomed. Eng. OnLine. 2011;10:30. doi: 10.1186/1475-925X-10-30. [DOI] [PMC free article] [PubMed] [Google Scholar]
- 23.Shang Y, et al. Vascular Active Contour for Vessel Tree Segmentation. IEEE Trans. Biomed. Eng. 2011 Apr;58(4):1023–1032. doi: 10.1109/TBME.2010.2097596. [DOI] [PubMed] [Google Scholar]
- 24.Cheng Y, Hu X, Wang J, Wang Y, Tamura S. Accurate vessel segmentation with constrained B-snake. IEEE Trans. Image Process. Publ. IEEE Signal Process. Soc. 2015 Aug;24(8):2440–2455. doi: 10.1109/TIP.2015.2417683. [DOI] [PubMed] [Google Scholar]
- 25.Bauer C, Pock T, Sorantin E, Bischof H, Beichel R. Segmentation of interwoven 3d tubular tree structures utilizing shape priors and graph cuts. Med. Image Anal. 2010 Apr;14(2):172–184. doi: 10.1016/j.media.2009.11.003. [DOI] [PubMed] [Google Scholar]
- 26.Wang G, Zhang S, Li F, Gu L. A new segmentation framework based on sparse shape composition in liver surgery planning system. Med. Phys. 2013 May;40(5):n/a–n/a. doi: 10.1118/1.4802215. [DOI] [PMC free article] [PubMed] [Google Scholar]
- 27.Zeng YZ, Zhao YQ, Liao M, Zou BJ, Wang XF, Wang W. Liver vessel segmentation based on extreme learning machine. Phys. Med. 2016 May;32(5):709–716. doi: 10.1016/j.ejmp.2016.04.003. [DOI] [PubMed] [Google Scholar]
- 28.Bruyninckx P, Loeckx D, Vandermeulen D, Suetens P. Segmentation of liver portal veins by global optimization. SPIE Medical Imaging. 2010:76241Z–76241Z. [Google Scholar]
- 29.Esneault S, Lafon C, Dillenseger J-L. Liver vessels segmentation using a hybrid geometrical moments/graph cuts method. IEEE Trans. Biomed. Eng. 2010 Feb;57(2):276–283. doi: 10.1109/TBME.2009.2032161. [DOI] [PMC free article] [PubMed] [Google Scholar]
- 30.Goceri E. Automatic labeling of portal and hepatic veins from MR images prior to liver transplantation. Int. J. Comput. Assist. Radiol. Surg. 2016 Dec;11(12):2153–2161. doi: 10.1007/s11548-016-1446-8. [DOI] [PubMed] [Google Scholar]
- 31.Goceri E, Shah ZK, Gurcan MN. Vessel segmentation from abdominal magnetic resonance images: adaptive and reconstructive approach. Int. J. Numer. Methods Biomed. Eng. 2017 Apr;33(4):n/a–n/a. doi: 10.1002/cnm.2811. [DOI] [PubMed] [Google Scholar]
- 32.Lee W-K, et al. Imaging assessment of congenital and acquired abnormalities of the portal venous system. Radiogr. Rev. Publ. Radiol. Soc. N. Am. Inc. 2011 Aug;31(4):905–926. doi: 10.1148/rg.314105104. [DOI] [PubMed] [Google Scholar]
- 33.Pamulapati V, Wood BJ, Linguraru MG. Intra-hepatic vessel segmentation and classification in multiphase CT using optimized graph cuts. 2011 IEEE International Symposium on Biomedical Imaging: From Nano to Macro. 2011:1982–1985. [Google Scholar]
- 34.Kang X, Zhao Q, Sharma K, Shekhar R, Wood BJ, Linguraru MG. Automatic labeling of liver veins in CT by probabilistic backward tracing. 2014 IEEE 11th International Symposium on Biomedical Imaging (ISBI) 2014:1115–1118. [Google Scholar]
- 35.Lehmann KS, et al. Portal Vein Segmentation of a 3D-Planning System for Liver Surgery—In vivo Evaluation in a Porcine Model. Ann. Surg. Oncol. 2008 Jul;15(7):1899. doi: 10.1245/s10434-008-9934-x. [DOI] [PubMed] [Google Scholar]
- 36.Ioffe S, Szegedy C. Batch Normalization: Accelerating Deep Network Training by Reducing Internal Covariate Shift. ArXiv150203167 Cs. 2015 Feb; [Google Scholar]
- 37.Srivastava N, Hinton G, Krizhevsky A, Sutskever I, Salakhutdinov R. Dropout: A Simple Way to Prevent Neural Networks from Overfitting. J. Mach. Learn. Res. 2014;15:1929–1958. [Google Scholar]
- 38.Kamnitsas K, et al. Efficient multi-scale 3D CNN with fully connected CRF for accurate brain lesion segmentation. Med. Image Anal. 2017 Feb;36:61–78. doi: 10.1016/j.media.2016.10.004. [DOI] [PubMed] [Google Scholar]
- 39.Alansary A, et al. Fast Fully Automatic Segmentation of the Human Placenta from Motion Corrupted MRI. Medical Image Computing and Computer-Assisted Intervention – MICCAI 2016. 2016:589–597. [Google Scholar]
- 40.Lai M. Deep Learning for Medical Image Segmentation. ArXiv150502000 Cs. 2015 May; [Google Scholar]
- 41.Komodakis N, Tziritas G. Approximate Labeling via Graph Cuts Based on Linear Programming. IEEE Trans. Pattern Anal. Mach. Intell. 2007 Aug;29(8):1436–1453. doi: 10.1109/TPAMI.2007.1061. [DOI] [PubMed] [Google Scholar]
- 42.Stern D, Likar B, Pernus F, Vrtovec T. Automated detection of spinal centrelines, vertebral bodies and intervertebral discs in CT and MR images of lumbar spine. Phys. Med. Biol. 2010 Jan;55(1):247–264. doi: 10.1088/0031-9155/55/1/015. [DOI] [PubMed] [Google Scholar]
- 43.Ibragimov B, Likar B, Pernuš F, Vrtovec T. Automated measurement of anterior and posterior acetabular sector angles. 2012;8315:83151U–83151U–7. [Google Scholar]
- 44.Agarwal A, et al. An Introduction to Computational Networks and the Computational Network Toolkit. Microsoft Tech. Rep. MSR-TR-2014-112. :2014. [Google Scholar]
- 45.Russakovsky O, et al. ImageNet Large Scale Visual Recognition Challenge. Int. J. Comput. Vis. 2015 Apr;115(3):211–252. [Google Scholar]
- 46.Maier O, et al. ISLES 2015 - A public evaluation benchmark for ischemic stroke lesion segmentation from multispectral MRI. Med. Image Anal. 2017 Jan;35:250–269. doi: 10.1016/j.media.2016.07.009. [DOI] [PMC free article] [PubMed] [Google Scholar]
- 47.Zheng G, et al. Evaluation and comparison of 3D intervertebral disc localization and segmentation methods for 3D T2 MR data: A grand challenge. Med. Image Anal. 2017 Jan;35:327–344. doi: 10.1016/j.media.2016.08.005. [DOI] [PubMed] [Google Scholar]
- 48.Korez R, Likar B, Pernuš F, Vrtovec T. Model-Based Segmentation of Vertebral Bodies from MR Images with 3D CNNs. Medical Image Computing and Computer-Assisted Intervention – MICCAI 2016. 2016:433–441. [Google Scholar]
- 49.Ibragimov B, Xing L. Segmentation of organs-at-risks in head and neck CT images using convolutional neural networks. Med. Phys. 2017 Feb;44(2):547–557. doi: 10.1002/mp.12045. [DOI] [PMC free article] [PubMed] [Google Scholar]
- 50.Menze BH, et al. The Multimodal Brain Tumor Image Segmentation Benchmark (BRATS) IEEE Trans. Med. Imaging. 2015 Oct;34(10):1993–2024. doi: 10.1109/TMI.2014.2377694. [DOI] [PMC free article] [PubMed] [Google Scholar]
- 51.Korez R, Ibragimov B, Likar B, Pernuš F, Vrtovec T. A Framework for Automated Spine and Vertebrae Interpolation-Based Detection and Model-Based Segmentation. IEEE Trans. Med. Imaging. 2015 Aug;34(8):1649–1662. doi: 10.1109/TMI.2015.2389334. [DOI] [PubMed] [Google Scholar]
- 52.Ibragimov B, Korez R, Likar B, Pernus F, Xing L, Vrtovec T. Segmentation of Pathological Structures by Landmark-Assisted Deformable Models. IEEE Trans. Med. Imaging. 2017;(99):1–1. doi: 10.1109/TMI.2017.2667578. vol. PP. [DOI] [PubMed] [Google Scholar]


