Abstract
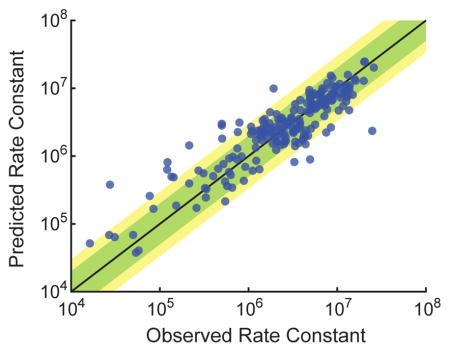
Hybridization is a key molecular process in biology and biotechnology, but to date there is no predictive model for accurately determining hybridization rate constants based on sequence information. Here we report a weighted neighbor voting (WNV) prediction algorithm, in which the hybridization rate constant of an unknown sequence is predicted based on similarity reactions with known rate constants. To construct this algorithm we first performed 210 fluorescence kinetics experiments to observe the hybridization kinetics of 100 different DNA target and probe pairs (36nt subsequences of the CYCS and VEGF genes) at temperatures ranging from 28°C to 55°C. Automated feature selection and weighting optimization resulted in a final 6-feature WNV model, which can predict hybridization rate constants of new sequences to within a factor of 3 with ≈91% accuracy, based on leave-one-out cross-validation. Accurate prediction of hybridization kinetics allows design of efficient probe sequences for genomics research.
Graphical abstract
Hybridization of complementary DNA and RNA sequences is a fundamental molecular mechanism that underlies both biological processes [1–3] and nucleic acid analytic biotechnologies [4–7]. The thermodynamics of hybridization have been well-studied, and algorithms based on the nearest-neighbor model of base stacking [8, 9] predicts minimum free energy structures and melting temperatures [10, 11] with reasonably good accuracy. In contrast, the kinetics of hybridization remain poorly understood, and to date no models or algorithms have been reported that accurately predict hybridization rate constants from sequence and reaction conditions (temperature, salinity). This knowledge deficiency has adversely impacted the research community by requiring either trial-and-error optimization of DNA primer and probe sequences for new genetic regions of interest, or brute-force use of thousands of DNA probes for target enrichment.
Predictive modeling of hybridization kinetics faces two main challenges. First, there is a very limited number of DNA sequences whose kinetics have been characterized directly, either in bulk solution [12–16] or at the single-molecule level [17–19]. The primary reason for the lack of data is the cost of fluorophore-functionalized DNA oligonucleotides, which at roughly $200 per sequence becomes prohibitive for the hundreds of experiments needed to establish sequence generality. Second, the hybridization of complementary sequences can follow many different pathways [15], rendering simple reaction models inaccurate for a large fraction of DNA sequences.
To create a sufficiently representative and sequence-general dataset for developing a predictive model of hybridization kinetics, we experimentally characterized the kinetics of 210 individual hybridization reactions on 100 different pairs of complementary sequences. We were able to do this economically through the use of the X-probe architecture, in which universal fluorophore- and quencher-functionalized oligonucleotides are recycled across many different experiments.
From our experimental data, we observed three unexpected findings: (1) most hybridization reactions do not asymptotically reach more than 90% yield, (2) initial hybridization kinetics is generally uncorrelated with asymptotic yield, and (3) secondary structure in the middle of a DNA target sequence tends to more adversely affect hybridization kinetics. Additionally, we observed that structure-free DNA target/probe sequences generally tended to have faster hybridization kinetics, consistent with literature and our expectations, but even structure-free sequences exhibited more than 1 order of magnitude of variation in hybridization rate constants.
Based on our experimental data, we constructed a new type of algorithm for predicting DNA hybridization rate constants based on target/probe sequence, called Weighted Neighbor Voting (WNV). In WNV, each hybridization reaction is mapped to a set of bioinformatic feature values, and can be considered a point in the high-dimensional feature space. Two hybridization reactions that are close in feature space are expected to exhibit similar kinetics. The rate constant of an unknown hybridization reaction is predicted based on the weighted average of observed rate constants of experimentally tested reactions, with weights dropping exponentially for reactions that are farther away in feature space. Under leave-one-out (LOO) cross-validation, our final WNV model predicts rate constants to within a factor of 2 for 80% of reactions, and within a factor of 3 for 91%. Next-generation sequencing (NGS) studies show a significant correlation (R2 ≈ 0.6) between the rate constants of DNA hybridization in single-plex vs. multiplex, suggesting that the current work is a good starting point for rational design and selection of DNA probes for highly multiplexed applications, such as target enrichment from genomic DNA [6].
Experimental Results
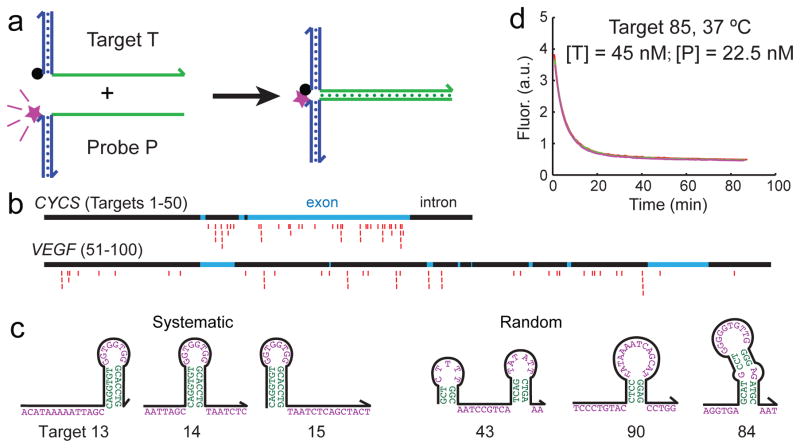
To systematically but economically characterize the hybridization kinetics of many different sequences, we used the X-Probe architecture [22] that employ universal fluorophore and quencher-labeled oligonucleotides (Fig. 1a). A universal fluorophore-labeled oligonucleotide was pre-hybridized to the probe, and a universal quencher-labeled oligonucleotide was pre-hybridized to the target. When the target and the probe solutions were mixed, the solution fluorescence was initially high because the fluorophore was delocalized from the quencher, but dropped over time as the hybridization reaction proceeds. The solution fluorescence at any given time can thus be linearly mapped to the instantaneous hybridization reaction yield.
FIG. 1.
Experimental characterization of hybridization kinetics. (a) Fluorescent probes with universal functionalized oligonucleotides. The blue regions show universal sequences, and the green regions show the variable regions corresponding to the target or probe sequence. Fluorescence is initially high, and decreases as the hybridization reaction proceeds because the fluorophore (purple star) becomes localized to the quencher (black dot). (b) 100 different subsequences of the CYCS and VEGF genes were selected to be the target sequences. In this study, all target and probe sequences are 36 nt long (excluding universal regions). 25 targets for each gene were chosen randomly with uniform distribution across the entire intron and exon region, and the other 25 targets were selected as close overlapping frames to systematically test the position effects of secondary structures. Red markers denote the subsequences of the genes selected as targets. (c) Examples of secondary structures encountered in target sequences. Shown are predicted minimum free energy (mfe) structures predicted for the target sequences at 37°C. See Supplementary Table ST1 for sequences of the 100 targets. (d) Example kinetic traces (triplicate) of a hybridization reaction. All reactions proceeded in 5x PBS buffer. See Supplementary Section 1 for reproducibility studies, and Supplementary Section 2 for fluorescence traces for all 210 experiments.
We selected as targets 100 subsequences of the CYCS and VEGF genes, each target subsequence being 36 nucleotides (nt) long. Of the 50 targets for each gene, 25 of them were selected randomly with uniform position distribution across the gene, and the other 25 were selected systematically so that the effects of secondary structure position could be examined (Fig. 1bc).
Fig. 1d shows triplicate kinetics traces for one hybridization reaction. A total of 210 hybridization experiments were characterized (100 reactions at 37°C, 96 at 55°C, 7 at 28°C, and 7 at 46°C). There was very low experimental error in our fluorescence experiments; all triplicate data points agreed with each other to within 2%. To obtain maximally reliable experimental data for rate constant inference, we performed multiple experiments until determining a set of target and probe concentrations such that each hybridization reaction undergoes between 2 and 10 half-lives within the 80 to 180 minute observation time.
In all experiments, the concentration of the target was at least double that of the probe, in order to minimize the effects of slight pipetting variability. To ensure that the observed kinetics are primarily due to target/probe sequence rather than synthesis impurities, we experimentally observed kinetics for the hybridization of 3 sets of targets and probes, each as 3 separate synthesis from 2 different vendors (Integrated DNA Technologies and Sigma). Inferred hybridization rate constants for different syntheses showed minor variations, and were all consistent to within a factor of 2 (see Supplementary Section 1).
Hybridization rate constant (kHyb) fitting
A simple two-state T + P → TP reaction model fails to reasonably fit the observed fluorescence kinetics. Notably, over 40% of the reactions asymptote to a final reaction yield of less than 85%, based on the positive control fluorescence in which the target and the probe were thermally annealed (Supplementary Section 1). We were surprised by the extent and reproducibility of the incomplete DNA hybridization yield, which may be due to misaligned hybridization or other nonspecific interactions between target and probe.
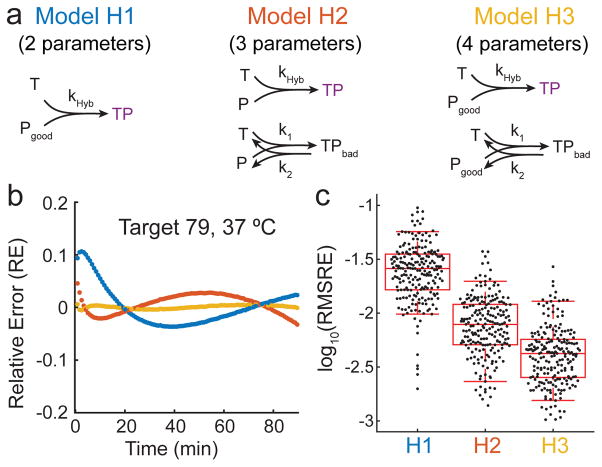
We considered three reaction models of hybridization to explain the kinetics data (Fig. 2a): Model H1 assumes that a fraction of the probes P are incapable of proper hybridization with target T or the accompanying fluorescence quenching. Model H2 assumes that all probe P is correctly synthesized, but that some fraction of the T + P reaction undergoes an alternative pathway with rate constant k1 to result in a state TPbad with high fluorescence; this frustrated state TPbad may represent states in which T and P are co-localized by misaligned base pairs. Model H3 is a combination of models H1 and H2, wherein there exists both a fraction of bad P as well as the alternative pathway involving TPbad.
FIG. 2.
Hybridization model and rate constant parameterization.
(a) Three different reaction models considered for fitting rate constant kHyb to fluorescence kinetics data. Based on the root-mean-square relative error (RMSRE) of each of the models in fitting the observed experimental data, Model H3 was selected. Model 3 has 4 fitting parameters for each reaction: kHyb, bad fraction ( ), k1, and k2. (b) Relative error (RE) for 3 reaction models for a given hybridization reaction. RE is plotted as a function of time for each model using best-fit parameters for each. (c) Summary of fit quality for the three models across all 210 fluorescence kinetics experiments. Each point corresponds to the root mean square relative error (RMSRE) of all time points for a particular fluorescence experiment. The upper and lower bars show 95th and 5th percentile values, and the box shows 75th, 50th, and 25th percentile values. Based on this result, we chose to proceed with H3 for all subsequent studies.
For each of our 210 fluorescence kinetics experiments, we performed fitting using each of the three models (Fig. 2b), finding parameters that minimize the sum-of-square relative error RE, where . The RE values of each hybridization experiment are summarized as a single root mean square relative error (RMSRE) value, defined as
| (1) |
where α is the total number of time points t during which fluorescence was measured for the reaction. Fig. 2c shows the distribution of RMSRE values; H3 yields the best overall fit to experimental data. Consequently, H3-fitted parameters (kHyb and bad fraction) were used for all subsequent work. See Supplementary Section 2 for best-fit traces using each reaction model.
Summary of observed hybridization kinetics
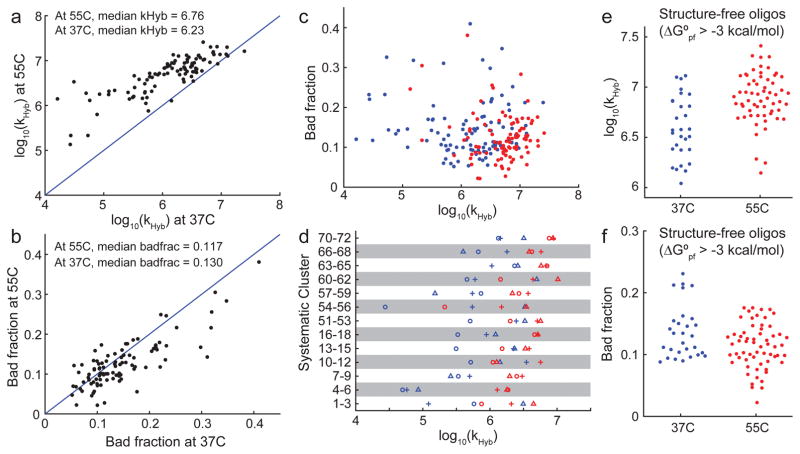
The best-fit values of the hybridization rate constant kHyb at 37°C and 55°C are summarized in Fig. 3a. The observed kHyb ranged 3.2 logs at 37°C and 2.3 logs at 55°C, significantly exceeding our expectations. Hybridization kinetics are generally faster at 55°C than at 37°C (by a factor of 3 on average), and there is a reasonably strong correlation between hybridization rate constants for the same target/probe pair at different temperatures.
FIG. 3.
Summary of observed hybridization kinetics. (a) Observed kHyb value (model H3) for 96 targets at 37°C and 55°C. 4 A/T targets were excluded from this because they were A/T rich and did not stably bind to their probes at 55°C. (b) Most reactions did not reach completion, instead saturating at between 60% and 100% yield. Yield is determined based on positive control experiments wherein target and probe are thermally annealed (Supplementary Section 1). We modeled incompleteness of hybridization as a “bad fraction” of probes that becomes kinetically trapped at a high fluorescence state. The best-fit bad fractions for the 96 targets at 37°C and 55°C are plotted here. (c) There appears to be no correlation between kHyb and asymptotic yield. Blue and red dots show experiments at 37°C and at 55°C, respectively. (d) Systematically designed target/probe sequences included 13 clusters, each comprising 3 targets. Within each cluster, the target sequences were shifted such that predicted secondary structure is present (1) near the 5′ end (plus symbols), (2) near the middle (circles), or (3) near the 3′ end of the target (triangles). In 8 out of 13 clusters, the target with structure in the middle was the slowest. (e) Because secondary structures are known to slow down kinetics [23], we examined the target/probe pairs in which both the target and the probe had predicted ensemble (partition function) standard free energy (ΔG°pf) of greater than −3 kcal/mol at the experimental hybridization temperature, indicating minimal structure. At 37°C and at 55°C, 29 of the 100 reactions and 61 out of 96 reactions satisfied this criterion, respectively. These reactions all have kHyb ≥ 106 M−1s−1, but kHyb values range more than 1 order of magnitude. (f) Minimal-structure targets exhibit significant variability of bad fraction, ranging between 0% and 25%.
The asymptotic yield of the fast initial hybridization reaction with rate constant kHyb can be quantitated as (1 - Bad Fraction). The Bad Fraction varies between 0.02 and 0.41 (Fig. 3b), and only appears to be marginally smaller on average at 55°C as compared to 37°C. Surprisingly, there are many cases (30 out of 96) where the Bad Fraction is larger at 55°C than at 37°C. Because aliquots of the same DNA oligonucleotide molecules were used for both sets of experiments, it is not clear why such inversions are so common. There does not appear to be significant correlation between kHyb values and the Bad Fraction (Fig. 3c).
We next examined the systematically designed DNA target/probe sequence pairs for trends in kHyb (Fig. 3d). The systematic sequences included 13 sets of 3 DNA target/probe pairs, each frame-shifted a small number of bases so that predicted secondary structure lies in the 5′, middle, or 3′ regions of the target (Fig. 1c). We observed two interesting trends: First, the observed kHyb values can vary greatly within a cluster: for example, targets 1–3 shows about 30-fold difference in hybridization rate constant, despite all three having similar standard free energy of folding. This indicates that the relative position of secondary structures within a DNA sequence can have large impact on kinetics. Second, targets with secondary structure in the middle of the sequence (circles in Fig. 3d) tended to be slower to hybridize than targets with structure at one end: in 8 out of the 13 clusters, the target with central secondary structure was the slowest in each’s respective cluster.
Literature reports [23] and our own prior experience suggested that unstructured DNA sequences would hybridize more rapidly and with higher yield than structured ones. To see if our experimental data is consistent with this observation, we plotted kHyb and Bad Fraction for only the hybridization reactions in which both the target and the probe have ensemble (partition function) standard free energy ΔG° > −3 kcal/mol, as predicted by Nupack [11] at the hybridization temperature and buffer conditions (Fig. 3ef). The observed kHyb values for these structure-free sequences are indeed faster than “typical” sequences, with all kHyb > 106 M−1s−1. Nonetheless, there is still significant variability in kHyb ranging more than 1 log. The asymptotic yield of the hybridization reactions is only slightly better for structure-free sequences than for other sequences.
Predictive Model Construction
Weighted Neighbor Voting (WNV) Model
Our WNV model predicts the value of kHyb for new hybridization reactions based on similarity of the reaction to hybridization reactions with known rate constants (labeled instances). Each labeled instance makes a weighted vote of log10(kHyb), with instances that are more similar to the new reaction being weighted more heavily. The 210 hybridization reactions across 100 different target/probe pairs acts as our initial database of labeled instances.
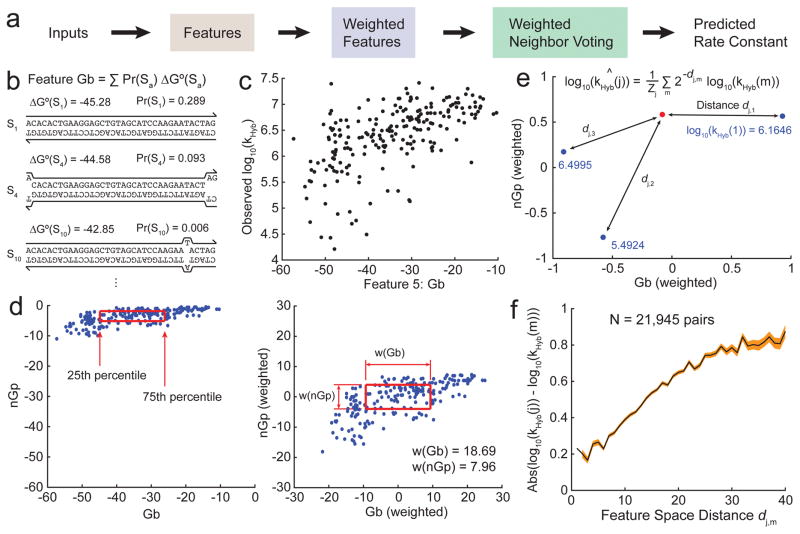
For each hybridization reaction, a number of features fi are calculated based on the sequences of the target and probe, and the hybridization reaction temperature and buffer (Fig. 4b). A total of more than 50 different features were tested, of which 35 showed significant individual correlation with kHyb (Supplementary Section 4). The disparity between two different hybridization reactions j and m is quantitated as a distance dj,m, the Euclidean distance between the two hybridization reactions in feature space:
| (2) |
where fi(j) is the value of weighted feature i for reaction j. Higher weights result in a wider feature dimension that can potentially contribute more to feature space distance (Fig. 4d).
FIG. 4.
Rate constant prediction using the Weighted Neighbor Voting (WNV) model. (a) For an unknown hybridization reaction whose rate constant is to be predicted, features values are calculated and compared to those in our database. The observed rate constants in the database are integrated via a weighted voting system, with weight decreasing exponentially based on distance to the target in feature space. (b) Features are computed based on the sequences of the target and probe, as well as the reaction conditions (temperature, salinity). Shown here is an example calculation for feature Gb, the weighted average ΔG° of the hybridized complex. (c) Relationship between the experimental hybridization rate constants kHyb (in log 10) vs. Gb values for the 210 hybridization experiments. There is moderate correlation between kHyb and Gb, indicating that Gb may be an effective feature for rate constant prediction. (d) Feature renormalization.
Raw values of the Gb and nGp features (left) are linearly transformed based on a set of feature weights w(i): The 75th percentile value of a feature i is renormalized to and the 25th percentile value is renormalized to . (e) The distance between renormalized feature values of an unknown reaction (red dot) and of all reactions with known kHyb values (blue dots) are computed. Prediction weight drops exponentially with distance. (f) Relationship between feature space distance d and the absolute value of difference in experimental rate constants (log 10) for two hybridization reactions. Pairs of reactions with small d generally have similar rate constants; the converse statement is not true because two very different reactions may coincidentally have similar rate constants. The black line shows the mean, and the red region shows ±1 standard deviation on the mean.
From the database of hybridization experiments m with known kHyb(m) values, our WNV model makes the following prediction for kHyb(j) of an unknown hybridization reaction j:
| (3) |
where Zj = Σm 2−dj,m is the “partition function” of the distances involving reaction j (Fig. 4e). Fig. 4f shows the relationship between feature space distance between a pair of hybridization reactions (using our final feature list and weights), and their difference in observed kHyb values.
The WNV model is extensible to any number of features. In general, the potential improvements in kHyb prediction accuracy must be balanced against increased model complexity from having a large number of features. Additionally, the higher-dimensional feature space that accompanies an increased number of features makes the weight optimization significantly more difficult, due to the increased number of local fitness maxima. Through a series of computational optimization steps, we determined the optimal number of features to be 6, comprising: nGp, Pap, Temp, wPat, GavgMSR1, Gb (see Supplementary Section 3 for optimization methodology).
Model Performance
To quantitate the overall performance of a particular WNV model (defined by its set of features and corresponding feature weights w(i)), we constructed the following “Badness” metric:
| (4) |
where F2acc is the fraction of all predicted reactions j in which predicted k̂Hyb(j) and the experimental kHyb(j) agrees to within a factor of 2, F3acc the fraction that agrees to within a factor of 3, and
| (5) |
is the root mean square error of the logarithm of the hybridization rate constant (where N = 210 is the number of experiments).
We chose to use this Badness metric rather than RMSE only (i.e. a least-squares fit) because we felt that it is more relevant for many applications involving the design of DNA oligonucleotide probes and primers: Rather than marginally improving the predictions of outlier sequences that are off by more than an order of magnitude, our Badness metric emphasizes instead improving the fraction of predictions that are correct to within a factor of 3, or better yet within a factor of 2. Simultaneously, to allow efficient computational optimization of feature weights, the Badness metric to be minimized cannot be locally flat, so RMSE is included as a component of Badness. Use of different Badness metrics will result in optimized feature weights that exhibit a different tradeoff between the magnitude and frequency of large prediction errors.
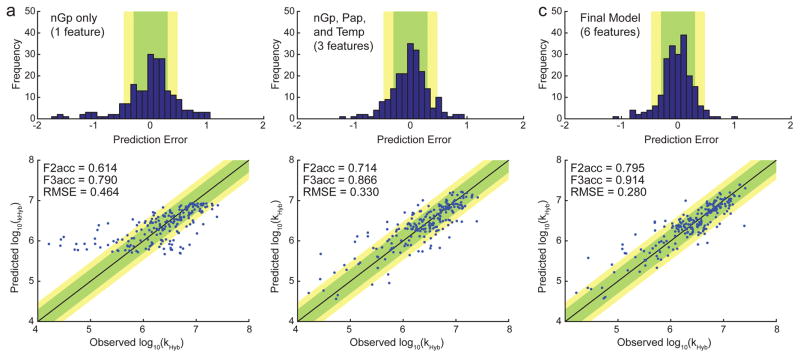
One commonly-held belief in the field is that predicted secondary structure in the DNA target and probe sequences is highly inversely correlated with hybridization rate constants. We found this to be partially true: when the WNV model is constrained to selection of only a single feature, the nGp feature (denoting the predicted ΔG° of the probe oligonucleotide based on Nupack at the hybridization temperature/buffer) emerged as the single best predictor of kHyb (Fig. 5a). Prediction using only nGp was accurate to within a factor of 2 for 61% of reactions, and within a factor of 3 for 79% of reactions. However, prediction accuracy can be significantly improved by including more features in the WNV model.
FIG. 5.
Prediction accuracy of the WNV model using different number of features.
(a) Prediction using a single feature, nGp, denoting the ensemble (partition function) standard free energy of the probe, as predicted by Nupack [11] at the reaction conditions of interest. The top panel shows the distribution of prediction error for kHyb (in log10). The bottom panel shows the predicted vs. observed kHyb values; each blue dot plots the predicted log10(k̂Hyb) value vs. the experimentally observed log10(kHyb) value for a single hybridization experiment. Each prediction was performed using a standard leave-one-out (LOO) approach: each kHyb prediction is based on 209 labeled instances (all reactions except the one to be predicted). The feature weights trained on all 210 data points; see Supplementary Section 3 for more details. (b) Prediction using a three-feature WNV model, including nGp, Pap, and temperature. (c) Prediction using the final 6-feature model.
Fig. 5b and Fig. 5c shows the prediction accuracy of the best 3-feature WNV model and the final 6-feature WNV model, respectively. The 6-feature WNV model is significantly better at prediction than the 1-feature and 3-feature models, with 80% accuracy within a factor of 2, and 91% accuracy within a factor of 3. The 6 features used were nGp, Pap, Temperature, wPat, GavgMSR1, and Gb, with respective feature weights of 7.96, 15.12, 10.55, 4.44, 10.90, and 18.69 (Supplementary Section 4). Although nGp was the best single feature when considered in isolation, in the 6-feature model its weight is the second smallest. This observation potentially suggests that the other features collectively hold information that overlaps with nGp.
To help the research community predict hybridization rate constants for DNA oligo probes and primers, we have constructed a web-based software tool, available at http://nablab.rice.edu/nabtools/kinetics. The software typically completes predicting kHyb within 30 seconds. It is currently seeded with the 210 hybridization experiment results performed in this paper, and will be updated with additional hybridization experiment results in the future.
Enrichment from Human Genomic DNA
The human genome is over 3 billion nucleotides long, but the coding regions that form the exome collectively only span 1% of the genome. Within the 20,000 genes of the exome, typically there are only between 10–400 are that are relevant to any particular disease. Next generation sequencing (NGS) [24, 25], is the preferred way to perform highly multiplexed analysis of many different DNA sequences within a sample. In NGS, anywhere between 1 million and 1 billion molecules are randomly sampled, and the identities of first 150 to 300 nt of each molecule are reported (subject to a sequencing error rate of between 0.1% and 1%); each reported sequence is known as a read. To observe potential variability in the DNA sequence at particular genomic regions, it is desirable to sample multiple molecules (high read depth). Solid-phase enrichment using highly multiplexed hybridization by synthetic DNA oligonucleotide probes [6] is often used for these targeted sequencing applications.
Current commercial multiplex hybrid-capture panels generally use a very large number of synthetic probe oligonucleotides to fully tile or overlap-tile the genomic regions of interest (e.g. 200,000 probes for whole exome enrichment). Due to the large number of oligo species involved, the concentration of each species is thus necessarily quite low (tens of picomolar), resulting in hybrid-capture protocols that typically span at least 4 hours, and more frequently more than 16 hours. Because of the varying hybridization kinetics of different probes (Fig. 3d), it is likely that many probes do not contribute significantly to hybridization yield, and in fact slow down the hybrid-capture process by forcing lower concentrations of the fast-hybridizing probes.
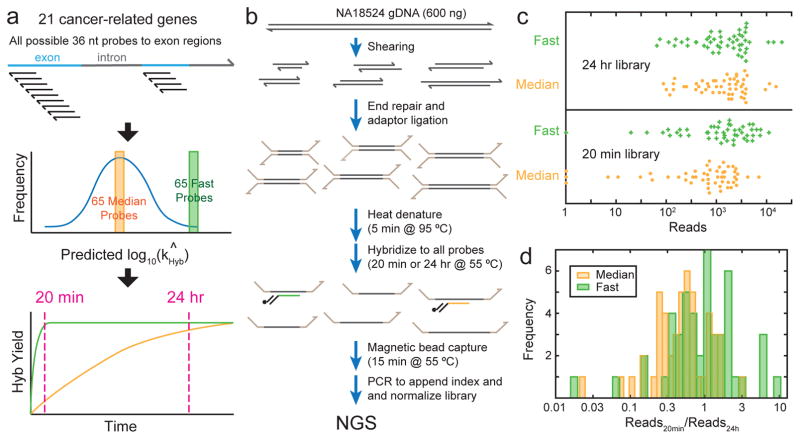
To experimentally test this possibility, we first applied our hybridization rate constant prediction algorithm to all possible 36 nt probes to exon regions of 21 genes. Because the exon regions are typically 3000 nt long, this corresponds to roughly 3000 possible probes per gene. Predicted rate constants typically range about 2 orders of magnitude (Supplementary Fig. 5), with the fast (≥95th percentile) probes being typically a factor of 3 faster than median probes (≈50th percentile). NGS hybrid-capture enrichment typically uses probes longer than 36 nt (e.g. Agilent SureSelect uses 120 nt probes), but there is likely a similar if not greater range of hybridization rate constants for longer probes due to the greater possibility of secondary structure and nonspecific interactions.
Subsequently, we picked a total of 65 fast probes and 65 median probes across the exon regions of 21 different cancer-related genes. The expectation is that after a 24 hour hybridization protocol, the fast and median probes would produce similar reads, but with a short 20 minute hybridization protocol, the fast probes would exhibit significantly greater reads than median probes (Fig. 6a). Our library preparation protocol is summarized in Fig. 6b; all 130 probes are hybridized to the adaptor-ligated DNA simultaneously. However, the number of reads aligned to a particular probe is not directly proportional to its hybridization yield, due to well-documented sequencing bias [26, 27]. For example, some adaptor-ligated amplicons exhibit significant secondary structure and is less efficiently PCR amplified during normalization, or less efficiently sequenced due to lower flow cell binding efficiency. For this reason, 15 fast and 15 median probes targeting 4 genes resulted in less than 100x sequencing depth, and were excluded from subsequent analysis (Supplementary Section 5); we do not believe this to affect the conclusions from our genomic DNA enrichment study.
FIG. 6.
Comparison of probes predicted to possess median vs. fast hybridization kinetics for enrichment from human genomic DNA. (a) Hybridization rate constant kHyb were predicted for all possible 36-mer hybridization probes to the exon regions of 21 cancer-related genes. The middle and lower panels express the idea behind probe selection and library design, and do not accurately reflect kinetics distributions or trajectories of any particular gene or probe; see Supplementary Fig. 5 for the distribution of predicted kHyb for the AQP1 gene. (b) Genomic DNA enrichment and library preparation workflow. All hybridization probes were present at 50 pM concentration. See the Methods section for detailed protocol. (c) Beeswarm plot of NGS reads aligned to each probe, excluding 15 fast and 15 median probes to 4 genes with low read depth (see Supplementary Section 5). In the library in which probes were hybridized to the fragmented gDNA for 24 hours (top panel), there is no significant difference in the read count distribution between the median and fast probes. In the 20-minute hybridization library, the fast probes showed significantly higher reads than the median probes, indicating that the probes our algorithm predicted to be faster did in fact provide a higher degree of hybridization within 20 minutes. (d) Ratio of aligned reads in the 20-minute library to the 24-hour library for each probe. A high ratio indicates fast hybridization kinetics; ratio can exceed 1 because libraries were normalized, so that fast probes are more dominant and occupy more reads in the 20-minute library.
Our comparison of reads for the 20 minute hybridization library and for the 24 hour hybridization library indicates that the probes predicted to be fast on average exhibited both a 2-fold increase in reads in the 20 minute library, and a 2-fold increase in the ratio of reads at 20 min vs. 24 hours. This is slightly worse than our algorithm’s predicted 3-fold difference between median and fast probes, but understandable given that our rate constant prediction algorithm was trained on single-plex hybridization rather than on multiplex hybridization. Our calibration experiments (Supplementary Section 5) indicate that the correlation constant between single-plex and multiplex kHyb values is roughly r2 = 0.6.
Our results thus suggest that sparse hybrid-capture enrichment panels would produce faster kinetics at a significantly lower cost. Rather than fully tiling or overlap-tiling the genetic regions of interest, it would be better to use a higher concentration of a few probes with fastest hybridization kinetics. Multiple probes are only needed insofar as biological genomic DNA may be fragmented, and a different probe is needed to capture each fragment. With the notable exception of cell-free DNA [28], most genomic DNA from clinical samples are longer than 500 nucleotides.
The concentrations of the probes used for this study was intentionally selected to be 50 pM per probe, so as to be similar to probe concentrations in commercial enrichment kits. At 50 pM concentrations, up to 200,000 probes can be used and the total oligo concentration would still be at a reasonable 10 μM. At the significantly (e.g. 10x) higher individual probe concentrations that become feasible with a sparse coverage of target genetic regions, even the 20 minutes allotted here for hybridization could be further reduced, greatly speeding up the enrichment workflow from current practice of 4–24 hours.
Discussion
In this work, we combined the rational design of features and the WNV framework with computational optimization of feature selection and feature weights, resulting in a final model that is capable of accurately predicting hybridization kinetics rate constants based on sequence and temperature information. The WNV model is highly scalable and easily incorporates new experimental data to provide improved predictions, without requiring model retraining. With every additional hybridization experiment and its accompanying fitted kHyb value, the 6-dimensional feature space becomes denser, ensuring that on average a new hybridization experiment will be closer to an existing labeled instance.
To seed the model with a reliable initial database of labeled instances that is representative of the diversity of genomic DNA sequences, we experimentally characterized the kinetics of 210 hybridization experiments across 100 biological target sequences using fluorescence. The X-probe architecture allowed us to economically study kinetics for a reasonably large number of target sequences, but extra nucleotides of the universal arms may cause hybridization kinetics to differ slightly from that of a standard single-stranded probe. For example, there may be a systematic bias towards lower rate constants because of the reduced diffusion constants. Nonetheless, because all targets/probes use the same universal arm sequences, it is likely that the relative ordering of rate constants is preserved.
In this work, we started with over 50 rationally designed features that we eventually pruned down to 6 in the final model. The high LOO validation accuracy of the WNV model indicates that these features capture a significant, if not majority, portion of the complexity of the hybridization process. Simultaneously, there remain pairs of experiments in our database with similar feature values but significantly different kHyb values. This implies the existence of undiscovered features that would distinguish these pairs of experiments; additional insight and creativity from the community in designing additional features would be welcomed.
The hybridization reactions experimentally characterized in the work were all performed in 5x PBS buffer, and all target and probe sequences were 36 nt long. These experiment constraints were designed to reduce the diversity of hybridization reactions, in order to ease the training of the WNV model. We plan to expand experimental studies to vary these conditions, in order to allow the WNV model to accurately account for buffer conditions and probe lengths. We suspect that longer DNA target/probe systems will exhibit even more variability in hybridization kinetics; conversely, shorter DNA binding (e.g. 10 nt) may exhibit less variability in kHyb. Additionally, with genomic DNA targets, the long-range secondary structure and the fragmentation pattern of genomic DNA targets should also be considered. New features will likely be needed for such expanded models.
Multiplex hybrid-capture panels for enriching target regions from genomic DNA is commonly used in targeted sequencing for scientific and clinical studies. In the absence of reliable kinetics prediction software, researchers and companies have taken a brute-force probe design approach, using fully tiled or overlapping-tiled probes to cover genetic loci of interest. While this approach ensures the presence of at least some fast-binding probes, it is both expensive (in terms of synthesis and QC of thousands of probes) and results in slower workflows. Accurately predicting multiplexed hybridization kinetics will enable precision design of sparse, high-performance probe panels for target enrichment.
Supplementary Material
Acknowledgments
The authors thank Sherry X. Chen for assistance with NGS sequence alignment. This work was funded by NIH grant R01HG008752 to DYZ.
Footnotes
Author contributions. JXZ, LRW, and DYZ conceived the project. JXZ and AWZ performed the experiments. ND and AP performed hybridization reaction model fitting and selection. JXZ, JZF, BY, and RP performed feature construction. WD and DYZ performed WNV model construction and optimization. ND, BY, RP, and RP performed MLR model construction and optimization. DYZ wrote the manuscript with input from all authors.
Competing Financial Interest. There is a patent pending on X-probes used in this work. There is a patent pending on the WNV model of hybridization rate constant prediction.
Data availability. Sequences used for all experiments are provided in the supplementary materials. Raw fluorescence traces are plotted in the supplementary materials, and exact numerical data is available upon request. Calculated feature values are provided in the supplementary materials.
Software availability. We have constructed a web-based software tool, available at http://nablab.rice.edu/nabtools/kinetics, that computes the predicted rate constant of a hybridization reaction given sequence and temperature. The software typically completes predicting kHyb within 30 seconds. It is currently seeded with the 210 hybridization experiment results performed in this paper, and will be updated with additional hybridization experiment results in the future.
References
- 1.Hamilton AJ, Baulcombe DC. A species of small antisense RNA in posttranscriptional gene silencing in plants. Science. 1999;286(5441):950–952. doi: 10.1126/science.286.5441.950. [DOI] [PubMed] [Google Scholar]
- 2.Kornberg A, Baker TA. DNA replication. New York: Freeman; 1992. [Google Scholar]
- 3.Lewis BP, Burge CB, Bartel DP. Conserved seed pairing, often flanked by adenosines, indicates that thousands of human genes are microRNA targets. Cell. 2005;120(1):15–20. doi: 10.1016/j.cell.2004.12.035. [DOI] [PubMed] [Google Scholar]
- 4.izkoviz S, van Oudenaarden A. Validating transcripts wih probes and imaging technology. Nat Methods. 2011;8:S12. doi: 10.1038/nmeth.1573. [DOI] [PMC free article] [PubMed] [Google Scholar]
- 5.Lockhart DJ, et al. Expression monioring by hybridization to high-densiy oligonucleotide arrays. Nat Biotechnol. 1996;14(13):1675–1680. doi: 10.1038/nbt1296-1675. [DOI] [PubMed] [Google Scholar]
- 6.Gnirke A, et al. Solution hybrid selection wih ultra-long oligonucleotides for massively parallel targeted sequencing. Nat Biotechnol. 2009;27:182–189. doi: 10.1038/nbt.1523. [DOI] [PMC free article] [PubMed] [Google Scholar]
- 7.Khodakov D, Wang C, Zhang DY. Diagnostics based on nucleic acid sequence variant profiling: PCR, hybridization, and NGS approaches. Adv Drug Delivery Rev. 2016;105:3–19. doi: 10.1016/j.addr.2016.04.005. [DOI] [PubMed] [Google Scholar]
- 8.Mathews DH, Sabina J, Zuker M, Turner DH. Expanded sequence dependence of thermodynamic parameters improves prediction of RNA secondary structure. J Mol Biol. 1999;288(5):911–940. doi: 10.1006/jmbi.1999.2700. [DOI] [PubMed] [Google Scholar]
- 9.SantaLucia J, Hicks D. The Thermodynamics of DNA Structural Motifs. Ann Rev Biochem. 2004;33:415–440. doi: 10.1146/annurev.biophys.32.110601.141800. [DOI] [PubMed] [Google Scholar]
- 10.Zuker M. Mfold web server for nucleic acid folding and hybridization prediction. Nucleic Acids Res. 2003;31(13):3406–3415. doi: 10.1093/nar/gkg595. [DOI] [PMC free article] [PubMed] [Google Scholar]
- 11.Zadeh JN, et al. NUPACK: analysis and design of nucleic acid systems. J Comput Chem. 2011;32(1):170–173. doi: 10.1002/jcc.21596. [DOI] [PubMed] [Google Scholar]
- 12.Morrison LE, Stols LM. Sensitive fluorescence-based thermodynamic and kinetic measurements of DNA hybridization in solution. Biochemistry. 1993;32(12):3095–3104. doi: 10.1021/bi00063a022. [DOI] [PubMed] [Google Scholar]
- 13.Reynaldo LP, Vologodskii AV, Neri BP, Lyamichev VI. The kinetics of oligonucleotide replacements. J Mol Biol. 2000;297:511–520. doi: 10.1006/jmbi.2000.3573. [DOI] [PubMed] [Google Scholar]
- 14.Zhang DY, Winfree E. Control of DNA Strand Displacement Kinetics Using Toehold Exchange. J Am Chem Soc. 2009;131:17303–17314. doi: 10.1021/ja906987s. [DOI] [PubMed] [Google Scholar]
- 15.Ouldridge TE, Sulc P, Romano F, Doye JP, Louis AA. DNA hybridization kinetics: zippering, internal displacement and sequence dependence. Nucleic Acids Res. 2013;41(19):8886–8895. doi: 10.1093/nar/gkt687. [DOI] [PMC free article] [PubMed] [Google Scholar]
- 16.Schreck JS, Ouldridge TE, Romano F, Sulc P, Shaw LP, Louis AA, Doye JP. DNA hairpins destabilize duplexes primarily by promoting melting rather than by inhibiting hybridization. Nucleic Acids Res. 2015;43(13):6181–6190. doi: 10.1093/nar/gkv582. [DOI] [PMC free article] [PubMed] [Google Scholar]
- 17.Cisse II, Kim H, Ha T. A rule of seven in Watson-Crick base-pairing of mismatched sequences. Nat Struct Mol Biol. 2012;19(6):623–627. doi: 10.1038/nsmb.2294. [DOI] [PMC free article] [PubMed] [Google Scholar]
- 18.Jungmann R, Steinhauer C, Scheible M, Kuzyk A, Tinnefeld P, Simmel FC. Single-molecule kinetics and super-resolution microscopy by fluorescence imaging of transient binding on DNA origami. Nano Lett. 2010;10(11):4756–4761. doi: 10.1021/nl103427w. [DOI] [PubMed] [Google Scholar]
- 19.He G, Li J, Ci H, Qi C, Guo X. Direct Measurement of Single-Molecule DNA Hybridization Dynamics with Single-Base Resolution. Angew Chem, Int Ed. 2016;55(31):9036–9040. doi: 10.1002/anie.201603038. [DOI] [PubMed] [Google Scholar]
- 20.Denoeux T. A k-nearest neighbor classification rule based on Dempster-Shafer theory. IEEE Transactions on Systems, Man & Cybernetics. 1995;25(5):804–813. [Google Scholar]
- 21.Wand MP, Jones MC. Kernel smoothing. Crc Press; 1994. [Google Scholar]
- 22.Wang JS, Zhang DY. Simulation-guided DNA probe design for consistently ultraspecific hybridization. Nat Chem. 2015;7(7):545–553. doi: 10.1038/nchem.2266. [DOI] [PMC free article] [PubMed] [Google Scholar]
- 23.Gao Y, Wolf LK, Georgiadis RM. Secondary structure effects on DNA hybridization kinetics: a solution versus surface comparison. Nucleic Acids Res. 2006;34:3370–3377. doi: 10.1093/nar/gkl422. [DOI] [PMC free article] [PubMed] [Google Scholar]
- 24.van Dijk EL, Auger H, Jaszczyszyn Y, Thermes C. Ten years of next-generation sequencing technology. Trends Genet. 2014;30(9):418–426. doi: 10.1016/j.tig.2014.07.001. [DOI] [PubMed] [Google Scholar]
- 25.Koboldt DC, Steinberg KM, Larson DE, Wilson RK, Mardis ER. The next-generation sequencing revolution and is impact on genomics. Cell. 2013;155(1):27–38. doi: 10.1016/j.cell.2013.09.006. [DOI] [PMC free article] [PubMed] [Google Scholar]
- 26.Chilamakuri CS, Lorenz S, Madoui MA, Vodak D, Sun J, Hovig E, Myklebost O, Meza-Zepeda LA. Performance comparison of four exome capture systems for deep sequencing. BMC Genomics. 2014;15:449. doi: 10.1186/1471-2164-15-449. [DOI] [PMC free article] [PubMed] [Google Scholar]
- 27.Clark MJ, Chen R, Lam HY, Karczewski KJ, Chen R, Euskirchen G, Butte AJ, Snyder M. Performance comparison of exome DNA sequencing technologies. Nat Biotechnol. 2011;29:908–914. doi: 10.1038/nbt.1975. [DOI] [PMC free article] [PubMed] [Google Scholar]
- 28.Snyder MW, Kircher M, Hill AJ, Daza RM, Shendure J. Cell-free DNA comprises an in vivo nucleosome footprint that informs is tissues-of-origin. Cell. 2016;164(1):57–68. doi: 10.1016/j.cell.2015.11.050. [DOI] [PMC free article] [PubMed] [Google Scholar]
Associated Data
This section collects any data citations, data availability statements, or supplementary materials included in this article.


