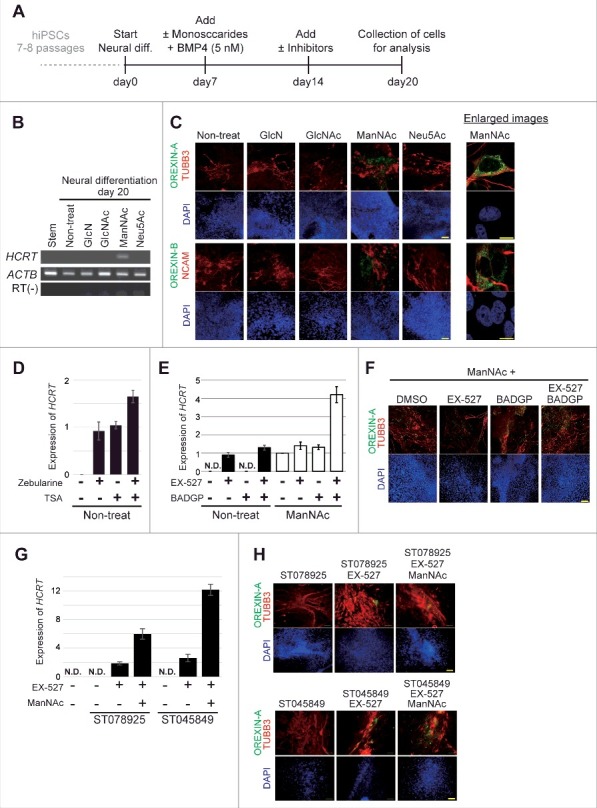
Figure 1.

Generation of orexin neurons from human induced pluripotent stem cells (hiPSCs) by ManNAc treatment. (A-H) Induction of neural cells expressing HCRT from hiPSCs. Differentiation of the neural cells from hiPSCs was induced by culture in SDIA+BMP4 medium with or without the addition of GlcN (1 mM), GlcNAc (1 mM), ManNAc (1 mM), or Neu5Ac (1 mM). Culture protocol to prepare neural cells derived from hiPSCs (A). On day 20, HCRT mRNA expression was analyzed by RT-PCR (B). We also performed immunofluorescent (IF) assays for OREXIN-A and OREXIN-B (C). OREXIN-A (green, upper), TUBB3 (red, upper), OREXIN-B (green, bottom), NCAM (red, bottom), and DAPI (blue). TUBB3 and NCAM are pan-neural markers. The right panel shows high magnification images of the ManNAc-treated cells. Scale bars, 100 μm (left panel) and 10 μm (right panel). Zebularine (100 μm) and Trichostatin A (TSA, 200 nM) were added to the SDIA+BMP4 medium, and HCRT mRNA expression was analyzed by RT-qPCR (D). BADGP (5 mM) or EX-527 (50 nM) was added to the SDIA+BMP4 medium with or without the addition of ManNAc, and HCRT mRNA expression was analyzed by RT-qPCR (E). The data were normalized to ACTB levels. Relative values were expressed, with the expression of ManNAc-treated cells (line 5) equal to 1.0. Means ± SD (n = 3). Immunofluorescence (IF) assay in EX-527 and BADGP-treated cells (F). ST078925 (100 μM) or ST045849 (40 μM) was added to the SDIA+BMP4 medium containing ManNAc and EX-527, and HCRT mRNA and OREXIN-A expressions were analyzed by RT-qPCR (G) and IF assays (H), respectively.
