

Abstract
Although it may sound unpleasant, camel urine has been consumed extensively for years in the Middle East as it is believed to be able to treat a wide range of diseases such as fever, cold, or even cancer. People usually take it by mixing small drops with camel milk or take it directly. The project aims to study the effects of camel urine in inhibiting the growth potential and metastatic ability of 4T1 cancer cell line in vitro and in vivo. Based on the MTT result, the cytotoxicity of camel urine against 4T1 cell was established, and it was dose-dependent. Additionally, the antimetastatic potential of camel urine was tested by running several assays such as scratch assay, migration and invasion assay, and mouse aortic ring assay with promising results in the ability of camel urine to inhibit metastatic process of the 4T1 cells. In order to fully establish camel urine’s potential, an in vivo study was carried out by treating mice inoculated with 4T1 cells with 2 different doses of camel urine. By the end of the treatment period, the tumor in both treated groups had reduced in size as compared to the control group. Additional assays such as the TUNEL assay, immunophenotyping, cytokine level detection assay, clonogenic assay, and proteome profiler demonstrated the capability of camel urine to reduce and inhibit the metastatic potential of 4T1 cells in vivo. To sum up, further study of anticancer properties of camel urine is justified, as evidenced through the in vitro and in vivo studies carried out. Better results were obtained at higher concentration of camel urine used in vivo. Apart from that, this project has laid out the mechanisms employed by the substance to inhibit the growth and the metastatic process of the 4T1 cell.
Keywords: camel, camel urine, breast cancer, 4T1 cell, antimetastasis, anti-angiogenesis, immunomodulatory
Introduction
Cancer has been one of the major diseases plaguing the world for millennia. Thousands of new cases are reported each year with high fatality rates.1 Women have a 1 in 8 chance of getting diagnosed with breast cancer in Malaysia, where it is the most common cancer reported. Although conventional treatment such as chemotherapy is available to suppress the onset and progress of cancer, the severe side effects and the possibility of relapse and pain coupled with varied chances of success dampen the treatment.2
In order for a cancer treatment to be considered a viable option, it has to not only kill or slow down the growth of the tumor but it needs to stop the spread of the cancer as well. Metastasis is a process whereby cancer cells migrate to distant organs or secondary sites in the body and proliferate.3 It is estimated that 90% of fatalities in cancer patients are brought about by metastasis rather than the primary tumor. For metastasis to take place, several crucial steps must occur, such as angiogenesis and invasion. Interference at any of the steps will lead to termination of the metastatic cascade.4
As unpleasant as it sounds, the consumption of camel urine is one of the many treatment options that has been available in the Arabian Peninsula for centuries. In recent years, its medicinal claim has been put under scrutiny and with promising results, whereby it is reported to exhibit antifungal activity and able to protect liver from damage induced by CCl4.5,6 Moreover, it is able to kill several cancer cell lines at an acceptable dosage.7,8 Nonetheless, its mechanism in inhibiting the metastatic potential of cancer cell has not been properly investigated and there have been few animal models tested so far. As such, the mechanism of camel urine inhibiting tumor growth and the metastatic process of breast cancer cells was tested using several assays such as MTT assay, proteomic profiler assay, and real-time polymerase chain reaction (PCR).
Methods
Preparation of Camel Urine Sample
The urine sample was collected from Magateer female virgin camel from Riyadh, Saudi Arabia, aged 8 years, during feeding time into stainless steel containers and kept at −80°C until further use. Urine (10 mL) was aliquoted into 15-mL falcon tubes and freeze dried using FreeZone Freeze Dry Systems (Labconco, Kansas City, MO) at Laboratory of Marine Biotechnology, IBS. Stock solution was prepared by dissolving the powdered urine sample in phosphate-buffered saline (PBS) and filtered through Minisart syringe filter (Sigma, St Louis, MO) pore size 0.2 µm and kept at 4°C until further use.
Cell Lines and Cell Cultures
Mouse mammary tumor 4T1 cell (ATCC No. CRL-2539) was obtained and thawed from Animal Tissue Culture Laboratory, Department of Cell and Molecular Biology, Universiti Putra Malaysia. The cell was grown and maintained in RPMI-1640 media (Sigma) supplemented with 10% (v/v) heat-inactivated fetal bovine serum (FBS; PAA, Pasching, Austria), penicillin (100 IU/mL), and streptomycin (100 ng/ML; PAA) in 90% humidified incubator at 37°C with 5% CO2.
MTT Cytotoxic Assay
To determine the IC50 of camel urine, and hence its cytotoxic potential, it was evaluated using the 3-(4,5-dimethyl-2-thiazolyl)-2,5-diphenyl-2H-tetrazolium bromide (MTT) assay.9 Two-fold serial dilutions of camel urine were tested on the 4T1 cell line seeded at a concentration of 0.8 × 10⁵ cells/mL for 24 hours before treatment was added, with further incubation at 3 different time points, which were 24, 48, and 72 hours. At each respective time point, 20 µL of MTT solution (Calbiochem, San Francisco, CA; 5 mg/mL) was added into each well and further incubation was done for another 4 hours before 170 µL of media was discarded from each well at the end of the incubation time. Then, 100 µL of dimethyl sulfoxide was added into each well and 30 minutes incubation period ensued to dissolve the blue formazan crystal formed at the bottom of the well. The plates were tapped gently before the reading was recorded at 570 nm in a µQuant ELISA Reader (Bio-Tek Instruments, Winooski, VT). Percentage of cell viability was then calculated using the following formula:
The concentration of camel urine that inhibited 50% of cell viability (IC50) was determined by plotting the absorbance value and establishing the connecting point between the percentage of cell viability and concentration of test substance.
In vitro Scratch Assay
This assay was carried out according to the protocol outlined by Liang et al.10 4T1 cells were seeded at concentration of 2.4 × 10⁵ cells/mL in 6-well plates for 24 hours and incubated in a 90% humidified incubator at 37°C with 5% CO2. After 24 hours, a sterile yellow tip was used to scratch a straight line in the middle of the wells and the media was discarded before fresh media with 3 different concentrations of camel urine—2 mg/mL, 1 mg/mL, and 0.5 mg/mL—were introduced into the wells. Images were captured using Diaphot Phase Contrast-2 EL WD 0.3 fluorescence microscope at 0, 20th, and 24th hour to determine the rate of migration (Nikon, Tokyo, Japan). The rate of migration was determined using the following formula:
Migration and Invasion Assays
In this assay, the ability of camel urine to inhibit the mortality of 4T1 cells was investigated by migration and invasion assays using culture insert (Becton Dickinson, Franklin Lakes, NJ). In summary, 4T1 cells were seeded at a concentration of 5 × 10⁵ cells/mL inside cell culture insert and treated with 3 different concentrations determined from the MTT cytotoxic assay, which were 2 mg/mL, 1 mg/mL, and 0.5 mg/mL. Three independent, biological replicates were carried out. One day before seeding and treatment, media with FBS serum was aspirated from the culture flask of 4T1, and it was replaced with media without serum. The cell culture insert was placed in each well of a 6-well plate. For invasion assay, 100 µL of matrigel (Becton-Dickinson) was added and allowed to set for an hour. Then, 4T1 cells were seeded inside the cell culture insert and treatment was added immediately before the plate was incubated in a 90% humidified incubator at 37°C with 5% CO2 for 24 hours. Then, the insert was removed from the well and fixed with 100% methanol for 2 hours before it was stained with crystal violet for 1 hour. Stained cells were observed under Diaphot Phase Contrast-2 EL WD 0.3 fluorescence microscope (Nikon). Migrated or invaded cells were counted in each experiment in 4 different pictures taken for each replicate.
Ex Vivo Mouse Aortic Ring Assay
Ex vivo mouse aortic ring assay can be utilized to study angiogenesis and the effectiveness of drugs or compounds in affecting angiogenesis.11 BALB/c mice of age of 7 weeks were sacrificed and the dorsal aorta was harvested, rinsed with ice-cold PBS a few times, and cut into approximately 1.5-mm pieces. Then, each piece was inserted in a 96-well plate that had been precoated with matrigel. Another layer of matrigel was sandwiched on top afterwards and it was allowed to solidify before EGM media with camel urine at a concentration of 4 mg/mL was added to the wells. The plate was incubated in a 90% humidified incubator at 37°C with 5% CO2 for 7 days before it was observed under Diaphot Phase Contrast-2 EL WD 0.3 fluorescence microscope (Nikon). This assay was carried out according to the protocol outlined by Baker et al.11
Animals
Female BALB/c mice were purchased from Animal House of the Faculty of Veterinary Medicine, Universiti Putra Malaysia, aged around 7 weeks with average body weight of 20 to 22 g and placed in plastic cages with temperature modulated at approximately 22 ± 1°C and 12 hours of dark/light cycle with humidity around 60%. They were allowed to acclimatize for 7 days and received standard pellet diet and distilled water ad libitum for the whole duration of the experiment. This study was approved by the Animal Care and Use Committee, Universiti Putra Malaysia (UPM/IACUC/AUP- 096/2014), according to the guidelines from the committee.
In Vivo Antitumor Effect on 4T1-Challenged BALB/c Mice
Mice were divided into 3 groups with 5 mice in each group, and 2 concentrations were chosen.12 Each mouse was inoculated with 4T1 cell line at a concentration of 1 × 10⁶ cells/mL subcutaneously, and 1 week of incubation period was allowed for the tumor to grow before the treatment phase commenced. The arrangement for the treatment phase was as follows:
Control: 100 µL of distilled water
Low dose: 100 µL of 120 mg/kg extract
High dose: 100 µL of 240 mg/kg extract
All treatments were administered orally daily for 28 days through oral gavage. Mice were monitored twice per day for 28 days until they were sacrificed through cervical dislocation. Organs and blood were collected prior to the following assays.
Histopathology Analysis Using Hematoxylin and Eosin (H&E) Stain Staining
The cell division of tumors was observed in H&E staining. Half of the tumors were collected and fixed in 10% neutral buffered formalin before they were sent to the Histopathology Laboratory, Faculty of Veterinary Medicine, Universiti Putra Malaysia, for sectioning and staining with hematoxylin and eosin stain. In short, the stained tissues were observed under a Diaphot Phase Contrast-2 EL WD 0.3 microscope (Nikon).
Antioxidant Activity in Tumor Sample
Antioxidant activity in tumor sample was investigated by measuring the activity of malondialdehyde (MDA) and nitric oxide (NO). Tumors were weighed and mashed in ice-cold PBS solution before they were centrifuged at 8000 × g for 10 minutes in 4°C. For quantification of NO, the assay was carried out using Griess Reagent Kit for Nitrite Determination (Molecular Probes, Eugene, OR) in accordance to the user guidelines provided. For quantification of MDA, this assay was carried out according to the protocol outlined by Suhail et al.13 Two hundred microliters of sample was mixed with 800 µL of PBS, 25 µL of butylated hydroxytoulene (BHT; 44 mg/5mL absolute ethanol solution), and 500 µL of 30% trichloroacetic acid before the mixture was subjected to vortex and incubated in ice for 2 hours. After 2 hours, it was centrifuged at 2000 × g for 15 minutes at room temperature. Then, 1 mL of supernatant obtained was mixed with 75 µL of 0.1 M EDTA and 250 µL of 1% thiobarbituric acid in 1 M NaOH and boiled for 15 minutes. After the solution cooled down to room temperature, the absorbance is recorded at 600 nm and 532 nm using a spectrophotometer (Beckman Coulter, Carlsbad, CA).
Clonogenic Assay
The metastasis of 4T1 cells to other parts from the primary tumor site was investigated by clonogenic assay. Liver, lung, and brain were harvested under sterile condition, mashed, and incubated with ice-cold PBS and collagenase for 30 minutes in a water bath at 37°C with shaking at every 5-minute interval. Then, they were strained and spun down before they were suspended in 10 mL selection medium. Ten-fold serial dilution was carried out for each organ for each plate and they were incubated in a 90% humidified incubator at 37°C with 5% CO2 for 10 days. Then, the plates were fixed with 100% methanol and stained with 0.5% crystal violet. The degree of 4T1 metastasis was determined by counting the colony formed in each well.
Immunophenotyping of Spleen CD4, CD8, and NK 1.1 T Cells
Spleens were harvested, mashed in cold PBS, and strained through 80 µm wire mesh before being treated with lysis buffer (see the appendix). Then, they were pelleted down at 2000 × g for 5 minutes, resuspended in ice-cold PBS again, and divided into 2 tubes. After that, they were stained with CD3/CD4/CD8 (Abcam, Cambridge, MA) and NK1.1/CD3 (Abcam) antibodies and incubated for 2 hours on ice. After 2 hours, they were pelleted down and 1 mL of PBS was added before they were analyzed using a FACS Calibur flow cytometer (Becton-Dickinson).
Serum Cytokine ELISA Assay
The concentration of IL-1β and IL-10 secreted by spleens were verified from the serum samples. Serum samples were collected and kept in a −20°C freezer before they were analyzed using Mouse IL-1β ELISA MAX and Mouse IL-10 ELISA MAX (BioLegend, San Francisco, CA) in accordance to the user guidelines provided.
Terminal dUTP Nick End Labeling (TUNEL) Assay
Unstained tumor slides were prepared by the Histopathology Laboratory, Faculty of Veterinary Medicine, Universiti Putra Malaysia. TUNEL assay was carried out using DeadEnd Colorimetric TUNEL system kit (Promega, Fitchburg, WI) according to the user guidelines provided.
Splenocyte Cytotoxicity Assay
The activity of splenocyte cytotoxicity was determined by incubating harvested spleen with Yac-1 cell line and assessing the activity by using CytoTox 96 nonradioactive cytotoxicity assay kit (Promega). In brief, spleens were harvested, mashed, and strained through a wire mesh. Then, they were seeded in 96-well plate with Yac-1 cells at the ratio of 5:1 and 2:1 of effector–target before they were incubated in a 90% humidified incubator at 37°C with 5% CO2 for 24 hours. The percentage of cytotoxicity was determined by using the following formula:
Quantitative Real-Time PCR Assay
The tumors harvested from the mice were kept in RNALater (Qiagen, Venlo, Netherlands) before total RNA was isolated using RNeasy mini kit (Qiagen) in accordance to the user guidelines provided. The total RNA was reverse transcribed into cDNA using the QuantiTect Reverse Transcription kit (Qiagen) in accordance to the user guidelines provided. After that, the cDNA was put through the RT-PCR analysis with iQ5 RT-PCR machine (Bio-Rad, Berkeley, CA) and the data obtained were analyzed using the iQ5 data analysis software. The primer sequences used are given in Table 1.
Table 1.
The Primer Sequence Used in Real Time-Polymerase Chain Reaction.
| Accession Number | Gene | Sequence |
|---|---|---|
| NM_007393.3 | ACTB | F: 5-TTCCAGCCTTCCTTCTTG-3 |
| R: 5-GGAGCCAGAGCAGTAATC-3 | ||
| NM_013556.2 | HPRT | F: 5-CGTGATTAGCGATGATGAAC-3 |
| R: 5-AATGTAATCCAGCAGGTCAG-3 | ||
| NM_008084.3 | GAPDH | F: 5-GAAGGTGGTGAAGCAGGCATC-3 |
| R: 5-GAAGGTGGAAGAGTGGGAGTT-3 | ||
| NM_008689.2 | NF-κβ | F: 5-CATTCTGACCTTGCCTATCT-3 |
| R: 5-CTGCTGTTCTGTCCATTCT-3 | ||
| NM_010849.4 | C-MYC | F: 5-TGATGTGGTGTCTGTGGAGAA-3 |
| R: 5-CGTAGTTGTGCTGGTGAGTG-3 | ||
| NM_010927.3 | iNOS | F: 5-GCACCGAGATTGGAGTTC-3 |
| R: 5-GAGCACAGCCACATTGAT-3 | ||
| NM_010493.2 | ICAM1 | F: 5-TGCTCAGGTATCCATCCATCC-3 |
| R: 5-ACGGTGCCACAGTTCTCAA-3 |
Mouse Angiogenesis Proteomic Profiler
The effect of camel urine on the protein level affecting the angiogenesis process in 4T1 tumor was investigated using RayBio Mouse Angiogenesis Antibody Array 1 (RayBiotech, Norcross, GA) in accordance to the user guidelines provided. The tumors excised from the mice were snap-frozen with liquid nitrogen and mashed with sterilized mortar and pestle. The protein was extracted from the tumor using RIPA buffer (NaCl, Triton X-100, C24H39NaO4, SDS, Tris). The RIPA buffer was supplemented with protease cocktail inhibitor (Roche, Indianapolis, IN) before further use. The concentration obtained was quantified using Bradford assay (Sigma).
Statistical Analysis
All data were represented as means ± standard deviations of means. The analysis was performed with one-way analysis of variance (ANOVA) and the group means were compared by Duncan test. P values <.05 were considered as statistically significant.
Results
Camel Urine Inhibited Proliferation of 4T1 Cells In Vitro
The MTT assay was carried out to determine the ability of camel urine to inhibit proliferation of mouse breast cancer cell line, 4T1. Two-fold serial dilutions of camel urine were administered onto the 4T1 cell line for 72 hours before further readings were recorded. Based on Figure 1, camel urine was able to inhibit proliferation of 4T1 cells in vitro in a dose-dependent manner where the half-maximal inhibitory concentration (IC50) for camel urine was 2 mg/mL after 48 hours of treatment.
Figure 1.
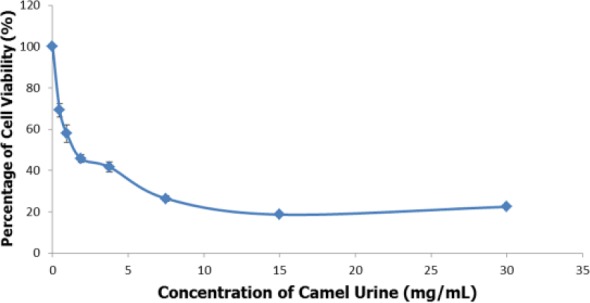
MTT analysis of 4T1 cells after treatment with 7 concentrations (30 mg/mL to 0.4 mg/mL) of camel urine. The data are expressed as mean ± standard error of mean and the experiments were done in triplicates, P < .05.
The Motility and Invasiveness of 4T1 Cells Were Inhibited by Camel Urine In Vitro
In order to determine the antimetastatic activity of camel urine, the wound-healing assay was carried out. Based on the result obtained from Figure 2A, it was safe to assume the rate of migration of 4T1 cells toward the center of the wound was inversely proportional to the concentration of camel urine administered in the assay, wherein as the concentration of the camel urine administered increased, the rate of migration of 4T1 cells toward the center of the wells decreased. The rate of migration was compared between control and treatment groups. Based on Figure 2A, the rate of migration for IC25 treatment group was at 20.08 ± 1.54% as compared to the control group, which was at 52.38 ± 1.38%. The IC50 treatment group produced the most significant result whereby at the concentration of 2 mg/mL, it managed to reduce the rate of migration down to 9.97 ± 2.01%.
Figure 2.

Percentage of wound closure, migrated cells, and invaded cells of 4T1 cells. (A) Percentage of wound closure of 4T1 cells after a scratch was introduced in the middle section. Images were captured at 0 hour and 21 hours. Measurement was taken between the dotted lines where the blue arrow was placed to represent the size of the wound. (B) Percentage of migrated 4T1 cells in the in vitro transwell migration assay. The presence of blue/purple dots against white background was counted at 3 different sections of the photograph. (C) Percentage of invaded 4T1 cells in the in vitro transwell invasion assay. The presence of blue/purple dots against white background was counted at 3 different sections of the photograph. Two different doses (IC25 and IC50) were used for all assays. The assay was done in triplicate and the data are expressed as mean ± standard error of mean. Significance is set at *P < .05. Magnification 10×.
In order to further validate the results obtained from the wound-healing assay, the transwell in vitro migration assay was conducted. Based on the result obtained from Figure 2B, it can be seen that the rate of migration through the transwell membrane was inversely proportional to the dose used. In the in vitro migration assay, the percentage of migrated cells in the IC25 treatment group was at 78.41 ± 4.67%, while in the IC50 treatment group the percentage was reduced to half at 51.11 ± 6.30%. Similar patterns were observed in the in vitro invasion assay based on Figure 2C, where the rate of invasion was dose-dependent, wherein higher dose led to lower rate of invasion. For the IC25 treatment group, the rate of invasion was at 70.41 ± 7.14%, and the rate decreased significantly as compared to the control group for the IC50 treatment group at 52.72 ± 6.74%.
Camel Urine Showed Anti-Angiogenic Potential
Apart from inhibiting the migration and invasion capabilities of cancer cells, it is important to be able to inhibit the angiogenesis step, which plays an important role in the metastatic cascade. In order to establish the anti-angiogenic potential of the camel urine, the ex vivo mouse aortic ring assay was carried out. Based on Figure 3, camel urine managed to reduce the formation of vessels sprouted out from the fragmented aorta from 26 ± 3.79 in the control group to zero in the IC50 treatment group.
Figure 3.
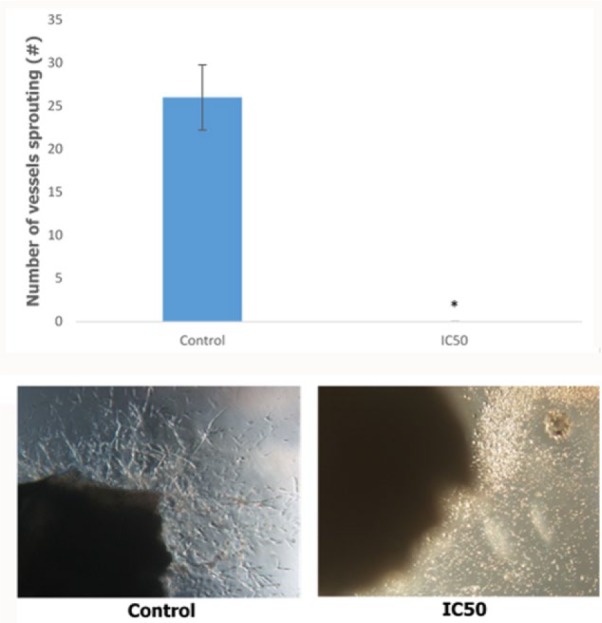
The bar chart analysis and representative image of the ex vivo mouse aortic ring assay. Five different sections of the images were chosen for counting. The vessels protruding from the fragmented aorta were counted. The data are expressed as mean ± standard error of mean and the experiments were done in triplicate. Significance is set at *P < .05. Magnification 10×.
Camel Urine Inhibited 4T1 Cancer Cell Growth In Vivo
In order to determine the effect of camel urine on 4T1 cell growth in mice, the final weight of the tumor was determined. When comparing between the control and treated groups, significant differences were observed between the groups where the control group tumor clocked in weight at 1.66 ± 0.12 g and lower tumor weight was observed in both low-dose (1.26 ± 0.07 g) and high-dose (1.16 ± 0.27 g) groups while only a marginal difference was observed between low-dose and high-dose groups as illustrated in Figure 4A and B. Further analysis was carried out using TUNEL assay to determine the extent of cell apoptosis in the treated groups. Based on Figure 4C, higher number of apoptotic cells (black circle) were observed in low-dose and high-dose groups as compared to the control group. Moreover, the effect of camel urine in inhibiting 4T1 cell growth was further validated in H&E staining whereby lower number of mitotic cells were present in low dose as compared to the control group as seen in Figure 4D. A similar pattern was observed in high-dose group as well where the number of mitotic cells decreased.
Figure 4.

Tumor weight, TUNEL analysis, and H&E staining of harvested tumor from the control, high-dose (240 mg/kg), and low-dose (120 mg/kg) treated mice. (A) Images of the tumor harvested from the control and treatment groups; scale in cm. (B) Measurement of tumor weight harvested from the mice after 28 days from commencement of treatment. (C) TUNEL analysis of harvested tumor from untreated and treated mice. Black circles depict cells with fragmented DNA based on presence of dark dots against brown background. Magnification: 20×. (D) Hematoxylin and eosin staining (H&E) of harvested tumors from untreated and treated mice. Black circles depict mitotic cell based on presence of dark purple spots. Magnification: 20×. The data are expressed as mean ± standard error of the mean for triplicates. Significance is set at *P < .05; n = 5 mice per group.
Camel Urine Regulated Several Cytokines and Immune-Related Markers In Vivo
To further understand the mechanism of camel urine in affecting cancer, the blood serum of the mice was collected and analyzed to measure the level of 2 cytokines, IL-1β and IL-10. According to Figure 5, treatment of the mice with camel urine inhibited the activation of IL-1β in the treatment group as compared to the control group, although not significantly. The control group had a reading of 666.51 ± 11.11 pg/mL of IL1-β, while the low-dose and high-dose groups showed lower readings at 549.84 ± 50 pg/mL and 585.80 ± 14 pg/mL of IL-1β, respectively. A similar pattern was observed in regard with the concentration of IL-10 in the blood serum where lower readings were detected in the treated group. A reading of 324.61 ± 9.52 pg/mL of IL-10 was clocked in for the control group while the treated groups showed readings at 297.9 ± 1.87 pg/mL of IL-10 for the low-dose group and 298.42 ± 7.14 pg/mL of IL-10 for the high-dose group.
Figure 5.
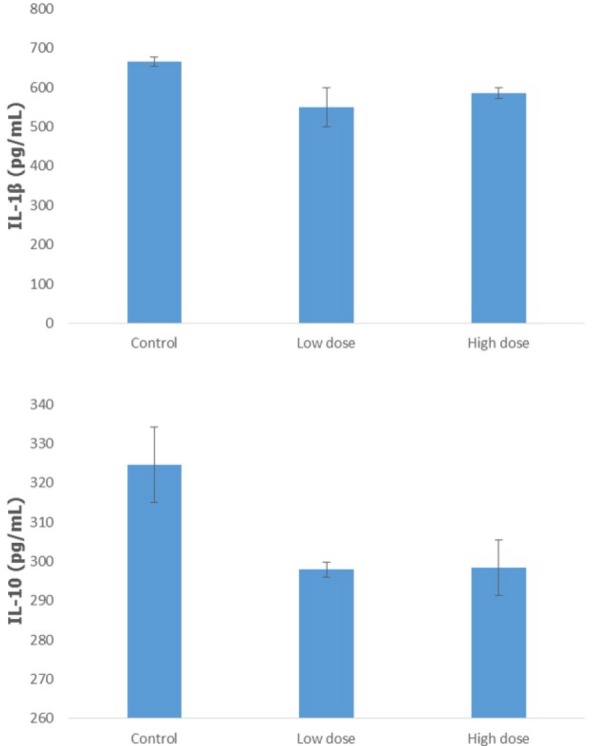
Analysis on the detection of the cytokine level (IL-1β and IL-10) in the serum of the control, low-dose (120 mg/kg), and high-dose (240 mg/kg) treated mice using enzyme-linked immunosorbent assay. The data are expressed as mean ± standard error of the mean. Significance is set at *P < .05; n = 5 mice per group.
Immunophenotyping analysis was carried out to determine the presence of certain immune cell subsets in the mice splenocytes. Three immune cell subsets were detected in this analysis: CD3/CD4 subset, CD3/CD8 subset, and CD3/NK1.1 subset. In the CD3/CD4 subset, increases from 4.59 ± 0.004% in the control group to 7.12 ± 0.16% in the low-dose group and 8.07 ± 0.73% in the high-dose group were observed as depicted by Figure 6. There was also a substantial increase of CD3/CD8 subset in the treated group wherein the reading doubled from 2.44 ± 0.12% in the control group to 4.58 ± 0.10% and 4.30 ± 0.29% for the low-dose and high-dose groups, respectively. The third and final analysis on the markers of NK1.1 and CD3 showed a promising result as well where there were increases in both populations of CD3−/NK1.1+ and CD3+/NK1.1+ in the treated groups. In the quadrant of CD3−/NK1.1+, the reading was at 0.21 ± 0.04% for the control group while the low-dose group had a significant reading of 0.37 ± 0.07% and the high-dose group at 0.33 ± 0.04%. For CD3+/Nk1.1+, the percentage of the subset population doubled for low-dose and high-dose groups from 0.94 ± 0.04% in the control group to 1.93 ± 0.07% in the low-dose group and 1.85 ± 0.08% in the high-dose group.
Figure 6.

Flow cytometry analysis of CD4, CD8, and NK1.1 on the splenocytes of the control, low-dose (120 mg/kg), and high-dose (240 mg/kg) groups on day 28 after 4T1 cell cancer induction. The data are expressed as means ± standard error of the mean for triplicates. Significance is set at *P < 05; n = 5 mice per group.
Apart from immunophenotyping of the splenocyte to determine the subset, the activity of the natural killer cells can be established by incubating the harvested splenocytes with Yac-1 cells. As depicted in Figure 7, there was an increase in the cytotoxicity of the treated splenocytes in both low-dose and high-dose groups as compared to the control group wherein the higher cytotoxicity activity was recorded for 10:1 ratio group than the 5:1 ratio group. In the 5:1 ratio group, the cytotoxicity of the harvested splenocytes from the low-dose group was 42.94 ± 0.09% as compared to the control group at 36.37 ± 0.33%, while for the 10:1 ratio group, it is at 48.32 ± 1.55% as compared to 42.38 ± 1.55%, respectively. In the high-dose group, similar patterns were detected between the control and high-dose groups. For the 5:1 ratio group, the percentage of cytotoxicity in the high-dose group was 47.09 ± 1.04% as compared to 36.37 ± 0.33% for the control group. Higher percentage of cytotoxicity was recorded as well in the 10:1 ratio group at 50.19 ± 1.05% for the high-dose group and 42.38 ± 1.55% for the control group.
Figure 7.
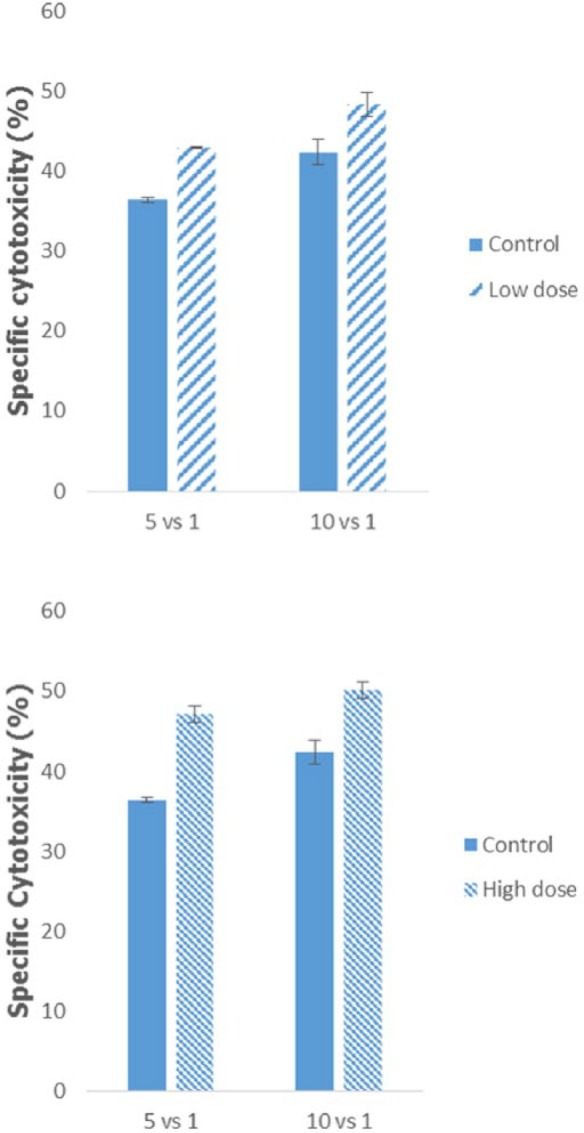
Analysis of the cytotoxicity activity of splenocyte from the control, low-dose (120 mg/kg), and high-dose (240 mg/kg) treated mice against lymphoma Yac-1 at the ratio of 5:1 or 10:1 of splenocyte to Yac-1. The data are expressed as the mean ± standard error of the mean. Significance is set at P < .05; n = 5 mice per group.
Camel Urine Suppressed Inflammation Markers In Vivo
Several markers play important roles in regulating inflammation onset and progress in cancer patients. NO level was measured by incubating the supernatant obtained from the mashed tumor with Griess reagent (Molecular Probes). Based on Figure 8A, there was a significant decrease in the level of NO from 0.0015 ± 0.000038 µM NO/mg protein in the control group to 0.0009 ± 0.000021 µM NO/mg protein and 0.00010 ± 0.000027 µM NO/mg protein in the low-dose and high-dose groups, respectively. A similar reduction pattern was observed in MDA level when comparing the control group with the low-dose and high-dose groups. Further evidence of the capability of camel urine to suppress important inflammation markers was elucidated in the level of mRNA expression of several genes. As depicted in Figure 8B, significant decrease of the mRNA level of iNOS, ICAM, and NK-κβ was observed in both low-dose and high-dose groups.
Figure 8.

Analysis of the level of lipid peroxidation and relative level of mRNA in the tumor excised from the control, low-dose (120 mg/kg), and high-dose (240 mg/kg) treated mice. (A) The analysis on the level of nitric oxide (NO) and malondialdehyde (MDA) lipid peroxidation. (B) Analysis of the relative level of the messenger RNA (mRNA) of nuclear factor (NF)-κβ, inducible nitric oxide synthase (iNOS), and intercellular adhesion molecule 1 (ICAM1). The data are expressed as mean ± standard error of the mean. Significance is set at P < .05; n = 5 mice per group.
Camel Urine Exhibited Antimetastatic Potential In Vivo
Clonogenic assay was carried out in order to determine the ability of camel urine to disrupt the metastatic potential of the 4T1 cancer cell. Based on Figure 9A, there was significant reduction in the number of colonies formed in the lung of the treated mice as compared to the control mice. About 26 ± 2.31 colonies were formed in the lung of the low-dose treated mice while mice in the high-dose group produced a better result with only 12 ± 1.53 colonies formed as compared to 60.33 ± 9.82 colonies formed in the lung of the control mice. Apart from the clonogenic assay, the presence of abnormal or metastasized cell was also confirmed by the bone marrow smearing assay as depicted in Figure 9B, where there were abnormal cells present in the control group (black arrow) but not in the low-dose and high-dose groups. To further validate the result, the levels of several angiogenesis-related proteins were measured using proteome profiler analysis, and based on Figure 10, their levels decreased in the low-dose and high-dose groups. The proteins measured were GM-CSF, G-CSF, MCP-1, Leptin, and IL-13.
Figure 9.

(A) Analysis of the presence of colonies in the lung excised from the control, low-dose (120 mg/kg), and high-dose (240 mg/kg) treated mice, including representative images. (B) Analysis of the presence of abnormal cells in the bone marrow excised from the control, low-dose (120 mg/kg), and high-dose (240 mg/kg) treated mice. Black arrow depicts the abnormal cells in the bone marrow cell population. The data are expressed as mean ± standard error of the mean. Significance is set at P < .05; n = 5 mice per group.
Figure 10.

Analysis of the proteome profiler of the tumors excised from the control, low-dose (120 mg/kg), and high-dose (240 mg/kg) treated mice. The data are expressed as mean ± standard error of the mean. Significance is set at P < .05; n = 5 mice per group.
Discussion
In order for a substance to work effectively to treat cancer, it has to disrupt several mechanisms and pathways employed by the cancer cell to thrive. Two main targets that can be disrupted are the active proliferation and the metastatic mechanism of the cancer cell. Two different models are utilized to evaluate the capability of camel urine to inhibit cancer cell proliferation and disrupt their metastatic process, which are the in vitro model and the in vivo murine model. In the in vitro study employed, camel urine showed cytotoxic potential against the 4T1 cells in a dose-dependent manner. When the result is transferred to the in vivo murine model for further evaluation, a similar pattern is observed whereby it reduced the size of the tumor in both treated groups significantly through apoptosis. As portrayed by the TUNEL assay, higher frequency of DNA fragmentation took place in the low-dose and high-dose groups as compared to the control group, which is beneficial, as DNA fragmentation is one of the steps that will lead to apoptosis in cancer cells, hence serving as an indicator of the extent of the apoptotic event.14 Further evidence in favor of camel urine as an anticancer agent was the decline in the number of actively dividing cells or mitotic cells in both low-dose and high-dose groups as portrayed by the tumor section stained by hematoxylin and eosin. One of the main properties of the cancer cell is its ability to divide rapidly, as well as being able to sustain itself indefinitely through division.15 Hence, it is vital for an anticancer agent to curtail and halt the mitotic cycle apart from inducing it into the apoptotic state, or else the cancer cell will overwhelm the anticancer agent with sheer numbers after a few cycles.
The immune system plays an important role in cancer progression; hence, it has been studied extensively for decades. It serves as a barrier against pathogens from bacterial or viral infections, which may cause cancer, and serves to inhibit and kill emerging cancer cells.16 Two different subsets of T cell population were investigated in this research, CD3+/CD4+ T helper cells and CD3+/CD8+ cytolytic T cells. The presence of T helper cells and cytolytic T cells in both low-dose and high-dose groups is significantly higher than in the control group. It was reported that cancer patients with high numbers of cytolytic T cells and T helper cells have better prognosis and survival rate.17 The T helper cell is an important mediator, especially the Th1 cell, in activating cytolytic T cells, by secreting several cytokines, such as IFN-γ.18 Apart from that, Th17 helps combat tumor progression by suppressing inflammation through inhibition of inflammation-related cytokines.19 Once activated, cytolytic T cells, commonly referred to as NK-T cells due to the presence of markers and activities similar to natural killer cells, will take part in immunosurveillance by tracking down and killing the cancer cells through direct lysis of the cells or by secreting cytotoxic cytokines.20,21 Another vital component of the immune system in curtailing the progression of cancer is the NK cell. Based on the flow cytometer analysis, a higher percentage of CD3−/NK1.1+ NK cell is reported in both treated groups at a significant amount. Besides that, the NK cell population in the splenocyte was also assessed by its activity against Yac-1 cells. The Yac-1 cell is a murine T-lymphoma cell that is annihilated by the natural killer cells in the splenocyte, which means a high specific cytotoxicity correlates to high number of NK cells in the splenocyte as observed in the treated groups. The role of NK cells during viral infections such as cytomegalovirus and cancer progression is well established, whereby a higher survival rate is reported in cancer patients with extensive NK cell infiltration into the tumor.22,23 Nonetheless, tumor cells have developed certain mechanisms to induce the microenvironment to become immunosuppressive and halt the antitumor effect of the immune cells. One of the methods employed is the secretion of IL-10.24,25 IL-10 is able to suppress the activation of T cells by inhibiting production of IL-12 and downregulating antigen presentation.26 Hence, it is important for an anticancer compound to disrupt the production of IL-10 by the tumor cells as reported in this research, whereby both treatment groups managed to reduce the concentration of IL-10.
Inflammation occurs either due to infection or is orchestrated by the tumor, influencing various stages of tumor growth from initiation down to the metastatic process.27 As such, inflammation-related pathways have been targeted as a potential treatment option in order to treat cancer.28 Several inflammatory-related genes were investigated in this study, noting the effect that camel urine imposed on their expression. The NF-κβ pathway is one of the few pathways utilized by the cancer cell to induce inflammation through the recruitment of immune cells.29 As observed in the results reported, camel urine is able to reduce NF-κβ mRNA expression in the tumor at both doses, although high-treatment produced better results. Apart from that, the treatment of the mice also downregulated iNOS mRNA expression, which is an important downstream cellular signaling molecule in the NF-κβ pathway.30 iNOS is responsible for the production of NO in the inflammatory process to fight infectious agents, but its role in inflammation-related disease has been counterintuitive.31 The level of NO and MDA, a lipid peroxidative marker, decreased in both treatment groups concurrently with the expression of iNOS. The role of NO in accelerating forward tumor progression by enhancing the angiogenic and metastatic potentials of the tumor cell is well established, and current findings have reported elevated levels of MDA in breast cancer patients.32-34 Apart from iNOS, ICAM is also a downstream cellular molecule that can be activated through the NF-κβ pathway as well whereby its activation is associated with metastatic and malignant potential of several cancers including breast cancer.35-37
The metastatic cascade of cancer cells involves several important steps including migration, invasion, and angiogenesis. The wound healing assay is considered a preliminary screen to establish the antimetastatic potential of any compound, as it is inexpensive and easy to assemble.38 Based on the results obtained, the rate of cell migration toward the center of the well is lower when the IC50 concentration is used. This indicates the potential of camel urine to inhibit cancer cell migration is better at the higher concentration used. Migration or invasion of cancer cells is driven by the chemokine present in the microenvironment and the target organ; therefore, it is imperative for an anticancer compound to inhibit chemotaxis-based migration.39,40 A similar pattern to that observed in the wound healing assay was repeated in the migration and invasion assays, where higher concentrations of camel urine exhibited better activity at inhibiting cancer cell migration through the transwell membrane. Moreover, reduction of IL-1β level has been associated with reduced breast cancer cell migration and invasion and better overall prognosis.41,42
Angiogenesis, the formation of new blood vessels, is critical for a growing tumor because without sufficient oxygen and nutrient supply, the growth will be hindered and the cancer cells at the center of the tumor will undergo necrosis.43 As shown in the mouse aortic ring assay, camel urine halted the formation of new microvessels significantly as compared to the control group. To further verify the potency of camel urine as an anti-angiogenic compound, several angiogenesis-related proteins were investigated as well. Growth factors affect the growth and metastasis of cancer cells; hence, several growth factors were investigated including G-CSF and GM-CSF. G-CSF and GM-CSF are hematopoietic growth factors that induce the differentiation and activation of macrophages and granulocytes.44 When GM-CSF and G-CSF are administered together, they stimulate the pro-angiogenic cells in patients with acute myocardial infarction, which is unfavorable in cancer patients.45 Hence, they are highly expressed in several tumors including invasive breast cancer.46,47 IL-13Rα2 is overexpressed in several human tumors such as derivatives of MDA-MB-231, in which it acts as a high affinity receptor for IL-13.48,49 Binding of IL-13 to the receptor stimulates the formation of tube-like structures and neovascularization in rat cornea as well as activation of VCAM-1, which mediates angiogenesis and leukocyte adherence to the endothelium.50,51 Apart from that, IL-13 will also drive cancer metastasis and invasion through phosphorylation of the ERK1/2 pathway and activation of AP-1 transcription factor.52 Therefore, reduction of IL-13 cytokine concentration in the tumor section of both treated groups is a favorable effect for camel urine. There has been growing interest in developing cancer therapy specifically targeting IL-13 and IL-13Rα2 to treat ovarian cancer.53
Obesity has been linked to increased incidence of breast cancer, and leptin, an adipoctyokine, is linked to obesity in postmenopausal women where a high concentration of leptin is detected as body fat mass increases.54 The epithelial-mesenchymal transition is the first step in the metastatic cascade, and leptin is responsible for inducing the transition through the translocation and accumulation of nuclear β-catenin by phosphorylating GSK3β.55 Leptin also upregulates the expression of IL-1β, which in return leads to the upregulation of VEGF, a key player in angiogenesis.56 Interestingly, leptin was reduced in the high-dose and low-dose treatment groups. Another feature of nuclear β-catenin is to activate MCP-1. MCP-1 is a CC-chemokine that recruits inflammatory monocytes and tumor associated macrophages (TAMs) to promote breast cancer metastasis.57,58 According to the “seed and soil” hypothesis, each cancer type has a specific environment that will cater for its growth and determine the likelihood for the cell to migrate to certain organs.59 For breast cancer cells, they have specific preference to migrate to lung and bone.60 Clonogenic assay, which detects the presence of migrated cell to organs by the growth of colonies, showed reduced colony formation in treated groups. A similar pattern was observed in bone marrow smearing assay as well, where no abnormal cell was observed. This indicates the potential of camel urine in inhibiting the metastatic potential of the 4T1 cancer cell as verified with the proteomic assay.
Conclusion
The capability of camel urine in inhibiting the growth and metastatic potential of 4T1 cells was investigated in this study, and Figure 11 summarizes the effects of camel urine on 4T1 breast cancer cells. Based on the results presented, it is safe to make assumptions that it is capable of inducing cell death of 4T1 cells through DNA fragmentation and regulation of inflammation-related genes. Apart from that, camel urine was also able to disrupt the metastatic mechanism of 4T1 cells through the downregulation of several angiogenesis-related proteins. Hence, it has a potential to be further developed as an anticancer agent for cancer treatment.
Figure 11.

The direct and indirect effects of camel urine on the cancer progression.
Appendix
Preparation of Reagents
Lysis buffer 10× (per 100 mL)
100 mL distilled water
8.26 g NH4Cl
1.19 g NaHCO3
200 µL 0.5 M EDTA
Adjust the pH with 1 N NaOH or 1 N HCL to 7.4
Filter with Millipore vacuum 0.22 µm filter top and store at 4°C
Footnotes
Declaration of Conflicting Interests: The author(s) declared no potential conflicts of interest with respect to the research, authorship, and/or publication of this article.
Funding: The author(s) received no financial support for the research, authorship, and/or publication of this article.
References
- 1. Stewart B, Wild C. World Cancer Report 2014. Lyon, France: International Agency for Research on Cancer; 2014. [Google Scholar]
- 2. Early Breast Cancer Trialists’ Collaborative Group (EBCTCG). Effects of chemotherapy and hormonal therapy for early breast cancer on recurrence and 15-year survival: an overview of the randomised trials. Lancet. 2005;365:1687-1717. [DOI] [PubMed] [Google Scholar]
- 3. Deryugina EI, Quigley JP. Matrix metalloproteinases and tumor metastasis. Cancer Metastasis Rev. 2006;25:9-34. [DOI] [PubMed] [Google Scholar]
- 4. Leber MF, Efferth T. Molecular principles of cancer invasion and metastasis (review). Int J Oncol. 2009;34:881-895. [DOI] [PubMed] [Google Scholar]
- 5. Alzahrani SH, Alharbi AA. Antimicrobial activity of camel’s urine on methicillin-resistant staphylococcus aureus isolated from clinical specimens. Science. 2011;23(1). [Google Scholar]
- 6. Al-Bashan MM. In vitro assessment of the antimicrobial activity and biochemical properties of camel’s urine against some human pathogenic microbes. Middle East J Sci Res. 2011;7:947-958. [Google Scholar]
- 7. Al-Yousef N, Gaafar A, Al-Otaibi B, Al-Jammaz I, Al-Hussein K, Aboussekhra A. Camel urine components display anti-cancer properties in vitro. J Ethnopharmacol. 2012;143:819-825. [DOI] [PubMed] [Google Scholar]
- 8. Alghamdi Z, Khorshid F. Cytotoxicity of the urine of different camel breeds on the proliferation of lung cancer cells, A549. J Nat Sci Res. 2012;2(5):9-16. [Google Scholar]
- 9. Mosmann T. Rapid colorimetric assay for cellular growth and survival: application to proliferation and cytotoxicity assays. J Immunol Methods. 1983;65:55-63. [DOI] [PubMed] [Google Scholar]
- 10. Liang CC, Park AY, Guan JL. In vitro scratch assay: a convenient and inexpensive method for analysis of cell migration in vitro. Nat Protoc. 2007;2:329-333. [DOI] [PubMed] [Google Scholar]
- 11. Baker M, Robinson SD, Lechertier T, et al. Use of the mouse aortic ring assay to study angiogenesis. Nat Protoc. 2012;7:89-104. [DOI] [PubMed] [Google Scholar]
- 12. Ali A, Khorshid F, Abu-araki H, Osman A. Tumor lung cancer model for assessing anti-neoplastic effect of PMF in rodents: histopathological study. Trends Appl Sci Res. 2011;6:1214-1221. [Google Scholar]
- 13. Suhail M, Suhail S, Gupta BK, Bharat V. Malondialdehyde and antioxidant enzymes in maternal and cord blood, and their correlation in normotensive and preeclamptic women. J Clin Med Res. 2009;1:150-157. [DOI] [PMC free article] [PubMed] [Google Scholar]
- 14. Vermeulen K, Van Bockstaele DR, Berneman ZN. Apoptosis: mechanisms and relevance in cancer. Ann Hematol. 2005;84:627-639. [DOI] [PubMed] [Google Scholar]
- 15. Hanahan D, Weinberg RA. The hallmarks of cancer. Cell. 2000;100:57-70. [DOI] [PubMed] [Google Scholar]
- 16. Toubi E, Shoenfeld Y. Protective autoimmunity in cancer. Oncol Rep. 2007;17:245-251. [PubMed] [Google Scholar]
- 17. Laghi L, Bianchi P, Miranda E, et al. CD3+ cells at the invasive margin of deeply invading (pT3-T4) colorectal cancer and risk of post-surgical metastasis: a longitudinal study. Lancet Oncol. 2009;10:877-884. [DOI] [PubMed] [Google Scholar]
- 18. Nishimura T, Nakui M, Sato M, et al. The critical role of Th1-dominant immunity in tumor immunology. Cancer Chemother Pharmacol. 2000;46(1):S52-S61. [DOI] [PubMed] [Google Scholar]
- 19. Erdman SE, Sohn JJ, Rao VP, et al. CD4+ CD25+ regulatory lymphocytes induce regression of intestinal tumors in ApcMin/+ mice. Cancer Res. 2005;65:3998-4004. [DOI] [PubMed] [Google Scholar]
- 20. Ramakrishnan R, Assudani D, Nagaraj S, et al. Chemotherapy enhances tumor cell susceptibility to CTL-mediated killing during cancer immunotherapy in mice. J Clin Invest. 2010;120:1111-1124. [DOI] [PMC free article] [PubMed] [Google Scholar]
- 21. Huang LP, Lyu S-C, Clayberger C, Krensky AM. Granulysin-mediated tumor rejection in transgenic mice. J Immunol. 2007;178:77-84. [DOI] [PMC free article] [PubMed] [Google Scholar]
- 22. Coca S, Perez-Piqueras J, Martinez D, et al. The prognostic significance of intratumoral natural killer cells in patients with colorectal carcinoma. Cancer. 1997;79:2320-2328. [DOI] [PubMed] [Google Scholar]
- 23. Malmberg KJ, Bryceson YT, Carlsten M, et al. NK cell-mediated targeting of human cancer and possibilities for new means of immunotherapy. Cancer Immunol Immunother. 2008;57:1541-1552. [DOI] [PMC free article] [PubMed] [Google Scholar]
- 24. Sharma S, Stolina M, Lin Y, et al. T cell-derived IL-10 promotes lung cancer growth by suppressing both T cell and APC function. J Immunol. 1999;163:5020-5028. [PubMed] [Google Scholar]
- 25. Jarnicki AG, Lysaght J, Todryk S, Mills KH. Suppression of antitumor immunity by IL-10 and TGF-β-producing T cells infiltrating the growing tumor: influence of tumor environment on the induction of CD4+ and CD8+ regulatory T cells. J Immunol. 2006;177:896-904. [DOI] [PubMed] [Google Scholar]
- 26. de Vries JE. Immunosuppressive and anti-inflammatory properties of interleukin 10. Ann Med. 1995;27:537-541. [DOI] [PubMed] [Google Scholar]
- 27. Karin M. Nuclear factor-κB in cancer development and progression. Nature. 2006;441:431-436. [DOI] [PubMed] [Google Scholar]
- 28. Yamamoto Y, Gaynor RB. Therapeutic potential of inhibition of the NF-κB pathway in the treatment of inflammation and cancer. J Clin Invest. 2001;107:135-142. [DOI] [PMC free article] [PubMed] [Google Scholar]
- 29. Grivennikov SI, Greten FR, Karin M. Immunity, inflammation, and cancer. Cell. 2010;140:883-899. [DOI] [PMC free article] [PubMed] [Google Scholar]
- 30. Buffoli B, Pechánová O, Kojšová S, et al. Provinol prevents CsA-induced nephrotoxicity by reducing reactive oxygen species, iNOS, and NF-kB expression. J Histochem Cytochem. 2005;53:1459-1468. [DOI] [PMC free article] [PubMed] [Google Scholar]
- 31. Kim Y, Zhao R, Park S, et al. Anti-inflammatory effects of liquiritigenin as a consequence of the inhibition of NF-κB-dependent iNOS and proinflammatory cytokines production. Br J Pharmacol. 2008;154:165-173. [DOI] [PMC free article] [PubMed] [Google Scholar]
- 32. Weiming X, Liu LZ, Loizidou M, Ahmed M, Charles IG. The role of nitric oxide in cancer. Cell Res. 2002;12:311-320. [DOI] [PubMed] [Google Scholar]
- 33. Fukumura D, Kashiwagi S, Jain RK. The role of nitric oxide in tumour progression. Nat Rev Cancer. 2006;6:521-534. [DOI] [PubMed] [Google Scholar]
- 34. Kilic N, Taslipinar MY, Guney Y, Tekin E, Onuk E. An investigation into the serum thioredoxin, superoxide dismutase, malondialdehyde, and advanced oxidation protein products in patients with breast cancer. Ann Surg Oncol. 2014;21:4139-4143. [DOI] [PubMed] [Google Scholar]
- 35. Tak PP, Firestein GS. NF-κB: a key role in inflammatory diseases. J Clin Invest. 2001;107:7-11. [DOI] [PMC free article] [PubMed] [Google Scholar]
- 36. Roland CL, Harken AH, Sarr MG, Barnett CC. ICAM-1 expression determines malignant potential of cancer. Surgery. 2007;141:705-707. [DOI] [PubMed] [Google Scholar]
- 37. Rosette C, Roth RB, Oeth P, et al. Role of ICAM1 in invasion of human breast cancer cells. Carcinogenesis. 2005;26:943-950. [DOI] [PubMed] [Google Scholar]
- 38. Rodriguez LG, Wu X, Guan JL. Wound-healing assay. Methods Mol Biol. 2005;294:23-29. [DOI] [PubMed] [Google Scholar]
- 39. Fernandis AZ, Prasad A, Band H, Klösel R, Ganju RK. Regulation of CXCR4-mediated chemotaxis and chemoinvasion of breast cancer cells. Oncogene. 2004;23:157-167. [DOI] [PubMed] [Google Scholar]
- 40. Wang SJ, Saadi W, Lin F, Nguyen CMC, Jeon NL. Differential effects of EGF gradient profiles on MDA-MB-231 breast cancer cell chemotaxis. Exp Cell Res. 2004;300:180-189. [DOI] [PubMed] [Google Scholar]
- 41. Voronov E, Shouval DS, Krelin Y, et al. IL-1 is required for tumor invasiveness and angiogenesis. Proc Natl Acad Sci U S A. 2003;100:2645-2650. [DOI] [PMC free article] [PubMed] [Google Scholar]
- 42. Bae S, Han J, Kim S, et al. Abstract P2-09-19: Zerumbone suppresses IL-1b-induced cell migration and invasion through inhibition of IL-8 expression and MMP3 expression in human triple negative breast cancer cells. Cancer Res. 2013;73(24 suppl):P2-09-19-P02-09-19. [Google Scholar]
- 43. Carmeliet P, Jain RK. Angiogenesis in cancer and other diseases. Nature. 2000;407:249-257. [DOI] [PubMed] [Google Scholar]
- 44. Francisco-Cruz A, Aguilar-Santelises M, Ramos-Espinosa O, et al. Granulocyte–macrophage colony-stimulating factor: not just another haematopoietic growth factor. Med Oncol. 2014;31:774. [DOI] [PubMed] [Google Scholar]
- 45. Bruno S, Bussolati B, Scacciatella P, et al. Combined administration of G-CSF and GM-CSF stimulates monocyte-derived pro-angiogenic cells in patients with acute myocardial infarction. Cytokine. 2006;34:56-65. [DOI] [PubMed] [Google Scholar]
- 46. Park BK, Zhang H, Zeng Q, et al. NF-κB in breast cancer cells promotes osteolytic bone metastasis by inducing osteoclastogenesis via GM-CSF. Nat Med. 2007;13:62-69. [DOI] [PubMed] [Google Scholar]
- 47. Natori T, Sata M, Washida M, Hirata Y, Nagai R, Makuuchi M. G-CSF stimulates angiogenesis and promotes tumor growth: potential contribution of bone marrow-derived endothelial progenitor cells. Biochem Biophys Res Commun. 2002;297:1058-1061. [DOI] [PubMed] [Google Scholar]
- 48. Polyak K. Breast cancer: origins and evolution. J Clin Invest. 2007;117:3155-3163. [DOI] [PMC free article] [PubMed] [Google Scholar]
- 49. Fujisawa T, Joshi B, Nakajima A, Puri RK. A novel role of interleukin-13 receptor α2 in pancreatic cancer invasion and metastasis. Cancer Res. 2009;69:8678-8685. [DOI] [PubMed] [Google Scholar]
- 50. Fukushi JI, Ono M, Morikawa W, Iwamoto Y, Kuwano M. The activity of soluble VCAM-1 in angiogenesis stimulated by IL-4 and IL-13. J Immunol. 2000;165:2818-2823. [DOI] [PubMed] [Google Scholar]
- 51. Woo CH, Lim JH, Kim JH. VCAM-1 upregulation via PKCδ-p38 kinase-linked cascade mediates the TNF-α-induced leukocyte adhesion and emigration in the lung airway epithelium. Am J Physiol Lung Cell Mol Physiol. 2005;288:L307-L316. [DOI] [PubMed] [Google Scholar]
- 52. Fujisawa T, Joshi BH, Puri RK. IL-13 regulates cancer invasion and metastasis through IL-13Rα2 via ERK/AP-1 pathway in mouse model of human ovarian cancer. Int J Cancer. 2012;131:344-356. [DOI] [PubMed] [Google Scholar]
- 53. Shimamura T, Husain SR, Puri RK. The IL-4 and IL-13 pseudomonas exotoxins: new hope for brain tumor therapy. Neurosurg Focus. 2006;20(4):E11. [DOI] [PubMed] [Google Scholar]
- 54. Miyoshi Y, Funahashi T, Tanaka S, et al. High expression of leptin receptor mRNA in breast cancer tissue predicts poor prognosis for patients with high, but not low, serum leptin levels. Int J Cancer. 2006;118:1414-1419. [DOI] [PubMed] [Google Scholar]
- 55. Yan D, Avtanski D, Saxena NK, Sharma D. Leptin-induced epithelial-mesenchymal transition in breast cancer cells requires β-catenin activation via Akt/GSK3-and MTA1/Wnt1 protein-dependent pathways. J Biol Chem. 2012;287:8598-8612. [DOI] [PMC free article] [PubMed] [Google Scholar]
- 56. Zhou W, Guo S, Gonzalez-Perez R. Leptin pro-angiogenic signature in breast cancer is linked to IL-1 signalling. Br J Cancer. 2011;104:128-137. [DOI] [PMC free article] [PubMed] [Google Scholar]
- 57. Qian BZ, Li J, Zhang H, et al. CCL2 recruits inflammatory monocytes to facilitate breast-tumour metastasis. Nature. 2011;475:222-225. [DOI] [PMC free article] [PubMed] [Google Scholar]
- 58. Mestdagt M, Polette M, Buttice G, et al. Transactivation of MCP-1/CCL2 by β-catenin/TCF-4 in human breast cancer cells. Int J Cancer. 2006;118:35-42. [DOI] [PMC free article] [PubMed] [Google Scholar]
- 59. Mendoza M, Khanna C. Revisiting the seed and soil in cancer metastasis. Int J Biochem Cell Biol. 2009;41:1452-1462. [DOI] [PMC free article] [PubMed] [Google Scholar]
- 60. Minn AJ, Gupta GP, Siegel PM, et al. Genes that mediate breast cancer metastasis to lung. Nature. 2005;436:518-524. [DOI] [PMC free article] [PubMed] [Google Scholar]