

Summary
There are few long-term nationally representative studies of all-cause mortality among those infected with hepatitis C virus (HCV). When an additional 5 years of data were made publicly available in 2015, the Third National Health and Nutrition Examination Survey Linked Mortality File became the longest nationally representative study in the United States. Our objective was to update the estimated HCV-associated all-cause mortality in the general US population and determine any differences by sex, age and race/ethnicity. HCV status was assessed in 9117 nationally representative adults aged 18–59 years from 1988 to 1994, and mortality follow-up of the same individuals was completed through 2011 and made publicly available in 2015. There were 930 deaths over a median follow-up of 19.8 years. After adjusting for all covariate risk factors, chronic HCV had 2.63 times (95% CI: 1.59–4.37; P=.0002) higher all-cause mortality rate ratio (MRR) compared with being HCV negative. All-cause MRR was stratified by sex, age and race/ethnicity. Only race/ethnicity was a significant effect modifier of MRR (P<.0001) as the highest MRR of chronic HCV compared to HCV negative was 7.48 (95% CI: 2.15–26.10, P=.001) among Mexican Americans, 2.67 (95% CI: 2.67–5.56, P=.009) among non-Hispanic Whites and 2.02 (95% CI: 1.20–3.40, P=.007) among non-Hispanic Blacks. Racial disparity was seen in the all-cause mortality as Mexican Americans with chronic HCV had approximately seven times higher mortality rate than HCV-negative individuals. This suggests that these at-risk individuals should be targeted for HCV screening and treatment, given the availability of new highly effective HCV therapies.
Keywords: hepatitis C virus, Mexican Americans, mortality, racial disparity
1 | INTRODUCTION
Hepatitis C virus (HCV) is a blood-borne infection with a worldwide prevalence of 130–170 million individuals (2%–3% of the world population). 1 The prevalence of chronic HCV is estimated 2.7 million among United States (US) noninstitutionalized civilian population and 3.9 million in the entire US population.2,3 The natural history of untreated chronic HCV is well characterized, with a gradual progression to liver fibrosis and cirrhosis, liver failure and death.4,5 It is the leading cause of chronic liver disease, hepatocellular carcinoma (HCC) and liver transplantation in the USA.6,7 By 2007, deaths in the USA due to HCV surpassed HIV.8 By the end of 2014, oral direct-acting antiviral (DAA) drugs become available, which can completely cure HCV infection in patients by achieving sustained virologic response (SVR).9 The new DAA drugs have improved tolerability, decreased therapy duration, increased SVR and simplified therapy compared to the first-generation therapy based on alpha interferon injections.9 DAA therapy is expected to reduce future all-cause and liver-related morbidity and mortality.10,11 Yet challenges still remain in the USA as the HCV care continuum is failing as only 50% of HCV-infected persons have been tested, only 16% treated and 9% cured.12,13
Based on the National Health and Nutrition Examination Survey (NHANES) in the USA, the number of individuals positive for HCV antibodies (anti-HCV positive) was 3.9 million in 1988–1994 and increased to 4.1 million in 1999–2002.14,15 The number of chronic HCV-infected individuals (anti-HCV positive and HCV RNA positive) in the US population also increased from 2.7 to 3.2 million.14,15 The mortality follow-up of the Third NHANES (NHANES III) participants through 2006 showed that persons with chronic HCV had 2.4 times higher all-cause, 26.5 times higher liver-related and 1.8 times higher nonliver mortality rate ratios compared to HCV-negative individuals.16 The rates confirm that individuals with chronic HCV are at higher risk of mortality and show the opportunity for HCV treatment to reduce both long-term morbidity 10 and mortality.17,18
In 2015, the publicly available NHANES III mortality follow-up data through the end of 2011 became available providing an additional 5 years of follow-up on mortality. This provides the opportunity to provide a longer follow-up time compared to the previous mortality study and is the last set of all-cause mortality data before the advent of DAA therapy in 2014. In addition, during these additional 5 years of follow-up, the US recession (2006–2011) could have exacerbated the effects of HCV on mortality on already vulnerable individuals due to job and health insurance losses, particularly that HCV testing and linkage to care is already suboptimal among racial/ethnic minorities.19 In this study, we evaluated the association of HCV status with all-cause mortality and determined any differences by sex, age and race/ethnicity in a prospective cohort of NHANES participants that is representative of the noninstitutionalized population of US adults. We aimed to identify individuals at highest risk of mortality for a curable disease and that should help prioritize HCV treatment.
2 | METHODS
2.1 | Study participants
Participants included in the analysis were from NHANES III survey aged ≥18 years at initial enrolment and with vital status follow-up data till the end of 2011. Conducted in 1988–1994 by the National Center for Health Statistics, NHANES III is a multistage probability survey designed to represent noninstitutionalized American civilians, which oversampled non-Hispanic Blacks, Mexican Americans and older adults.20,21 Our initial analysis included all participants ≥18 years with eligibility status for mortality follow-up and HCV antibody test (n=16 140). These participants were subsequently narrowed to only 9117 participants aged 18–59 years for whom HCV covariate risk factor information was available so that additional covariate-adjusted analyses could be performed.
2.2 | Study variables
Third National Health and Nutrition Examination Survey includes an interview and physical examination with a blood draw.20 The procedures for the survey and data collection,21 and laboratory procedure 22 have been previously described. Testing for antibody to HCV (anti-HCV) was performed using second-generation enzyme immunoassay (EIA) and supplemental test (EIA 2.0 and HCV MATRIX, Abbott Laboratories North Chicago, IL). Testing for HCV RNA was performed on the anti-HCV- positive samples using reverse-transcriptase polymerase chain reaction amplification of the 5′ noncoding region (Boehringer Mannheim, Boehringer Mannheim Diagnostics, Indianapolis, IN).22 The study independent variable was HCV status with three groups: anti-HCV negative, anti-HCV positive and chronic HCV (anti-HCV positive and HCV RNA positive).
Demographic variables included self-reported age, sex, race/ethnicity (non-Hispanic White, non-Hispanic Black, Mexican American [anyone who describe themselves of Mexican origin], and other [includes other Hispanics, Asians and Native Americans]), marital status, education, smoking status, lifetime number of sex partners, lifetime marijuana and cocaine use, and physical diagnosis of cancer and diabetes. Body mass index (BMI, kg/m2) was calculated using measured height and weight. Self-reported numbers of alcoholic drinks over the previous 30 days were reclassified to drinks/day. Poverty income ratio was calculated using total family income divided by poverty threshold on the year of the interview, as defined by US Census Bureau.
The mortality analysis used the 2015 Public-use Linked Mortality Files, which provides mortality follow-up from the date of the NHANES III survey through 31 December 2011.23 The linkage was done by probabilistic matching to the National Death Index records using 12 identifying variables. The underlying cause of death was recoded to the ten leading causes derived from the International Classification of Disease, 9th edition (ICD-9) for all deaths prior to 1999 and ICD-10 for all deaths after 1998.23 Our primary outcome for this analysis was all-cause mortality. The underlying cause of death available in the Public-use Linked Mortality Files was the leading ten causes of death: disease of the heart, malignant neoplasms, chronic lower respiratory diseases, accidents, cerebrovascular disease, Alzheimer’s disease, diabetes mellitus, influenza and pneumonia, nephritis and nephrotic syndrome, and all other causes of death. This secondary analysis was performed using a de- identified data set.
2.3 | Statistical analysis
All-cause mortality rate and 95% confidence intervals (CI) were calculated by HCV status groups (anti-HCV negative, anti-HCV positive and chronic HCV), and further by sex and age group for all eligible participates aged ≥18 years. Individuals who were anti-HCV positive, but HCV RNA negative were categorized into the anti-HCV- positive group and not the chronic HCV group. Due to small numbers, our primary analysis did not include a separate subgroup of anti-HCV- positive and HCV RNA-negative participants; however, we did calculate the mortality rate in this subgroup to determine which of the HCV status groups this separate subgroup closely resembled. Separate analyses were performed in the subgroup of participants aged 18–59 years (n=9117) comparing baseline demographic characteristics using Wald χ2 or t test and all-cause mortality using weighted Kaplan-Meier survival curves and weighted Cox proportional hazards models with the HCV antibody negative group serving as the reference group. The association between HCV status and all-cause mortality was assessed in three different models measured as a mortality rate ratio (MRR). The first model adjusted for age and sex. The second partially adjusted model additionally included demographics (race/ethnicity, marital status, education and poverty income ratio), lifestyle behaviours (alcohol consumption, smoking, lifetime cocaine and marijuana use, lifetime number of sexual partners), BMI, and comorbidities and viruses (cancer, diabetes, hepatitis A antibody, hepatitis E antibody). The final fully adjusted model additionally adjusted for liver function biomarkers of alanine aminotransferase (ALT) and total bilirubin. The models were stratified by demographic factors: sex, age group (18–40 and 41–59 years) and race/ethnicity (non-Hispanic Whites, non-Hispanic Blacks and Mexican Americans). The stratum-specific findings were then subjected to formal tests (Wald test in the regression model) using interaction terms of HCV status by sex, age group and race/ethnicity, respectively, to determine whether these demographic categories were significant effect modifiers (variable that differentially modifies the observed effect of a risk [HCV status] on disease status [all-cause mortality]). Data management and linkage were performed in SAS version 9.4 (SAS Institute, Inc., Cary, NC) and the statistical analysis was conducted in the R software version 3.2.5 to accommodate the complex survey design of NHANES III.24 All P-values were two-sided and P<.05 was considered statistically significant. No adjustments were included to account for the multiple comparisons.
3 | RESULTS
Among 16 140 NHANES III participants aged ≥18 years, 4947 deaths occurred over a median follow-up of 18.9 years (interquartile range 15.9–20.8 years). There were 4811 deaths among the 15 788 participants who were anti-HCV negative. The top three causes of deaths are as follows: all nonleading causes (28%), a disease of the heart (25%) and malignant neoplasms (22%). Among the 352 participants who were anti-HCV positive, the top three causes of the 136 deaths are as follows: all nonleading causes (44%), malignant neoplasms (16%) and disease of the heart (13%). Lastly, among the 279 participants who were chronic HCV, the top three causes of the 111 deaths are as follows: all nonleading causes (50%), malignant neoplasm (15%) and malignant neoplasms (12%).
Table 1 shows the all-cause mortality rates by HCV status for those aged ≥18 years and stratified by sex and age group. There were 12.6 (95% CI: 11.6–13.7), 17.0 (95% CI: 12.2–23.6) and 19.1 (95% CI: 13.5–27.0) deaths per 1000 person-years for anti-HCV- negative, anti-HCV- positive and chronic HCV individuals, respectively. Among the 73 anti-HCV- positive and HCV RNA-negative patients, the overall mortality rate was 11.3 (95% CI: 5.3–24.1), men only was 10.5 (95% CI: 3.1–35.4), and women only was 12.2 (95% CI: 5.9–25.1) per 1000 person-years. The mortality rate was highest for all chronic HCV individuals compared to anti-HCV- negative and anti-HCV- positive individuals, except among women aged 18–29 years. Anti-HCV- negative men had higher mortality rate than anti-HCV- negative women. However, this pattern was not observed for anti-HCV- positive or chronic HCV individuals as women had higher mortality rates than men (Table 1).
TABLE 1.
All-cause mortality rates of 16 140 participants of NHANES III Aged >18 years, by anti-HCV and HCV RNA status
| Anti-HCV negative | Anti-HCV positive (RNA positive and negative) | Anti-HCV positive and HCV RNA positive (chronic HCV) | ||||
|---|---|---|---|---|---|---|
|
|
|
|
||||
| N | Mortality ratea (95% CI) | N | Mortality ratea (95% CI) | N | Mortality ratea (95% CI) | |
| All participants | 15 788 | 12.6 (11.6–13.7) | 352 | 17.0 (12.2–23.6) | 279 | 19.1 (13.5–27.0) |
|
| ||||||
| Men | ||||||
|
| ||||||
| Total | 7362 | 13.0 (11.9–14.2) | 212 | 15.2 (10.0–23.2) | 174 | 16.6 (10.6–26.1) |
|
| ||||||
| 18–29 y | 1798 | 2.3 (1.5–3.4) | 39 | 1.9 (0.7–5.7) | 33 | 2.4 (0.8–7.3) |
|
| ||||||
| 30–44 y | 1934 | 3.1 (2.4–3.9) | 104 | 12.0 (6.6–22.1) | 92 | 13.6 (7.2–25.8) |
|
| ||||||
| 45–59 y | 1255 | 13.7 (11.8–15.8) | 40 | 27.6 (13.8–55.2) | 31 | 43.4 (24.8–75.8) |
|
| ||||||
| ≥60 y | 2375 | 61.1 (56.4–66.2) | 29 | 150.3 (90.4–250.0) | 18 | 202.5 (108.6–377.8) |
|
| ||||||
| Women | ||||||
|
| ||||||
| Total | 8426 | 12.3 (11.1–13.5) | 140 | 20.3 (12.9–31.8) | 105 | 24.1 (15.1–38.2) |
|
| ||||||
| 18–29 y | 2071 | 1.3 (0.8–2.0) | 19 | 4.3 (1.2–16.1) | 13 | 3.8 (0.8–19.3) |
|
| ||||||
| 30–44 y | 2441 | 2.5 (1.8–3.3) | 69 | 7.6 (3.4–16.6) | 53 | 9.6 (4.2–22.0) |
|
| ||||||
| 45–59 y | 1418 | 9.8 (8.3–11.6) | 28 | 38.4 (21.3–69.3) | 21 | 44.4 (26.9–73.4) |
|
| ||||||
| ≥60 y | 2496 | 50.3 (46.7–54.1) | 24 | 82.2 (56.3–120.1) | 18 | 85.1 (48.8–148.3) |
Deaths per 1000 person-years.
Among participants aged 18–59 years (n=9117), those who were anti-HCV positive or chronic HCV were more likely to be men, non-Hispanic White, nonmarried and current smokers (P<.05) than those who were anti-HCV negative (Table 2). Those who were anti-HCV negative had higher incomes, fewer sexual partners, less cocaine, marijuana and alcohol use, and lower ALT levels (P<.001).
TABLE 2.
Baseline characteristics of 9117 participants of NHANES III aged 18–59 years, by anti-HCV and HCV RNA status
| Characteristica | Anti-HCV negative | Anti-HCV positive (RNA positive and negative) | Anti-HCV positive and HCV RNA positive (chronic HCV) | ||
|---|---|---|---|---|---|
|
|
|
|
|||
| N=8866 | N=251 | P-value* | N=203 | P-value* | |
| Age (y), mean | 36.4 (0.2) | 36.4 (0.9) | .99 | 36.9 (1.0) | .69 |
|
| |||||
| Female, % | 52.1 (0.6) | 31.0 (4.1) | <.001 | 29.0 (5.2) | <.001 |
|
| |||||
| Race/ethnicity, % | |||||
|
| |||||
| Non-Hispanic White | 76.0 (1.4) | 66.8 (4.8) | .006 | 63.9 (5.9) | .006 |
|
| |||||
| Non-Hispanic Black | 10.6 (0.7) | 18.2 (2.4) | 20.4 (3.2) | ||
|
| |||||
| Mexican American | 10.2 (1.0) | 11.2 (2.6) | 10.6 (2.5) | ||
|
| |||||
| Other | 3.2 (0.4) | 3.9 (2.2) | 5.0 (2.8) | ||
|
| |||||
| Married, % | 62.3 (1.1) | 40.3 (4.5) | <.001 | 38.1 (4.7) | <.001 |
|
| |||||
| Non-high school graduate, % | 18.4 (1.1) | 39.8 (4.3) | <.001 | 37.5 (4.5) | <.001 |
|
| |||||
| Current smoker, % | 30.7 (1.0) | 64.2 (5.5) | <.001 | 69.9 (6.2) | <.001 |
|
| |||||
| Poverty income ratio, mean | 3.18 (0.1) | 2.0 (0.2) | <.001 | 1.8 (0.2) | <.001 |
|
| |||||
| Lifetime no. of sex partners, % | |||||
|
| |||||
| 0–1 | 23.7 (0.8) | 5.4 (1.5) | <.001 | 4.0 (1.7) | <.001 |
|
| |||||
| 2–9 | 48.0 (0.9) | 33.1 (5.2) | 37.7 (5.9) | ||
|
| |||||
| 10–49 | 23.9 (1.0) | 43.5 (5.4) | 41.6 (5.9) | ||
|
| |||||
| ≥50 | 4.3 (0.5) | 18.0 (3.2) | 16.6 (0.3) | ||
|
| |||||
| Lifetime cocaine use, % | |||||
|
| |||||
| Never | 87.0 (0.8) | 40.7 (5.6) | <.001 | 39.1 (6.5) | <.001 |
|
| |||||
| 1–10 | 7.9 (0.6) | 17.3 (4.8) | 14.5 (4.2) | ||
|
| |||||
| >10 | 5.5 (0.5) | 42.0 (6.4) | 46.4 (7.2) | ||
|
| |||||
| Lifetime marijuana use, % | |||||
|
| |||||
| Never | 55.2 (1.3) | 20.3 (3.8) | <.001 | 18.8 (4.3) | <.001 |
|
| |||||
| 1–99 times | 33.2 (1.0) | 27.2 (4.0) | 28.0 (4.5) | ||
|
| |||||
| ≥100 | 11.5 (0.6) | 52.5 (5.1) | 53.2 (6.1) | ||
|
| |||||
| Alcohol consumption, % | |||||
|
| |||||
| <1 drinks/day | 91.9 (0.5) | 77.4 (5.6) | .11 | 72.8 (6.5) | .08 |
|
| |||||
| 1–2 drinks/day | 7.1 (0.4) | 15.8 (4.4) | 19.2 (5.6) | ||
|
| |||||
| >2 drinks/day | 1.9 (0.2) | 6.8 (4.7) | 8.1 (6.0) | ||
|
| |||||
| ALT (U/L), mean | 18.0 (0.4) | 38.4 (2.2) | <.001 | 44.2 (3.0) | <.001 |
|
| |||||
| Body mass index (kg/m2), mean | 26.3 (0.1) | 25.6 (0.5) | .18 | 25.5 (0.6) | .20 |
|
| |||||
| Total bilirubin (mg/dL), mean | 10.7 (0.1) | 10.7 (0.6) | .86 | 11 (0.8) | .70 |
Mean (standard error) or % (standard error).
Wald χ2 or t test.
Among the subset of 9117 participants aged 18–59 years, there were 930 deaths over a median follow-up of 19.8 years (interquartile range 18.2–21.2 years). Among the 8866 participants who were anti-HCV negative, there were 861 deaths led by malignant neoplasms (32%) and all nonleading causes (30%). Among the 251 participants who were anti-HCV positive, there were 69 deaths, while among the 203 participants who were chronic HCV deaths, there were 60 deaths, which both were led by nonleading causes of death (46%).
Table 3 shows the MRR was consistently the highest among participants with chronic HCV followed by anti-HCV- positive compared to anti-HCV- negative participants, respectively, for each model adjustment. In the fully adjusted model, being anti-HCV positive was associated with 2.20 times higher mortality rate (95% CI: 1.32–3.66, P=.002) and chronic HCV was associated with 2.63 times higher mortality rate (95% CI: 1.59–4.37, P<.001) compared to anti-HCV- negative participants, respectively.
TABLE 3.
Association between anti-HCV/HCV RNA status and all-cause mortality among 9117 NHANES III participants aged 18–59 years
| Anti-HCV negative N=8866 | Anti-HCV positive (RNA positive and negative) N=251 | Anti-HCV and HCV RNA positive (chronic HCV) N=203 | |||
|---|---|---|---|---|---|
|
|
|
||||
| MRR (95% CI)a | P-value | MRR (95% CI)a | P-value | ||
| All-cause mortality, no. | 861 | 69 | 60 | ||
|
| |||||
| Age and sex adjusted | 1.00 [Reference] | 3.76 (2.43–5.83) | <.001 | 4.59 (2.96–7.11) | <.001 |
|
| |||||
| Partially adjustedb | 1.00 [Reference] | 2.45 (1.51–3.98) | .0003 | 2.95 (1.86–4.69) | <.001 |
|
| |||||
| Fully adjustedc | 1.00 [Reference] | 2.20 (1.32–3.66) | .002 | 2.63 (1.59–4.37) | <.001 |
Mortality rate ratio (95% confidence interval) versus anti-HCV negative.
Partial adjustment: demographics (age, sex, race/ethnicity, marital status, education, poverty income ratio), lifestyle (alcohol consumption, smoking status, lifetime cocaine and marijuana use, lifetime number of sexual partners), body mass index and comorbidities/viruses (cancer, diabetes, hepatitis A antibody, hepatitis E antibody).
Full adjustment factors: partial adjustment factors, liver function biomarkers (ALT, total bilirubin).
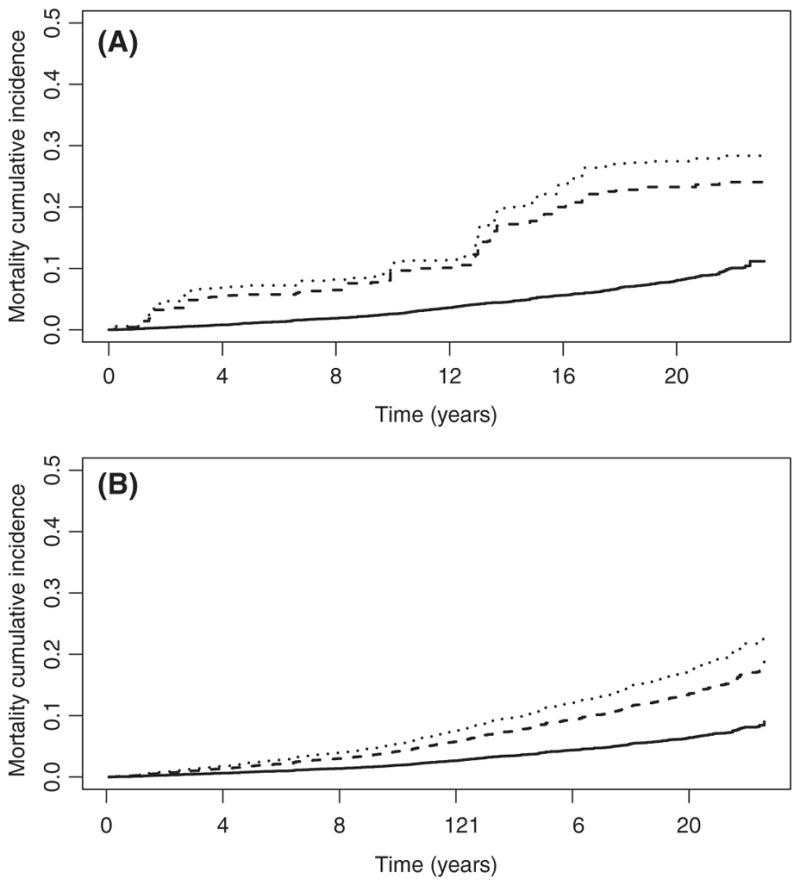
We stratified the MRR for all-cause mortality by race/ethnicity (Table 4), sex (Table 5) and age group (Table 6). Only race/ethnicity was significant as an effect modifier (anti-HCV positive, P<.001; chronic HCV, P<.001) compared to sex (anti-HCV positive, P=.17; chronic HCV, P=.13) and age group (anti-HCV positive P=.14; chronic HCV, P=.05). When stratifying by race/ethnicity in the fully adjusted model, Mexican Americans had the highest MRR for anti-HCV positive (6.22, 95% CI: 2.10–18.44, P=.001) and chronic HCV (7.48, 95% CI: 2.15–26.10, P=.001), compared to non-Hispanic Blacks and non-Hispanic Whites (Table 4). Figure 1 shows the overall estimated unadjusted and adjusted mortality cumulative incidence (covariates set at survey-weighted means) by HCV status. The mortality cumulative incidence among anti-HCV- positive and chronic HCV-infected participants appears to be increasing at a slower rate during the last 5 years of follow-up. Based on the significant findings for race/ethnicity, Figure 2A–C has the adjusted mortality cumulative incidence stratified by race/ethnicity. Both non-Hispanic Blacks and Mexican Americans show a rapid increase in the first 2 years and then gradual increase including the last 5 years of follow-up.
TABLE 4.
The association between anti-HCV/HCV RNA status and all-cause mortality among 9117 NHANES III participants aged 18–59 years by race/ethnicity
| Anti-HCV negative | Anti-HCV positive (RNA positive and negative) | Anti-HCV and HCV RNA positive (chronic HCV) | |||
|---|---|---|---|---|---|
|
|
|
||||
| MRR (95% CI)a | P-value | MRR (95% CI)a | P-value | ||
| Non-Hispanic White | |||||
|
| |||||
| Total no. (N) | 3169 | 60 | 44 | ||
|
| |||||
| All-cause mortality (n) | 320 | 13 | 11 | ||
|
| |||||
| Age-and sex adjusted | 1.00 [Reference] | 3.52 (1.78–6.98) | .0003 | 4.52 (2.28–8.96) | <.001 |
|
| |||||
| Partially adjustedb | 1.00 [Reference] | 2.30 (1.09–4.83) | .03 | 3.10 (1.53–6.29) | .002 |
|
| |||||
| Fully adjustedc | 1.00 [Reference] | 2.04 (0.96–4.32) | .062 | 2.67 (1.28–5.56) | .009 |
|
| |||||
| Non-Hispanic Black | |||||
|
| |||||
| Total no. (N) | 2668 | 104 | 92 | ||
|
| |||||
| All-cause mortality (n) | 329 | 32 | 28 | ||
|
| |||||
| Age and sex adjusted | 1.00 [Reference] | 3.45 (2.12–5.62) | <.0001 | 3.38 (1.98–5.76) | <.001 |
|
| |||||
| Partially adjustedb | 1.00 [Reference] | 2.63 (1.77–3.91) | <.0001 | 2.45 (1.58–3.81) | <.001 |
|
| |||||
| Fully adjustedc | 1.00 [Reference] | 2.25 (1.39–3.63) | .001 | 2.02 (1.20–3.40) | .007 |
|
| |||||
| Mexican Americans | |||||
|
| |||||
| Total number (N) | 2905 | 84 | 64 | ||
|
| |||||
| All-cause mortality (n) | 206 | 24 | 21 | ||
|
| |||||
| Age and sex adjusted | 1.00 [Reference] | 4.25 (1.70–10.56) | .002 | 6.18 (2.52–15.14) | <.001 |
|
| |||||
| Partially adjustedb | 1.00 [Reference] | 6.02 (2.22–16.30) | .0004 | 6.78 (2.20–20.90) | .001 |
|
| |||||
| Fully adjustedc | 1.00 [Reference] | 6.22 (2.10–18.42) | .001 | 7.48 (2.15–26.10) | .002 |
Mortality rate ratio (95% confidence interval) versus anti-HCV negative.
Partial adjustment: demographics (age, sex, marital status, education, poverty income ratio), lifestyle (alcohol consumption, smoking status, lifetime cocaine and marijuana use, lifetime number of sexual partners), body mass index and comorbidities/viruses (cancer, diabetes, hepatitis A antibody, hepatitis E antibody).
Full adjustment factors: partial adjustment factors, liver function biomarkers (ALT, total bilirubin).
TABLE 5.
The association between anti-HCV/HCV RNA status and all-cause mortality among 9117 NHANES III participants aged 18–59 years by sex
| Anti-HCV negative | Anti-HCV positive (RNA positive and negative) | Anti-HCV and HCV RNA positive (chronic HCV) | |||
|---|---|---|---|---|---|
|
|
|
||||
| MRR (95% CI) | P-value | MRR (95% CI) | P-value | ||
| Women | |||||
|
| |||||
| Total number (N) | 4947 | 102 | 77 | ||
|
| |||||
| All-cause mortality (n) | 385 | 25 | 20 | ||
|
| |||||
| Age adjusted | 1.00 [Reference] | 4.72 (2.56–8.69) | <.0001 | 5.98 (3.4–10.50) | <.001 |
|
| |||||
| Partially adjustedb | 1.00 [Reference] | 2.52 (1.20–5.25) | .01 | 3.11 (1.50–6.43) | .002 |
|
| |||||
| Fully adjustedc | 1.00 [Reference] | 2.37 (1.04–5.39) | .04 | 2.97 (1.24–7.10) | .01 |
|
| |||||
| Men | |||||
|
| |||||
| Total number (N) | 3919 | 149 | 126 | ||
|
| |||||
| All-cause mortality (n) | 476 | 44 | 40 | ||
|
| |||||
| Age adjusted | 1.00 [Reference] | 3.35 (1.91–5.89) | <.0001 | 4.03 (2.23–7.30) | <.001 |
|
| |||||
| Partially adjustedb | 1.00 [Reference] | 2.40 (1.28–4.48) | .006 | 2.90 (1.61–5.22) | .0004 |
|
| |||||
| Fully adjustedc | 1.00 [Reference] | 2.09 (1.09–4.00) | .03 | 2.49 (1.31–4.72) | .005 |
Mortality rate ratio (95% confidence interval) versus anti-HCV negative.
Partial adjustment: demographics (age, race/ethnicity, marital status, education, poverty income ratio), lifestyle (alcohol consumption, smoking status, lifetime cocaine and marijuana use, lifetime number of sexual partners), body mass index and comorbidities/viruses (cancer, diabetes, hepatitis A antibody, hepatitis E antibody).
Full adjustment factors: partial adjustment factors, liver function biomarkers (ALT, total bilirubin).
TABLE 6.
The association between anti-HCV/HCV RNA status and all-cause mortality among 9117 NHANES III participants aged 18–59 years by age group
| Anti-HCV negative | Anti-HCV positive (RNA positive and negative) | Anti-HCV and HCV RNA positive (chronic HCV) | |||
|---|---|---|---|---|---|
|
|
|
||||
| MRR (95% CI) | P-value | MRR (95% CI) | P-value | ||
| 18–40 y | |||||
|
| |||||
| Total number (N) | 5860 | 169 | 136 | ||
|
| |||||
| All-cause mortality (n) | 276 | 35 | 29 | ||
|
| |||||
| Sex adjusted | 1.00 [Reference] | 3.26 (1.70–6.26) | <.001 | 3.50 (1.65–7.46) | .001 |
|
| |||||
| Partially adjustedb | 1.00 [Reference] | 1.90 (0.92–3.94) | .08 | 2.13 (0.99–4.56) | .05 |
|
| |||||
| Fully adjustedc | 1.00 [Reference] | 1.55 (0.77–3.11) | .22 | 1.62 (0.80–3.26) | .18 |
|
| |||||
| 41–59 y | |||||
|
| |||||
| Total number (N) | 3006 | 82 | 67 | ||
|
| |||||
| All-cause mortality (n) | 585 | 34 | 31 | ||
|
| |||||
| Sex adjusted | 1.00 [Reference] | 3.81 (2.26–6.42) | <.001 | 4.90 (2.98–8.07) | <.001 |
|
| |||||
| Partially adjustedb | 1.00 [Reference] | 3.21 (1.72–6.00) | <.001 | 4.17 (2.39–7.29) | <.001 |
|
| |||||
| Fully adjustedc | 1.00 [Reference] | 3.28 (1.63–6.57) | <.001 | 4.76 (2.50–9.10) | <.001 |
Mortality rate ratio (95% confidence interval) versus anti-HCV negative.
Partial adjustment: demographics (sex, race/ethnicity, marital status, education, poverty income ratio), lifestyle (alcohol consumption, smoking status, lifetime cocaine and marijuana use, lifetime number of sexual partners), body mass index and comorbidities/viruses (cancer, diabetes, hepatitis A antibody, hepatitis E antibody).
Full adjustment factors: partial adjustment factors, liver function biomarkers (ALT, total bilirubin).
FIGURE 1.
Survival probability by HCV status, overall. Unadjusted survival probabilities from weighted Kaplan-Meier (panel A) and covariate-adjusted expected survival probabilities from weighted Cox proportional hazard models (panel B)
FIGURE 2.

A, Survival probability by HCV status by non-Hispanic Whites. Unadjusted survival probabilities from weighted Kaplan-Meier (panel a) and covariate-adjusted expected survival probabilities from weighted Cox proportional hazard models (panel b). B, Survival probability by HCV status by non-Hispanic Blacks. Unadjusted survival probabilities from weighted Kaplan-Meier (panel a) and covariate-adjusted expected survival probabilities from weighted Cox proportional hazard models (panel b). C, Survival probability by HCV status by Mexican Americans. Unadjusted survival probabilities from weighted Kaplan-Meier (panel a) and covariate-adjusted expected survival probabilities from weighted Cox proportional hazard models (panel b)
4 | DISCUSSION
Based on a large representative sample of US adults enrolled in the 1988–1994 NHANES III study and the follow-up until 2011, we found an increase in the all-cause mortality rate, overall and by sex and age, compared to those reported in 2006.16 The mortality rate was highest in chronic HCV patients. Our study did show effect modification by race/ethnicity with a statistically significant difference in the relationship between HCV status (both anti-HCV positive and chronic HCV) and all-cause mortality, but the relationship did not significantly differ by age or sex. Mexican Americans had a higher all-cause MRR than non-Hispanic Whites and non-Hispanic Blacks in all three different (initial, partial, and fully) models after adjusting for known confounding factors including demographics, lifestyle behaviours and clinical factors (BMI, comorbidities and other viruses). A potential cause of the higher all-cause mortality among Mexican Americans is a lack of health insurance, which would likely have long-term effects on the HCV care continuum for these patients. Based on the National Health Interview Survey (2008–2010), Hispanics had the highest percentage without health insurance at 41%, while non-Hispanic Blacks were 26% and non-Hispanic Whites at 16%.25
With additional five years of follow-up data, we expected and observed more deaths with an increase in all-cause mortality rates. We were surprised to find that women had a higher overall all-cause mortality rate than men for the anti-HCV positive and chronic HCV, but not among the anti-HCV- negative group, which is contrary to the previous results from the NHANES III mortality data of 2006.16 However, during stratification by sex, there was no statistically significant effect on the mortality ratio by HCV status to suggest any effect modification, even when adjusting for age and other covariates such as demographics, lifestyle and clinical factors
Our finding of the highest all-cause mortality among Mexican Americans is similar to that seen in liver cancer epidemiology. Hispanics, including Mexican Americans in the USA, have a higher age-adjusted mortality rate for liver cancer particularly HCC when compared to non-Hispanic Whites.26 Specifically, for HCC between 2006 and 2010, Blacks and Hispanics (aged 50–64 years) had a higher incidence and mortality rate than Asians and Pacific Islanders.27 A recent study in 2016 reported that Hispanics born in the USA, particularly males, had a great risk of HCC and death from chronic liver disease than did foreign-born Hispanics.28 In addition, Hispanics with HCV had a higher risk of developing cirrhosis and HCC than non-Hispanic Whites and African American in a large US Veteran Administration cohort. 29 While our study is restricted to all-cause mortality, we hypothesize for liver-related mortality, Mexican Americans and Hispanics will still have a greater mortality compared to non-Hispanic Whites and non-Hispanic Blacks.
Our study had several strengths including using the large representative sample of US adults selected with no prior knowledge of their HCV status, objectively measured HCV antibody and HCV RNA, long follow-up period through 2011, covariates known to impact mortality in these populations to adjust for confounding factors and validation using multiple analysis techniques. These data precede the marketing of DAAs and therefore provide a general sense of survival in the premodern HCV treatment era. Our study had some limitations that should be noted when interpreting the results. First, we only had access to the public-use and not the restricted-use linked mortality files to allow specific analyses on both liver-related and non-liver- related causes of death. This limited our ability to compare results with previous findings in this NHANES III cohort and any stratum-specific findings such as race/ethnicity. Second, NHANES III is an observational study and there are potential unmeasured or excluded confounding factors. We cannot rule out the potential for unmeasured confounders, such as genetic variants and other metabolic-related disorders, as a noncausal source of association; however, we have attempted to mitigate this limitation by controlling for multiple known confounders in the analysis with three different models.
In conclusion, this study suggests a racial disparity and an increase in the all-cause mortality by HCV status in the general US population using NHANES III with follow-up through 2011. Our finding indicates effect modification by race/ethnicity as Mexican Americans with chronic HCV had seven times higher mortality rate than HCV-negative individuals in a fully adjusted model for confounding factors. These findings suggest a need to consider race in the HCV care continuum. Future research is needed to examine whether DAA therapy and changes to health care access to include HCV treatment coverage will translate into population-level changes in overall mortality and by race/ethnic groups.
Abbreviations
- ALT
alanine aminotransferase
- BMI
Body mass index
- CI
confidence intervals
- DAA
direct-acting antiviral
- EIA
enzyme immunoassay
- HCC
hepatocellular carcinoma
- HCV
hepatitis C virus
- MRR
mortality rate ratio
- NHANES
National Health and Nutrition Examination Survey
- SVR
sustained virologic response
Footnotes
CONFLICT OF INTEREST
S.K. reports research grants from Gilead Sciences. All other authors report no potential conflicts. All authors have submitted the ICMJE Form for Disclosure of Potential Conflicts of Interest.
References
- 1.Averhoff FM, Glass N, Holtzman D. Global burden of hepatitis C: considerations for healthcare providers in the United States. Clin Infect Dis. 2012;55(suppl 1):S10–S15. doi: 10.1093/cid/cis361. [DOI] [PubMed] [Google Scholar]
- 2.Denniston MM, Jiles RB, Drobeniuc J, et al. Chronic hepatitis C virus infection in the United States, National Health and Nutrition Examination Survey 2003 to 2010. Ann Intern Med. 2014;160:293–300. doi: 10.7326/M13-1133. [DOI] [PMC free article] [PubMed] [Google Scholar]
- 3.Centers for Disease Control and Prevention. [Accessed June 14, 2016];Viral Hepatitis Surveillance United States, 2014 [Internet] 2014 Available from: http://www.cdc.gov/hepatitis/statistics/2014surveillance/index.htm.
- 4.Chen SL, Morgan TR. The natural history of hepatitis C virus (HCV) infection. Int J Med Sci. 2006;3:47–52. doi: 10.7150/ijms.3.47. [DOI] [PMC free article] [PubMed] [Google Scholar]
- 5.Nelson KE. The impact of chronic hepatitis C virus infection on mortality. J Infect Dis. 2012;206:461–463. doi: 10.1093/infdis/jis394. [DOI] [PubMed] [Google Scholar]
- 6.Davis GL, Alter MJ, El-Serag H, Poynard T, Jennings LW. Aging of hepatitis C virus (HCV)-infected persons in the United States: a multiple cohort model of HCV prevalence and disease progression. Gastroenterology. 2010;138:513–521. doi: 10.1053/j.gastro.2009.09.067. [DOI] [PubMed] [Google Scholar]
- 7.Kabiri M, Jazwinski AB, Roberts MS, Schaefer AJ, Chhatwal J. The changing burden of hepatitis C virus infection in the United States: model-based predictionsthe changing burden of hepatitis C virus infection. Ann Intern Med. 2014;161:170–180. doi: 10.7326/M14-0095. [DOI] [PMC free article] [PubMed] [Google Scholar]
- 8.Ly KN, Xing J, Klevens RM, Jiles RB, Ward JW, Holmberg SD. The increasing burden of mortality from viral hepatitis in the United States between 1999 and 2007. Ann Intern Med. 2012 Feb 21;156:271–278. doi: 10.7326/0003-4819-156-4-201202210-00004. [DOI] [PubMed] [Google Scholar]
- 9.Kohli A, Shaffer A, Sherman A, Kottilil S. Treatment of hepatitis C: a systematic review. JAMA. 2014;312:631–640. doi: 10.1001/jama.2014.7085. [DOI] [PubMed] [Google Scholar]
- 10.Innes HA, McDonald SA, Dillon JF, et al. Toward a more complete understanding of the association between a hepatitis C sustained viral response and cause-specific outcomes. Hepatology. 2015;62:355–364. doi: 10.1002/hep.27766. [DOI] [PubMed] [Google Scholar]
- 11.Dieperink E, Pocha C, Thuras P, Knott A, Colton S, Ho SB. All-cause mortality and liver-related outcomes following successful antiviral treatment for chronic hepatitis C. Dig Dis Sci. 2014;59:872–880. doi: 10.1007/s10620-014-3050-5. [DOI] [PubMed] [Google Scholar]
- 12.Yehia BR, Schranz AJ, Umscheid CA, Lo Re V. The treatment cascade for chronic hepatitis C virus infection in the United States: a systematic review and meta-analysis. PLoS ONE. 2014;9:e101554. doi: 10.1371/journal.pone.0101554. [DOI] [PMC free article] [PubMed] [Google Scholar]
- 13.Holmberg SD, Spradling PR, Moorman AC, Denniston MM. Hepatitis C in the United States. N Engl J Med. 2013;368:1859–1861. doi: 10.1056/NEJMp1302973. [DOI] [PMC free article] [PubMed] [Google Scholar]
- 14.Alter MJ, Kruszon-Moran D, Nainan OV, et al. The prevalence of hepatitis C virus infection in the United States, 1988 through 1994. N Engl J Med. 1999;341:556–562. doi: 10.1056/NEJM199908193410802. [DOI] [PubMed] [Google Scholar]
- 15.Armstrong GL, Wasley A, Simard EP, McQuillan GM, Kuhnert WL, Alter MJ. The prevalence of hepatitis C virus infection in the United States, 1999 through 2002. Ann Intern Med. 2006;144:705–714. doi: 10.7326/0003-4819-144-10-200605160-00004. [DOI] [PubMed] [Google Scholar]
- 16.El-Kamary SS, Jhaveri R, Shardell MD. All-cause, liver-related, and non-liver- related mortality among HCV-infected individuals in the general US population. Clin Infect Dis. 2011;53:150–157. doi: 10.1093/cid/cir306. [DOI] [PMC free article] [PubMed] [Google Scholar]
- 17.van der Meer AJ, Veldt BJ, Feld JJ, et al. Association between sustained virological response and all-cause mortality among patients with chronic hepatitis c and advanced hepatic fibrosis. JAMA. 2012;308:2584–2593. doi: 10.1001/jama.2012.144878. [DOI] [PubMed] [Google Scholar]
- 18.Dieperink E, Pocha C, Thuras P, Knott A, Colton S, Ho SB. All-cause mortality and liver-related outcomes following successful antiviral treatment for chronic hepatitis C. Dig Dis Sci. 2014;59:872–880. doi: 10.1007/s10620-014-3050-5. [DOI] [PubMed] [Google Scholar]
- 19.Tohme RA, Xing J, Liao Y, Holmberg SD. Hepatitis C testing, infection, and linkage to care among racial and ethnic minorities in the United States, 2009–2010. Am J Public Health. 2013;103:112–119. doi: 10.2105/AJPH.2012.300858. [DOI] [PMC free article] [PubMed] [Google Scholar]
- 20.National Center for Health Statistics, Centers C for DC and PWS. [Accessed October 23, 2015];National Health and Nutrition Examination Survey [Internet] [cited October 1, 2015]. Available from: http://www.cdc.gov/nchs/nhanes/nh3data.htm.
- 21.Ezzati TM, Massey JT, Waksberg J, Chu A, Maurer KR. Sample design: Third National Health and Nutrition Examination Survey. Vital Health Stat 2. 1992;113:1–35. [PubMed] [Google Scholar]
- 22.Gunter EW, Lewis BG, Koncikowski SM. Laboratory Procedures Used for the Third National Health and Nutrition Examination Survey (NHANES III), 1988–1994 [Internet] Atlanta, GA: National Center for Environmental Health, Centers for Disease Control and Prevention, Public Health Service, US Department of Health and Human Services; 1996. [Accessed October 23, 2015]. Available from: http://www.cdc.gov/nchs/data/nhanes/nhanes3/cdrom/nchs/manuals/labman.pdf. [Google Scholar]
- 23.National Center for Health Statistics C for DC and PWS. Office of Analysis and Epidemiology, Public-use Linked Mortality File, 2015 [Internet] Hyattsville, Maryland: [Accessed October 23, 2015]. [cited August 1, 2015]. Available from: http://www.cdc.gov/nchs/data_access/data_linkage/mortality.htm. [Google Scholar]
- 24.R Development Core Team. R: A Language and Environment for Statistical Computing [Internet] Vienna, Austria: R Foundation for Statistical Computing; 2015. [Accessed October 23, 2015]. Available from: http://www.R-project.org. [Google Scholar]
- 25.Mooneshinghe R, Chang M, Truman BI. MMWR [Internet] 3. Vol. 62. United States: 2013. Nov 22, [Accessed May 17, 2016]. Health Insurance Coverage — United States, 2008 and 2010. [cited May 17, 2016] Available from: http://www.cdc.gov/mmwr/preview/mmwrhtml/su6203a10.htm?s_cid=su6203a10_w#x2014. 2008 and 2010. [PubMed] [Google Scholar]
- 26.Haile RW, John EM, Levine AJ, et al. A review of cancer in U.S. Hispanic populations. Cancer Prev Res (Phila Pa) 2012;5:150–163. doi: 10.1158/1940-6207.CAPR-11-0447. [DOI] [PMC free article] [PubMed] [Google Scholar]
- 27.Altekruse SF, Henley SJ, Cucinelli JE, McGlynn KA. Changing hepatocellular carcinoma incidence and liver cancer mortality rates in the United States. Am J Gastroenterol. 2014;109:542–553. doi: 10.1038/ajg.2014.11. [DOI] [PMC free article] [PubMed] [Google Scholar]
- 28.Setiawan VW, Wei PC, Hernandez BY, et al. Disparity in liver cancer incidence and chronic liver disease mortality by nativity in Hispanics: the multiethnic cohort. Cancer. 2016;122:1444–1452. doi: 10.1002/cncr.29922. [DOI] [PMC free article] [PubMed] [Google Scholar]
- 29.El-Serag HB, Kramer J, Duan Z, Kanwal F. Racial differences in the progression to cirrhosis and hepatocellular carcinoma in HCV-infected veterans. Am J Gastroenterol. 2014;109:1427–1435. doi: 10.1038/ajg.2014.214. [DOI] [PubMed] [Google Scholar]