Abstract
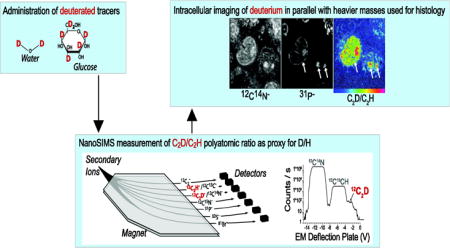
In the field of secondary ion mass spectrometry at nanometer scale (NanoSIMS), configuration of parallel detectors to routinely measure isotope ratios in sub-100 nm domains brings classical stable isotope tracer studies from the whole tissue level down to the suborganelle level. Over the past decade, the marriage of stable isotope tracers with NanoSIMS has been applied to a range of fundamental biological questions that were largely inaccessible by other means. Although multiplexed measurement of different stable isotope tracers is feasible, in practice there remains a gap in the current analytical capacity to efficiently measure stable isotopes commonly utilized in tracer studies. One such example is the measurement of deuterated tracers. The most obvious approach to measuring deuterium/hydrogen isotope ratios is at mass 2/1. However, the radius of the magnetic sector limits concomitant measurement of other masses critical to multiplexed exploration of biological samples. Here we determine the experimental parameters to measure deuterated tracers in biological samples using the C2H− polyatomic ion species (C2D−/C2H−) while operating the NanoSIMS at a reduced Mass Resolving Power of 14,000. Through control of the sputtering parameters, we demonstrate that there is an analytical window during which the C2D−/C2H− isotope ratio can be measured with sufficient precision for biological studies where the degree of D-labeling is typically well above natural abundance. We provide validation of this method by comparing the C2D measurement of D-water labeling in the murine small intestine relative to measurements of native D/H conducted in the same analytical fields. Additional proof-of-concept demonstrations include measurement of D-water, D-glucose, and D-thymidine in biological specimens. Therefore, this study provides a practical template for deuterium-based tracer studies in biological systems.
Graphical abstract
Introduction
Since Schoenheimer pioneered stable isotope methodology to elucidate the dynamic nature of intermediate metabolism[1, 2], stable isotope tracers have been utilized to study a wide array of complex metabolic processes in model organisms and humans[3, 4]. The standard analytical approach is to track label incorporation by isotopic enrichment in tissue or other biological samples with isotope ratio mass spectrometry (IRMS). As is common with analytical methods utilized in biological research, IRMS-based studies require pooling cells to obtain sufficient material for analysis, even with instrumental modifications designed to analyze small sample sizes[5]. The assumption of normality inherent to analyses of pooled cells may obfuscate biologically significant heterogeneity, providing rationale for analytical methods capable of providing quantitative measurements at the level of the single cell.
NanoSIMS is a form of secondary ion imaging mass spectrometry that allows measurement of isotope ratios at the level of a single cell[6, 7], and therefore is a significant advance over classical tracer studies conducted with bulk sample analyses. An ion probe is scanned over a sample surface, resulting in the sputtering of atoms and small molecular fragments, representative of the surface layers. The ionized fraction is guided by ion optics to a double-focusing mass spectrometer where instead of being scanned, the magnetic field is kept constant, allowing for simultaneous measurement of several secondary ions from the same nanovolume. Seven detectors are positioned on trajectories of varying radii, facilitating measurement of different isotopic variants, and in turn isotope ratios, with routine lateral resolution below 100 nm. When merged with stable isotope tracer methodology, the NanoSIMS instrument reveals dynamic functional information in individual cells and organelles in their natural microenvironment, an approach that has illuminated fundamental metabolic pathways in microbes[8–11], plants[12, 13], and mammalian model organisms[14–16].
To date, the majority of studies utilizing NanoSIMS imaging of stable isotopes have been conducted with molecules tagged with 15N or 13C, despite extensive precedent for utilization of deuterated compounds in classical tracer studies. A limitation when the instrument is configured to directly capture hydrogen ions is that the upper mass limit of detection, as constrained by the radius of the magnetic sector, prevents simultaneous acquisition of heavier mass images of interest. Even when the first detector is positioned at a lower radius beyond the manufacturer’s specifications to enable analysis up to mass 27[17], additional ions of interest cannot be measured, including 31P− and 32S− that provide crucial histological information or halogenated tracers[14–16]. The polyatomic ratio of C2D−/C2H− has previously been utilized as a proxy for D/H for analysis of non-biological samples[18]. However, the mass resolving power required to correctly isolate C2D− from its closest isobars was achieved by utilization of a narrower, custom slit. Achievement of such high mass resolution comes at the significant cost of reduced ion transmission, an issue of concern for large-scale biological studies. Here we demonstrate that operation of the NanoSIMS at reduced mass resolving power combined with control of the sputter time allows for the quantification of the C2D−/C2H− ratio with sufficient sensitivity and precision for routine biological applications.
Experimental Section
Materials
Stable isotope tracers, consisting of 2H-thymidine, 15N-thymidine, 2H-water, and 2H-glucose, were obtained from Cambridge Isotope Laboratories, Inc. Paraformaldehyde and osmium tetroxide utilized for tissue fixation and Epon resin used for tissue/cell embedding were obtained from Electron Microscopy Sciences, Inc.
In vivo tracer studies
Male mice on C57Bl/6 genetic background were injected with tracers by intraperitoneal injection. For the thymidine labeling studies, mice received twice daily 500 μg injections for a total of 3 days. 2H-glucose (50mg) was administered by intraperitoneal injection twice daily for 24 hours prior to sacrifice. 2H-water was administered as a single load of 250 μl, followed by daily injections of 60 μl for a total of 3 days. For the human D-water study, the volunteer ingested 400 ml of sterile 2H-water over 15 min, followed by 60 ml daily for 2 additional days, after which peripheral blood was sampled.
Sample preparation
All samples were fixed with 4% paraformaldehyde. Post-fixation with osmium tetroxide was utilized for adipose tissues. Due to its dark staining effect, osmium was also used for white blood cell analyses to assist with location of the cell pellet during embedding and cutting. All samples were embedded in EPON resin, sectioned (0.5 μm), and mounted on silicon chips. Samples were coated with a 15 nm layer of gold, prior to NanoSIMS analysis to prevent charging, which often occurs with resin-embedded biological samples.
NanoSIMS
Analyses were performed on the NanoSIMS 50L (Cameca) at the Brigham and Women’s Center for NanoImaging, where multiplexed labeling experiments now represent the majority of the analytical load, including measurement of deuterium as described here, in conjunction with 13C, 15N, and/or halogens like 81Br. The standard analysis utilizes a 16 keV cesium ion beam for the analysis of negatively charged secondary ions. Through deflection plate peak jumping [18], the 7 detectors can be configured to record 9 masses quasi-simultaneously. This enables the routine acquisition of 12C2−, 12C13C−, 12C2H−, 12 C2D−, 12C14N−, 12C15N−, 31P−, 32S−, and a higher mass such as 81Br− [19, 20]. Specifics regarding the detector configurations are summarized in Supplemental Table 1. Measurement of C2D− and CN− or C2H− and 12C13C− on the same detectors is reliable because the detector responses (measured as the pulse height distribution) to these specific poly-atomic species exhibit minimal difference. When tuning for peak switching, the detectors are adjusted such that the secondary ion beam arrives at the anode within the deflection voltage range where the secondary ion counts are stable. This is particularly important for switching between C2D− and CN−, where 15 V must be applied to the electrostatic plates positioned in front of the detectors in order to span both species. Therefore, by alternating the voltage applied to the plates with successive acquisitions, two different series of images are generated (Supplemental Figure 1). The detectors are aligned such that series 1 acquisition includes: 12C2−, 12C2H−, 12C2D−, 12C15N−, 31P−, 32S−, leaving the 7th detector to capture a higher mass (e.g. 81Br). The series 2 acquisition includes: 12C2−, 12C13C−, 12C14N−, 12C15N−, 31P−, and 32S− with the 7th detector capturing the same species as in series 1 (e.g. 81Br). For each series, the acquisition time is set independently to optimize the counting statistics for the given masses of interest. For species of high yield such as 13C12C− and 12C15N−, for example, we acquire images at a rate of 500 μs/pixel (256 × 256 pixels), in contrast to 2000 μs/pixel for the series containing C2D−.
OpenMIMS
Images were visualized and analyzed, using a custom plugin to ImageJ, called OpenMIMS. The OpenMIMS 3.0 version incorporates a new “interleave” function, which processes image files acquired in the peak-switching, multiple-series mode. In particular, images of the same ionic species, but collected in different series can be merged into a single stack in the order in which they were acquired (Supplemental Figure 1). It is particularly useful to compress image data from different series in this fashion (obtained by peak jumping) when imaging low-yield ions (31P, 81Br), thereby enhancing image quality.
Results and Discussion
Widespread use of deuterated tracers provides rational for their measurement with NanoSIMS
Stable isotope tracers are utilized in a variety of applications; however, they represent a unique tool for in vivo studies, including in humans, because they are innocuous. A PubMed search for “stable isotope,” limited to human studies, underscores this point, demonstrating a time-dependent increase in human stable isotope tracer studies (Figure 1). Of studies on this curated list, deuterium-based tracers were the most commonly utilized (43.4 %), followed closely by 13C studies (43.0 %), and 15N studies (8.8 %) to a much lesser degree. The choice of stable isotope tag in tracer studies may reflect a range of both scientific and practical considerations, including the chemical structure and stability of the tracer molecule (e.g. hydrogen exchange, rapid catabolism), commercial availability, and tracer cost. The historical utilization patterns suggest rationale for the development of a practical approach to measurement of deuterated tracers with the NanoSIMS instrument.
Figure 1. Deuterated metabolic tracers in biomedical research.
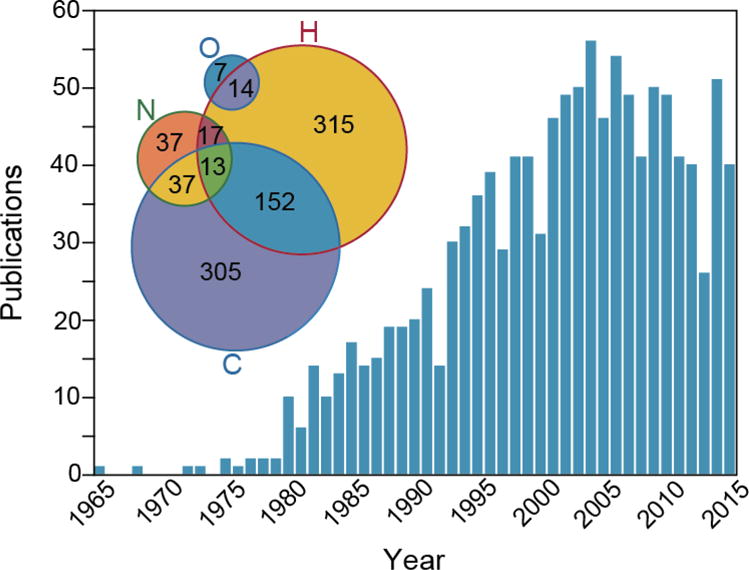
Histogram derived from curated list of human studies with “stable isotope” as a search term. The Venn diagram shown in the inset illustrates the relative utilization of different stable isotope labels. The percentages add up to more than 100% due to the fact that some studies utilize more than one stable isotope tracer. Data derived from n = 1178 papers: H = 511 (43.4%), C = 507 (43%), N = 104 (8.8%). **2 studies (C+O and N+O) excluded from Venn diagram for rendering purposes. Less commonly used elements (Fe, Ca, Zn, Se, Cu, Mg, Mo, Cr, Cd, S, Ni; total 256 studies) not shown in Venn diagram for clarity.
Tracking deuterated tracers with NanoSIMS measurement of C2D/C2H
Our principle rationale to develop the C2D method has been the need to simultaneously acquire masses crucial for histological identification, multiple isotope ratios, and heavier halogens, however, additional factors include: (1) the well-described low instrumental mass fractionation of C2H relative to the native hydrogen, such as the effect of uncorrected magnetic fields leading to a larger dispersion of secondary ions of low mass at the Entrance Slit and (2) the higher ionic yield of polyatomic species relative to the native hydrogen ions[18, 21], including 12CH−, 16OH−, 12C2H− (electron affinities, 1.23 eV, 1.82 eV and 2.96 eV, respectively). An examination of the relative yields of 12CH−, 16OH−, 12C2H− in tissue sections demonstrates that of the three secondary ions, C2H− presents the advantage of a yield that is at least one order of magnitude higher than that of CH− or OH− when measured in tissue sections using similar experimental conditions (Table 1). The substantially lower ion yield of 12CH− and 16OH− provided rationale to develop a method of measuring D/H using C2H− poly-atomic ions. However, this required consideration of the requisite mass resolving power (MRP). The theoretical MRP (M/ΔM) necessary to separate C2D from its closest isobars, 12C13CH and C2H2, is 8900 and 16800 respectively. Complete separation of C2D from C2H2 was previously achieved with a manufacturer-defined MRP (MRPcam)[22, 23] of 24,000, using a 5 μm custom entrance slit (ES), a 40 μm aperture slit (AS), a 20 um ExSlit and an advanced mass resolution protocol[18, 21]. Such resolution is may be required for measurement of D/H isotopic ratios at high precision but comes at the cost of a lower sensitivity. Because many biological studies involving measurement of stable isotope tracers do not require high precision, we explored the possibility of measuring the C2D/C2H ratio while working at a more practical, but reduced MRPcam of 14,000, which is readily accomplished with a configuration available on all NanoSIMS instruments, consisting of a 10 μm entrance slit, an 80 μm aperture slit and a 40 μm Exit Slit.
Table 1. Comparison of the signals from different poly-atomic ions from a small intestine crypt.
The yields for CH−, OH− and C2H− were measured for various Entrance Slit (ES) and Aperture Slit (AS) combinations. The ExSlit width was 40 μm. The Mass Resolving Power exceeded 10000 (MRP definition from Cameca) for each of the ES and AS combinations shown. When available, slit configurations were similar to the published literature
| Poly-atomic ion | ES (μm) | AS (μm) | Counts/s |
|---|---|---|---|
| 12CH− | 10 | 80 | 4.5 × 10³ |
| 12CH− | 20 | 150 | 6.5 × 10³ |
| 12C2H− | 10 | 80 | 6.5 × 10⁴ |
| 12C2H− | 10 | 150 | 1.3 × 10⁵ |
| 16OH− | 10* | 150* | 3.4 × 10³ |
slit configuration used in a study of inorganic samples[23].
Not surprisingly, an MRPcam of 14,000 is not sufficient to fully separate the C2D peak from its closest C2H2 isobar (Figure 2). However, we observed that the evolution of C2H2 yield over time, associated with progressive Cesium dose, differed from the C2D evolution. The High Mass Resolution (HMR) spectra obtained from analysis of an adipose tissue sample, un-enriched in deuterium and embedded in Epon resin, are shown in Figure 2 after different pre-sputtering times. A 60 μm area was sputtered with a 750 pA Cs ion beam, and HMR spectra recorded from a 40 μm scanned field with a 7.5 pA Cs probe after successive 2 min intervals up to 10 min sputtering time. Visual inspection of the HMR plots shows that the C2H2− peak partially overlaps with C2D− at 4 min of sputtering, then increases progressively until a plateau is achieved at approximately 8 min for all isobars at mass 26. The relative contribution of C2H2− to the C2D− signal, based on integration of part of the C2H2− peak is of approximately 20% at 2 min, 40% at 4min, 110 % at 6min and 150% at 8min (Fig 2B). Although it is common practice to pre-sputter a sample for sufficient time, such that image acquisition is performed when the counts of the ions of interest are at the plateau of optimal yield, in this instance, the C2D− peak was more clearly discriminated from the adjacent 13C12CH− and C2H2− peaks at the 2-min time-point, well before the ionic yield reached a plateau. Therefore, these data suggest that the level of C2H2− contribution to the C2D− signal is sputter-time dependent and that a 2 min pre-sputtering duration provided a desirable balance between sensitivity and accuracy.
Figure 2. HMR spectra of secondary ions at mass 26 a.m.u from adipose tissue.
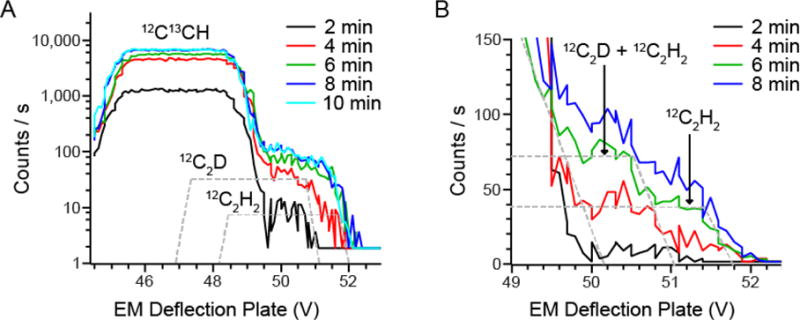
The Mass Resolving Power achieved was 14000 with a 10 μm Entrance Slit, 80 μm Aperture Slit and a 40 μm Exit Slit. HMR plots are shown as function of the voltage applied to the electrostatic plates used for scanning the secondary ions beam in front of the Exit Slit. HMR plot were recorded from a scanned 40 × 40 μm field with a 10 pA Cesium beam after 2 min pre-sputtering intervals of a 60 × 60 μm field size with a 750 pA Cesium beam.
(A) HMR plot of the isobars at mass 26. The more distant CN− isobar is shown in Supplemental Figure 2. The voltage step was 0.146 and the counting time 0.54 s per step.
(B) The HMR for each data point are from the average of 3 HMR spectra acquired with a 0.07 V step and a 0.54 s counting time per step.
The measurement and evolution of the C2D/C2H ratio during image acquisition was evaluated after completing 2 min of pre-sputtering and as a function of different relevant biological matrices. The small intestinal crypt demonstrates micro-heterogeneity due to diverse cell types and subcellular structures, including Paneth cells, which are defined by sulfur-rich granules (Figure 3A). In an analysis of different subcellular domains, including nuclei, cytoplasm, Paneth granules, and embedding resin, the C2D/C2H ratio (Figure 3B) remained stable for approximately the first 100 analytical planes acquired in the same field, before gradually increasing. A similar analysis was performed on an unlabeled section of adipose tissue (Figure 3D), which has a very different molecular composition due to the uniform triglyceride content of the adipocyte-defining lipid droplets. Analysis of lipid droplets could represent the most extreme analytical challenge, due to their disproportionately high carbon and hydrogen content relative to other cellular domains. Similar to the crypt analysis, however, there was a window of stability in the C2D/C2H ratio (Figure 3E) during the initial period of image acquisition. In contrast to the 2.5 pA Cs acquisition probe (260 s/plane) used for the intestinal crypt, the adipose image was acquired with a 7.5 pA probe at a rate of 196 s/plane. The point at which the C2D/C2H ratio began to increase occurred after approximately 25 planes in the adipose sample, rather than after 100 planes in the intestine sample. Despite the different acquisition conditions, the inflection point in the C2D/C2H ratio occurred after a similar cumulative Cs dose, inclusive of both presputtering and acquisition (intestine 100 plane = 3.5*1016 Cs+/cm2; adipose 25 plane = 3.8*1016 Cs+/cm2). Taken together, these results suggest consistent and reproducible stability of the measured C2D/C2H ratio within a window that is restricted to a total Cs dose of < 3.5*1016 Cs+/cm2.
Figure 3. Analytical parameters demonstrating measurement of C2D/C2H as a proxy for D/H.
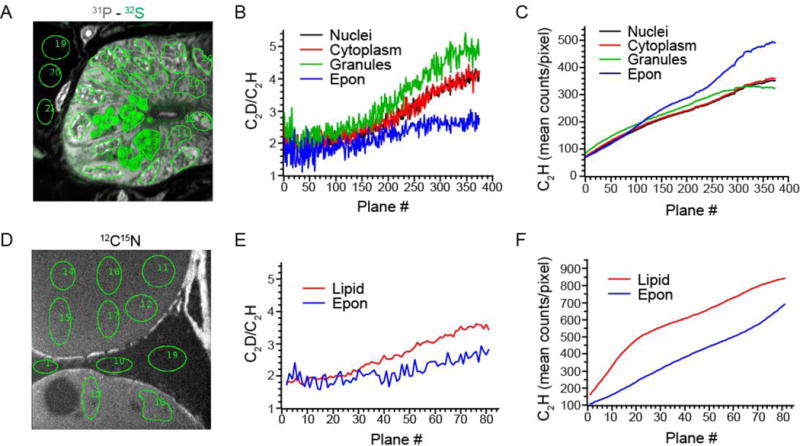
(A) Unlabeled small intestinal crypt. Pseudocolor merged image of the 32S− (green) and 31P− (gray). Image acquired with a 2.5 pA cesium ion current. Acquisition time was 260 s per plane. 45 μm × 45 μm field size, 256 × 256 pixels. Regions of interest (green outline, ~400 pixels/ROI) from which quantitative data was extracted for graphs in B, C.
(B) Mean C2D/C2H ratio*104 for each ROI category shown in (B) as a function of imaging plane measured with a 10 μm Entrance Slit and an 80 μm Aperture Slit.
(C) C2H ion yield as a function of imaging plane for each ROI category as shown in (B).
(D) Unlabeled adipose tissue. Image acquired with a 7.5 pA cesium ion probe. Acquisition time was196 s/plane. 45 μm × 45 μm field size, 256 × 256 pixels. Regions of interest (green outline) from which quantitative data was extracted for graphs in E, F.
(E) Mean C2D/C2H ratio*104 for each ROI category shown in (D) as a function of imaging plane measured with a 10 μm Entrance Slit and an 80 μm Aperture Slit.
(F) C2H ion yield as a function of imaging plane for each ROI category as shown in (D).
The increase in the C2D/C2H ratio observed at the end of the plateau (Figure 3B) confirms an increase in contamination of the C2D− peak by C2H2− and/or 12C13CH− as a function of acquisition time. Although the general trend occurred in each of the analyzed subcellular compartments/matrices, subtle matrix-specific differences were observed. The slopes of the C2D/C2H ratio as a function of acquisition time differed between matrices and the relative differences observed in the stability window were amplified at the end of the analysis (Figure 3B). The smallest time-dependent increase in the C2D/C2H ratio was observed in Epon resin; whereas, the C2H− yields from the same domain exhibited the steepest increase (Figure 3C). Because the C2H− evolution is a proxy for 13C12CH−, we conclude that the dominant source of peak contamination at the C2D− mass line is from C2H2− and that this contribution is likely matrix-dependent.
Examination of C2D measurements in deuterium-labeled biological samples
Because water is a substrate for a wide variety of biosynthetic reactions, tracking its incorporation in suborganelle domains can be utilized as a tracer for biological pathways, including for example DNA synthesis and lipogenesis[24–26]. Therefore, to examine the method parameters in the context of deuterium labeled samples, we analyzed the small intestinal crypt of mice administered D-water, which we have extensively utilized as a model due to its well-defined diversity of cell types and subcellular structures[14]. In the process of analyzing crypts from D-water labeled mice, we found that D-water labeling qualitatively delineates different cellular compartments in the crypt, which we speculate is due to cell-type specific differences in the activity of biosynthetic reactions that utilize water (Figure 4A). For example, the more proliferative crypt base columnar (CBC) progenitor cells are more highly labeled relative to surrounding Paneth cells, with the exception of the highly labeled granules found in the Paneth cell cytoplasm. In experiments where the primarily analytical endpoint depends on the measurement of 13C and/or 15N-tracers, adjunctive labeling and measurement of D-water labeling may provide additional histologic detail that may be particularly useful in complex tissues.
Figure 4. Analytical parameters for measurement of deuterium-labeled samples.
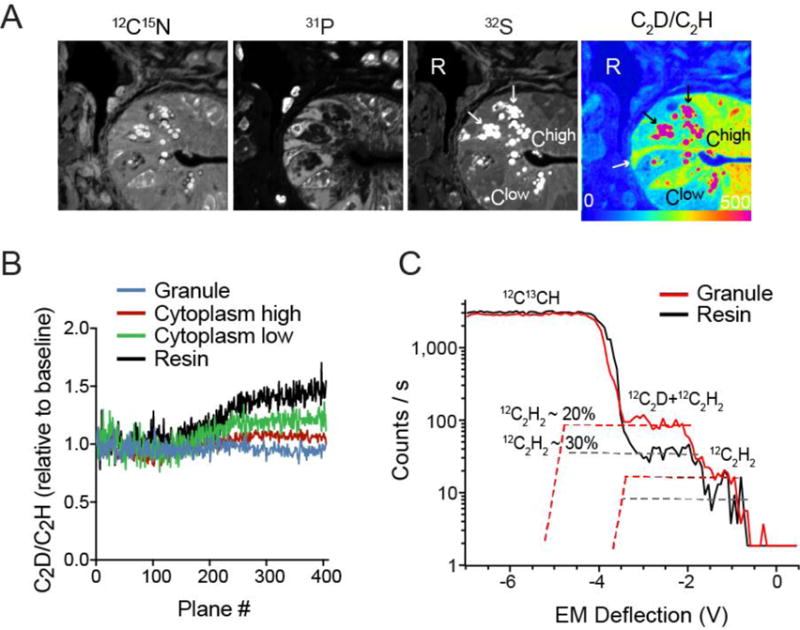
(A) Small intestinal crypt obtained from mouse administered D-water. Cell type specific differences in label incorporation, observable in the ratio image (far right) enhance cells and subcellular structures seen in the single mass images: Black arrows show high labeling in granules which define the Paneth cells at the base of the crypt. The white arrow identifies a representative crypt base columnar (CBC) cell, located between Paneth cells at the base of the crypt, and appear more highly labeled relative to the adjacent Paneth cell cytoplasm. ROIs representing granules (black arrows), resin (R), and regions of high (Chigh) or low (Clow) cytoplasmic labeling were selected for additional analyses shown in B and C.
(B) C2D/C2H ratio normalized to the baseline measurement for each ROI category graphed as a function of imaging plane. Measurements conducted with a 10 μm Entrance Slit and an 80 μm Aperture Slit, and a 40 μm Exit Slit. Data representing the initial window of ratio stability (first 100 planes) and the second higher plateau (planes > 280) are summarized in Table 2.
(C) HMR plot of the isobars at mass 26 not including CN− after completion of extended analysis shown in B. HMR obtained from 10 μm fields containing either resin or granules. An HMR plot of all isobars at mass 26 is shown in supplement figure 2.
The dramatic range in label intensity across subcellular structures – more than two orders of magnitude – provided a good model to further test the method (Figure 4A). In unlabeled small intestinal crypts, the C2H2 contamination of C2D was observed to be as high as 150% (granules), which restricts the measurement of the C2D/C2H ratio to a cumulative Cesium dose of approximately 3.5*1016 Cs+/cm2 (first 100 acquisition planes, Figure 3B). Applying the same analytical approach, we followed the evolution of the C2D/C2H ratio in labeled tissue (Fig 4B). Similar to the trend observed in unlabeled tissue (Fig 3B), the C2D/C2H ratio in all domains exhibited 2 plateaus: a baseline, defined as the first 150 acquisition planes, where the contribution of C2H2 to the C2D peak is minimal followed by a second plateau (plane 280–400) where the contamination due to C2H2 reaches a stable maximum. However, as expected, the relative difference in the ratio value within these two windows (Figure 2B, Table 2), decreases with the increase in deuterium content, consistent with a smaller relative contribution of C2H2 to the C2D peak (Figure 4C). The most striking example was in the highly labeled granules (~800% above background), where the relative inter-plateau difference between the C2D/C2H was 1% relative to a 115% difference in unlabeled granules (Table 2). Interestingly, A similar evolution in the C2D/C2H ratio as a function of the C2H signal, inclusive of two plateaus, was previously documented in D-enriched polystyrene when operating at high mass resolution[18].
Table 2. The effect of D-labeling on the evolution of the C2D/C2H ratio.
After D-water labeling, different domains within the crypt demonstrate different degrees of D-labeling, providing an opportunity to assess the evolution of the C2D/C2H ratio as a function of sputtering depth. An analysis of unlabeled crypt (Figures 2,3) is provided as a reference (right columns). The mean ratio is provided for the first plateau (< 3.5*1016 Cs) and the second plateau.
|
|
|
||||||
|---|---|---|---|---|---|---|---|
| D-labeled
|
D-unlabeled
|
||||||
| C2D/C2H ± s.d.m.
|
C2D/C2H ± s.d.m.
|
||||||
| plateau 1 | plateau 2 | % change | plateau 1 | plateau 2 | % change | ||
|
|
|
||||||
| Resin | 1.76±0.16 | 2.46±0.13 | 40 | 1.74±0.28 | 2.55±0.21 | 46 | |
| Cytoplasm | Low | 4.35±0.48 | 5.28±0.26 | 20 | 2.02±0.22 | 3.98±0.21 | 96 |
| High | 6.53±0.56 | 7.52±0.28 | 15 | ||||
| Granule | 19.6±2.9 | 19.4±1.43 | 1 | 2.24±0.28 | 4.83±0.24 | 115 | |
|
|
|
||||||
Although the method requires control of the presputtering time, such that data acquisition is completed prior to exceeding a total cesium exposure of approximately 3.5*1016 Cs+/cm2, sufficient data is usually obtained well before reaching the cesium dose threshold. Because the increase in C2H2 contamination is also evident in unlabeled material such as embedding resin (Figure 3B,E), stability of the measurements can be verified by tracking the isotope ratio in resin as a function of plane depth. Moreover, in highly labeled samples, monitoring Cesium dose appears to be less of an issue due to the relatively smaller contribution of C2H2. For studies involving measurement of more subtle differences in isotope ratio, however, additional measures and/or alternative approaches will be required. (i) Improved accuracy and precision may be achievable by increasing the stable isotope tracer dose, such that the target range of isotopic enrichment is sufficiently high to limit the contribution of C2H2 (Table 2). (ii) Analysis of unlabeled control tissue of similar composition can provide a matrix specific background reference. (iii) Introduction of a narrower slit as previously demonstrated may be required[18]. (iv) Some situations will require measurement of the native D/H ratio measured and masses greater than 25 acquired in sequence either before or after the D/H measurement, thereby sacrificing analytical throughput. Despite these caveats, we conclude that the measurement of C2D/C2H at reduced MRP provides sufficient accuracy and precision as a proxy for the D/H ratio for many biological applications in which the experimental endpoint requires relative quantification of exogenously administered deuterated tracers.
Correlation between C2D and D measurements of D-water incorporation in murine small intestine
We next conducted a correlative analysis of D-labeled crypts using the C2D method and direct D/H measurements. Because the two ratios cannot be measured simultaneously, we sequentially analyzed the same fields, first measuring C2D/C2H followed by D/H. We present data for two different crypts analyzed at different times and obtained from two different mice, in which the pulse-chase labeling protocol achieved different degrees of labeling. One representative example is shown (Figure 5A), demonstrating qualitative similarity between the C2D/C2H and the D/H ratio images. We then selected regions of interest (ROI) representing subcellular structures (e.g. nuclei, cytoplasm, granules) as performed in prior analyses (Figures 3,4) and compared the two measurements. We found a strong linear correlation in the measurements inclusive of domains ranging from approximately 50 to 1000% labeling above background (slope = 0.93, χ2 = 0.98). The observed minor deviations of individual data points from the regression line likely reflect a combination of factors, including the limits of measurement precision, subtle differences in labeling as a function of depth due to the sequential nature of the analyses, and minor imperfections in alignment of the ROIs in the two images. Nonetheless, these results provide confirmation that the observed labeling in the small intestinal crypt as measured with the C2D polyatomic species was indeed reflective of deuterium incorporation.
Figure 5. Correlation between C2D versus D measurements in deuterium-labeled tissue.
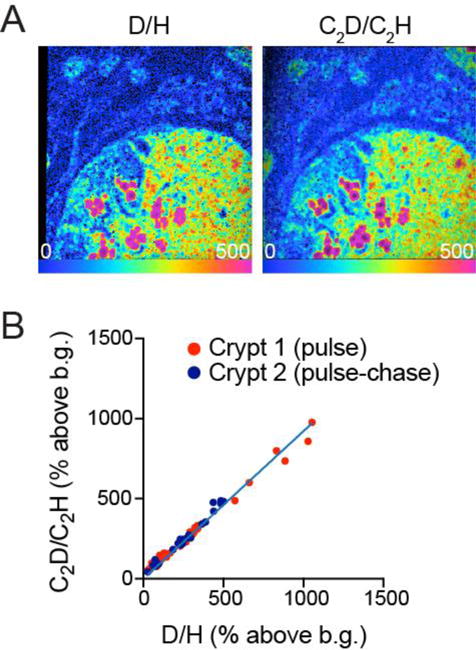
(A) Small intestinal crypt obtained from mouse administered D-water label. The C2D/C2H ratio image (right) was acquired first. The instrument was then re-tuned and the D/H image (left) was acquired.
(B) ROI were selected to represent subcellular structures as in Figures 3,4. The plot represents the correlation between the C2D/C2H and D/H ratios for the same ROIs, expressed as % above background (resin). Two different fields from two different samples were plotted together demonstrating correlation between the two measurements (slope = 0.93, χ2 = 0.98). The distribution from Crypt 2 is lower because the period of pulse labeling was followed by 3 day label free chase, resulting in downward shift in the labeling distribution.
Comparison of the labeling distribution of D-versus 15N-labeled thymidine
As additional validation of the C2D− method, we compared the measurement of D-thymidine incorporation in the small intestinal crypt relative to 15N-thymidine, which we have extensively utilized for biological studies of cell division, in vivo, in model organisms and humans[14–16, 27]. Reasoning that 15N- and D-thymidine should co-localize in the nuclei of dividing cells, mice were administered a cocktail containing equal concentrations of 15N-thymidine and D-thymidine. Figure 6A demonstrates an example of a small intestinal crypt imaged using deflection plate peak switching. In this configuration, ions commonly used for histological identification, including 12C14N−, 31P−, and 32S− were acquired along with the requisite images to generate 12C15N−/12C14N− and 12C2D−/12C2H−. A comparison of the two hue saturation intensity (HSI) images demonstrates a similar labeling pattern with the two tracers, localized in the nuclei of rapidly proliferating intestinal progenitor cells in a chromatin-like pattern. Tracer co-localization was confirmed by a strong linear association between the quantitative intensity of 15N-thymidine labeling and D-thymidine nuclear labeling (Figure 6B). When feasible, such comparisons between the labeling intensities and intracellular distributions of two different stable isotope labels of the same parent molecule administered simultaneously provides an important control, particularly when new D-labels are first tested. Although we cannot exclude the possibility that aspects of thymidine chemistry specific to the D label, such as non-specific hydrogen exchange, modulated the signal-to-background, the concordant labeling distributions of 15N-thymidine and D-thymidine provided reassurance that any such effects were unlikely to change the experimental conclusions.
Figure 6. Comparison of D-thymidine measurement to 15N-thymidine “gold standard”.
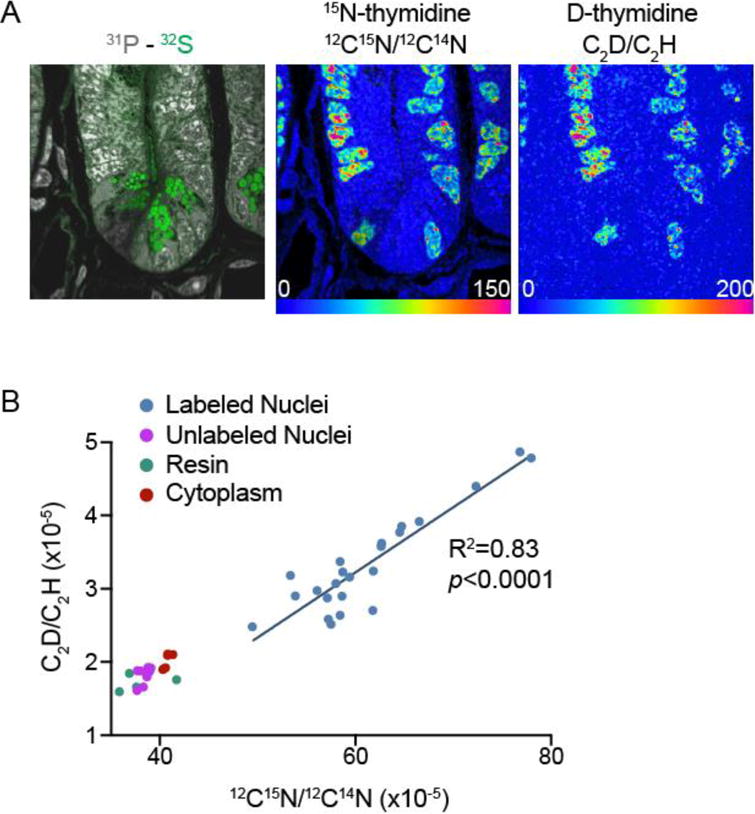
(A) Small intestine crypt images derived from the sum of 75 planes. 60 μm × 60 μm field size (256 pixels × 256 pixels) obtained with a 3.5 pA cesium beam current. The acquisition dwell time was 3ms/pixel for the series 1 with recording of C2H−, C2D− respectively and 0.5ms/pixel for series 2 which included recording of 12C14N− and 12C15N−. The hue saturation intensity (HSI) scale ranges from blue, set to natural background ratio (expressed as 0% above natural ratio), to red, where the ratio is 150% and 200% above background respectively for 15N and D images.
(B) Linear regression analysis (n = 23 15N-labeled nuclei from A) demonstrates strong correlation between C2D-labeling and 15N-labeling.
As an additional example of the C2D method, we show intense D-glucose labeling in lipid droplets in the murine liver (Supplemental Figure 3). Glucose has a much wider range of metabolic fates relative to thymidine. The demonstration of labeling in lipid droplets, however, is indicative of utilization of glucose or its metabolites in de novo lipogenesis, which is involved in the development of fatty liver disease. This example therefore represents one situation where the histological mass images provide metabolic context to the labeling distribution. Together, these examples further establish the possibility of using the C2D method to track deuterated metabolic tracers.
Optimizing throughput of C2D analyses in human white blood cells
Many biological questions to which the NanoSIMS is uniquely suited require analyzing large numbers of cells, particularly when searching for rare labeling events or cellular subpopulations, such as newly formed cells in slow-turnover tissues. Building on prior precedent for utilization of D-water pulse-chase labeling to identify proliferating cells[24], we recently utilized such a labeling strategy to track cell division in humans after validating it against 15N-thymidine labeling as a “gold standard” for cell division[27]. In contrast to thymidine, which accesses the nucleotide salvage pathway of DNA synthesis, water is a non-specific substrate for many biosynthetic reactions, including de novo nucleotide synthesis. In prior work, we have experimentally demonstrated that the rapid replication of the genome during cell division results in a high level of incorporation of D-water relative to quiescent cells[27, 28]. Moreover, the signal above background is more easily discriminated after label-free chase, due to the stability of DNA labeling relative to labeling of cellular constituents that turnover continuously (e.g. protein). Here we provide a similar analysis of human white blood cells after in vivo D-water labeling, in which the analytical goal was to identify a minority subpopulation of highly labeled white blood cells (Figure 7). This analysis reflects iterative improvements in sample preparation and analytical parameters, including:
In contrast to a prior study where human leukocytes were smeared onto silicon chips[14], we now routinely pellet, embed, and section suspension cellular preparations[29]. This approach ensures a maximal number of cells per analytical field, thereby reducing analytical dead-space. Additional time gains are achieved through elimination of an extensive pre-sputtering step to reach a depth where the imaging plane is inclusive of the cell nucleus. Moreover, image quality is improved by analysis of the relatively flat samples.
For each application, the duration of data acquisition per field can be optimized, weighing trade-offs between the desired level of analytical precision and throughput demands. In the proof-of-concept example shown in Figure 7, automated chain analysis mode was applied to acquire 74 individual 40 × 40 μm fields that were tiled together in a mosaic (n = 1107 analyzed cells, 7 minutes per field for the series containing C2D and 2 min for the series containing 12C15N recorded as 5 planes per field). Under these conditions, mass images utilized for histological assessment were of sufficiently high quality to identify leukocyte nuclei and stereotypical features of individual leukocyte subclasses used to generate and categorize ROIs. C2D/C2H counts were not sufficiently high to visualize differential labeling, however extraction of the quantitative ratio data revealed a subpopulation of highly labeled leukocytes. A subset of highly labeled cells was confirmed by imaging for longer duration and at higher resolution (Figure 7, inset). In the example shown in Figure 7, the gain in throughput includes: (i) time saved by running a single rather than two consecutive acquisitions, (ii) time saved by eliminating a retuning step between acquisition of histological images (e.g. CN, 31P, 32S) and measurement of D/H, and (iii) time saved due to the higher ion yield of C2H relative to H, which is as much as 6-fold higher in the nuclei[20]. Therefore, this example underscores the concept that gains in throughput are achievable through calibration of analytical accuracy to the experimental objectives, recognizing the possibility of returning to regions of interest to obtain higher resolution images or increase image acquisition time to verify labeling.
Figure 7. High throughput analysis of D-water labeled human leukocytes.
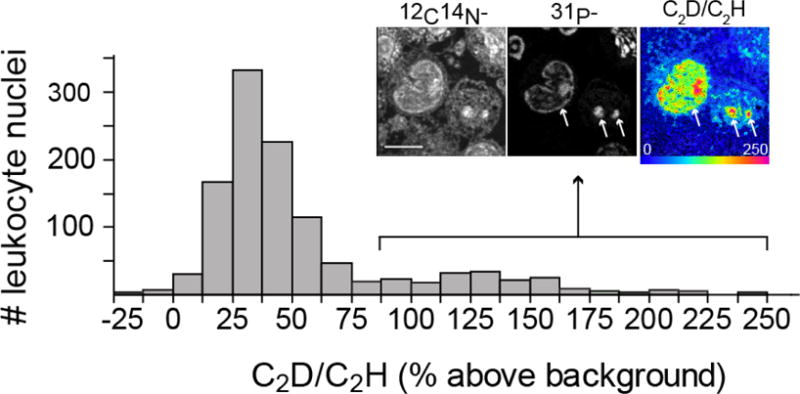
The data shown in the bar graph are from a mosaic made of 74 tiles, individual field sizes = 40 μm × 40 μm, 7 minutes per tile. 1107 cells analyzed. Inset: 17 μm × 17 μm field image from a representative highly labeled leukocyte, 150 planes, 65 s/plane. Scale bar = 5 μm.
Conclusions
The NanoSIMS instrument can precisely measure (ppm) the surface composition of samples at high lateral resolution (< 50 nm), capabilities that have been particularly powerful for applications in the material sciences and cosmochemistry. Operating the instrument to achieve these analytical specifications, however, is impractical for many biological applications where testing a hypothesis of interest may require capturing histological information and multiplexed quantification of different tracers for large swaths of tissue and/or large numbers of cells. Fortuitously, for many biological applications involving stable isotope or halogenated tracers, such a high degree of measurement fidelity is not necessary to achieve the experimental objectives, for example, when the degree of labeling is high and the variable of interest is dichotomous (labeled versus unlabeled) or when relativistic quantification between different organelles or cells is sufficient. The analytical approach presented here reflects such a tradeoff. In using the ratio of C2D/C2H as a surrogate for D/H, and coupled with deflection plate peak switching to increase the number of measured ionic species, we perform multiplexed measurements of stable isotope tracers, including deuterated tracers, while also capturing mass images that are critical for histological characterization (e.g. 12C14N−, 31P−, or 32S−), within a reasonable amount of time. This study underscores the concept that techniques developed to meet the analytical requirements of the non-biological sciences may not be easily adapted to meet the analytical requirements of complex biological specimens. More widespread utilization of NanoSIMS imaging in biology will require continued innovation in areas including sample preparation, seamless integration with complementary imaging modalities, and efficient measurement of the full armamentarium of stable isotope tracers as described in this study.
Supplementary Material
Highlights.
Measurement of deuterated tracers in biological tissues with NanoSIMS
C2D polyatomic species is used as a proxy for native deuterium
Control of sputtering parameters enables measurement of C2D/C2H isotope ratios that are comparable to native D/H measurements
Utilization of C2D as a proxy for native deuterium enables multiplexed measurement of heavier masses crucial for histological imaging
Acknowledgments
This work was supported by a seed grant from the Harvard Stem Cell Institute (M.L.S.) and the NIH DP2CA216362 (M.L.S.).
Footnotes
Publisher's Disclaimer: This is a PDF file of an unedited manuscript that has been accepted for publication. As a service to our customers we are providing this early version of the manuscript. The manuscript will undergo copyediting, typesetting, and review of the resulting proof before it is published in its final citable form. Please note that during the production process errors may be discovered which could affect the content, and all legal disclaimers that apply to the journal pertain.
References
- 1.Schoenheimer R, Rittenberg D. The Application of Isotopes to the Study of Intermediary Metabolism. Science. 1938;87:221–226. doi: 10.1126/science.87.2254.221. [DOI] [PubMed] [Google Scholar]
- 2.Schoenheimer R, Rittenberg D, Foster GL, Keston AS, Ratner S. The Application of the Nitrogen Isotope N15 for the Study of Protein Metabolism. Science. 1938;88:599–600. doi: 10.1126/science.88.2295.599. [DOI] [PubMed] [Google Scholar]
- 3.Steinhauser ML, Lechene CP. Quantitative imaging of subcellular metabolism with stable isotopes and multi-isotope imaging mass spectrometry. Seminars in cell & developmental biology. 2013 doi: 10.1016/j.semcdb.2013.05.001. [DOI] [PMC free article] [PubMed] [Google Scholar]
- 4.Sturup S, Hansen HR, Gammelgaard B. Application of enriched stable isotopes as tracers in biological systems: a critical review. Anal Bioanal Chem. 2008;390:541–554. doi: 10.1007/s00216-007-1638-8. [DOI] [PubMed] [Google Scholar]
- 5.Polissar PJ, Fulton JM, Junium CK, Turich CC, Freeman KH. Measurement of 13C and 15N isotopic composition on nanomolar quantities of C and N. Analytical chemistry. 2009;81:755–763. doi: 10.1021/ac801370c. [DOI] [PubMed] [Google Scholar]
- 6.Slodzian G, Daigne B, Girard F, Boust F, Hillion F. Scanning secondary ion analytical microscopy with parallel detection. Biol Cell. 1992;74:43–50. doi: 10.1016/0248-4900(92)90007-n. [DOI] [PubMed] [Google Scholar]
- 7.Lechene C, Hillion F, McMahon G, Benson D, Kleinfeld AM, Kampf JP, Distel D, Luyten Y, Bonventre J, Hentschel D, Park KM, Ito S, Schwartz M, Benichou G, Slodzian G. High-resolution quantitative imaging of mammalian and bacterial cells using stable isotope mass spectrometry. J Biol. 2006;5:20. doi: 10.1186/jbiol42. [DOI] [PMC free article] [PubMed] [Google Scholar]
- 8.Lechene CP, Luyten Y, McMahon G, Distel DL. Quantitative imaging of nitrogen fixation by individual bacteria within animal cells. Science. 2007;317:1563–1566. doi: 10.1126/science.1145557. [DOI] [PubMed] [Google Scholar]
- 9.Musat N, Halm H, Winterholler B, Hoppe P, Peduzzi S, Hillion F, Horreard F, Amann R, Jorgensen BB, Kuypers MM. A single-cell view on the ecophysiology of anaerobic phototrophic bacteria. Proc Natl Acad Sci U S A. 2008;105:17861–17866. doi: 10.1073/pnas.0809329105. [DOI] [PMC free article] [PubMed] [Google Scholar]
- 10.Kopp C, Domart-Coulon I, Barthelemy D, Meibom A. Nutritional input from dinoflagellate symbionts in reef-building corals is minimal during planula larval life stage. Science advances. 2016;2:e1500681. doi: 10.1126/sciadv.1500681. [DOI] [PMC free article] [PubMed] [Google Scholar]
- 11.Kopp C, Domart-Coulon I, Escrig S, Humbel BM, Hignette M, Meibom A. Subcellular investigation of photosynthesis-driven carbon assimilation in the symbiotic reef coral Pocillopora damicornis. mBio. 2015;6 doi: 10.1128/mBio.02299-14. [DOI] [PMC free article] [PubMed] [Google Scholar]
- 12.Clode PL, Kilburn MR, Jones DL, Stockdale EA, Cliff JB, 3rd, Herrmann AM, Murphy DV. In situ mapping of nutrient uptake in the rhizosphere using nanoscale secondary ion mass spectrometry. Plant physiology. 2009;151:1751–1757. doi: 10.1104/pp.109.141499. [DOI] [PMC free article] [PubMed] [Google Scholar]
- 13.Kaiser C, Kilburn MR, Clode PL, Fuchslueger L, Koranda M, Cliff JB, Solaiman ZM, Murphy DV. Exploring the transfer of recent plant photosynthates to soil microbes: mycorrhizal pathway vs direct root exudation. The New phytologist. 2015;205:1537–1551. doi: 10.1111/nph.13138. [DOI] [PMC free article] [PubMed] [Google Scholar]
- 14.Steinhauser ML, Bailey AP, Senyo SE, Guillermier C, Perlstein TS, Gould AP, Lee RT, Lechene CP. Multi-isotope imaging mass spectrometry quantifies stem cell division and metabolism. Nature. 2012;481:516–519. doi: 10.1038/nature10734. [DOI] [PMC free article] [PubMed] [Google Scholar]
- 15.Senyo SE, Steinhauser ML, Pizzimenti CL, Yang VK, Cai L, Wang M, Wu TD, Guerquin-Kern JL, Lechene CP, Lee RT. Mammalian heart renewal by pre-existing cardiomyocytes. Nature. 2013;493:433–436. doi: 10.1038/nature11682. [DOI] [PMC free article] [PubMed] [Google Scholar]
- 16.Kim SM, Lun M, Wang M, Senyo SE, Guillermier C, Patwari P, Steinhauser ML. Loss of white adipose hyperplastic potential is associated with enhanced susceptibility to insulin resistance. Cell metabolism. 2014;20:1049–1058. doi: 10.1016/j.cmet.2014.10.010. [DOI] [PMC free article] [PubMed] [Google Scholar]
- 17.Kopf SH, McGlynn SE, Green-Saxena A, Guan Y, Newman DK, Orphan VJ. Heavy water and (15) N labelling with NanoSIMS analysis reveals growth rate-dependent metabolic heterogeneity in chemostats. Environmental microbiology. 2015;17:2542–2556. doi: 10.1111/1462-2920.12752. [DOI] [PMC free article] [PubMed] [Google Scholar]
- 18.Bardin N, Duprat J, Slodzian G, Wu TD, Baklouti D, Dartois E, Brunetto R, Engrand C, Guerquin-Kern JL. Hydrogen isotopic fractionation in secondary ion mass spectrometry using polyatomic ions. Int J Mass Spec. 2015;393:17–24. [Google Scholar]
- 19.Mayali X, Weber PK, Brodie EL, Mabery S, Hoeprich PD, Pett-Ridge J. Highthroughput isotopic analysis of RNA microarrays to quantify microbial resource use. The ISME journal. 2012;6:1210–1221. doi: 10.1038/ismej.2011.175. [DOI] [PMC free article] [PubMed] [Google Scholar]
- 20.Guillermier C, Steinhauser ML, Lechene CP. Quasi-simultaneous acquisition of nine secondary ions with seven detectors on NanoSIMS50L: application to biological samples. Surf Interface Anal. 2014;46:150–153. doi: 10.1002/sia.5496. [DOI] [PMC free article] [PubMed] [Google Scholar]
- 21.Slodzian G, Wu TD, Bardin N, Duprat J, Engrand C, Guerquin-Kern JL. Simultaneous hydrogen and heavier element isotopic ratio images with a scanning submicron ion probe and mass resolved polyatomic ions, Microscopy and microanalysis: the official journal of Microscopy Society of America. Microbeam Analysis Society, Microscopical Society of Canada. 2014;20:577–581. doi: 10.1017/S1431927613014074. [DOI] [PubMed] [Google Scholar]
- 22.Hoppe P, Cohen S, Meibom A. NanoSIMS: technical aspects and applications in cosmochemisty and biological geochemistry. Geostand Geoanal Res. 2013;37:111–154. [Google Scholar]
- 23.Piani L, Remusat L, Robert F. Determination of the H isotopic composition of individual components in fine-scale mixtures of organic matter and phyllosilicates with the nanoscale secondary ion mass spectrometry. Analytical chemistry. 2012;84:10199–10206. doi: 10.1021/ac301099u. [DOI] [PubMed] [Google Scholar]
- 24.Neese RA, Misell LM, Turner S, Chu A, Kim J, Cesar D, Hoh R, Antelo F, Strawford A, McCune JM, Christiansen M, Hellerstein MK. Measurement in vivo of proliferation rates of slow turnover cells by 2H2O labeling of the deoxyribose moiety of DNA. Proc Natl Acad Sci U S A. 2002;99:15345–15350. doi: 10.1073/pnas.232551499. [DOI] [PMC free article] [PubMed] [Google Scholar]
- 25.Messmer BT, Messmer D, Allen SL, Kolitz JE, Kudalkar P, Cesar D, Murphy EJ, Koduru P, Ferrarini M, Zupo S, Cutrona G, Damle RN, Wasil T, Rai KR, Hellerstein MK, Chiorazzi N. In vivo measurements document the dynamic cellular kinetics of chronic lymphocytic leukemia B cells. The Journal of clinical investigation. 2005;115:755–764. doi: 10.1172/JCI23409. [DOI] [PMC free article] [PubMed] [Google Scholar]
- 26.Strawford A, Antelo F, Christiansen M, Hellerstein MK. Adipose tissue triglyceride turnover, de novo lipogenesis, and cell proliferation in humans measured with 2H2O, American journal of physiology. Endocrinology and metabolism. 2004;286:E577–588. doi: 10.1152/ajpendo.00093.2003. [DOI] [PubMed] [Google Scholar]
- 27.Guillermier C, Fazeli PK, Kim S, Lun M, Zuflacht JP, Milian J, Lee H, Francois-Saint-Cyr H, Horreard F, Larson D, Rosen ED, Lee RT, Lechene CP, Steinhauser ML. Imaging mass spectrometry demonstrates age-related decline in human adipose plasticity. JCI insight. 2017;2:e90349. doi: 10.1172/jci.insight.90349. [DOI] [PMC free article] [PubMed] [Google Scholar]
- 28.Steinhauser ML, Guillermier C, Wang M, Lechene CP. Quantifying cell division with deuterated water and multi-isotope imaging mass spectrometry (MIMS) Surface and interface analysis: SIA. 2014;46:161–164. doi: 10.1002/sia.5581. [DOI] [PMC free article] [PubMed] [Google Scholar]
- 29.Steinhauser ML, Guillermier C, Wang M, Lechene CP. Approaches to increasing analytical throughput of human samples with multi-isotope imaging mass spectrometry. Surface and interface analysis: SIA. 2014;46:165–168. doi: 10.1002/sia.5580. [DOI] [PMC free article] [PubMed] [Google Scholar]
Associated Data
This section collects any data citations, data availability statements, or supplementary materials included in this article.


