. 2017 Dec 4;6:e30433. doi: 10.7554/eLife.30433

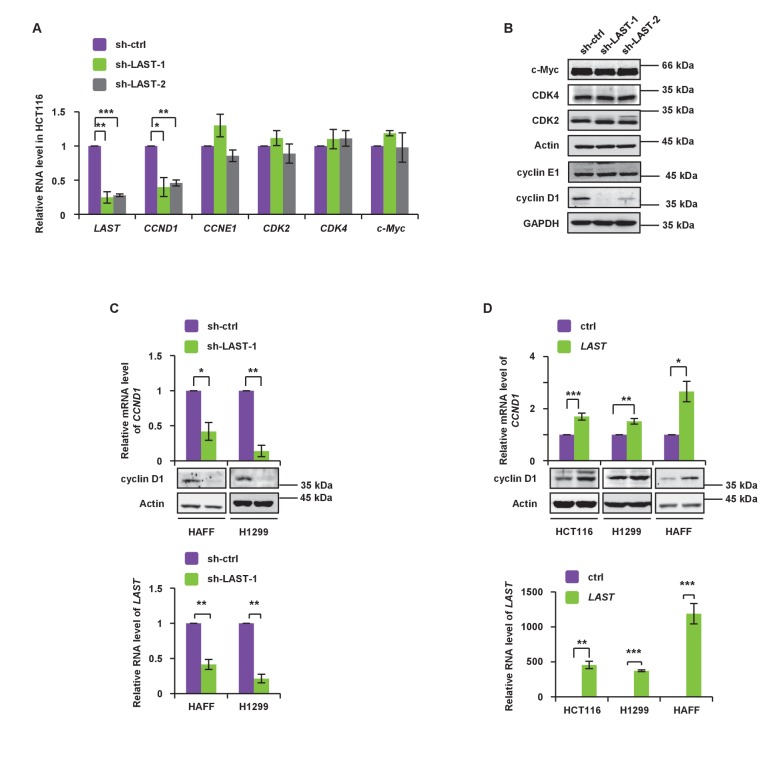
Figure 2. LAST accelerates G1/S transition and upregulates cyclin D1/CCND1.

(A) HCT116 cells were infected with lentiviruses expressing control shRNA, LAST shRNA-1 or −2. Ninety-six hours after infection, total RNA was extracted and the transcript levels for LAST, CCND1, CCNE1, CDK2, CDK4 and c-Myc were analyzed by real-time RT-PCR. Data shown are the mean ± SD (n = 3; *p<0.05, **p<0.01, ***p<0.001, two-tailed t-test). (B) Cell lysates prepared as described above (Figure 2A) were analyzed by western blotting to examine GAPDH, cyclin D1, cyclin E1, Actin, CDK2, CDK4 and c-Myc expression. (C) HAFF and H1299 cells were infected with lentiviruses expressing control shRNA or LAST shRNA. Ninety-six hours after infection, total RNA was analyzed by real-time RT-PCR to detect the level of LAST to determine its knockdown efficiency (lower panel). Total RNA was also analyzed by real-time RT-PCR to detect the level of CCND1 mRNA and by western blotting to examine the cyclin D1 protein level (upper panel). Data shown are the mean ± SD (n = 3; *p<0.05, **p<0.01). (D) HCT116, H1299 and HAFF cells were infected with lentiviruses expressing control RNA or LAST. Ninety-six hours after infection, total RNA was analyzed by real-time RT-PCR to detect successful expression of LAST (lower panel). Total RNA was also analyzed by real-time RT-PCR to detect the level of CCND1 mRNA and by western blotting to examine the cyclin D1 protein level (upper panel). Data shown are the mean ± SD (n = 3; *p<0.05, **p<0.01, ***p<0.001, two-tailed t-test).

Figure 2—source data 1. Source data for Figure 2A, C and D.
DOI: 10.7554/eLife.30433.010

Figure 2.

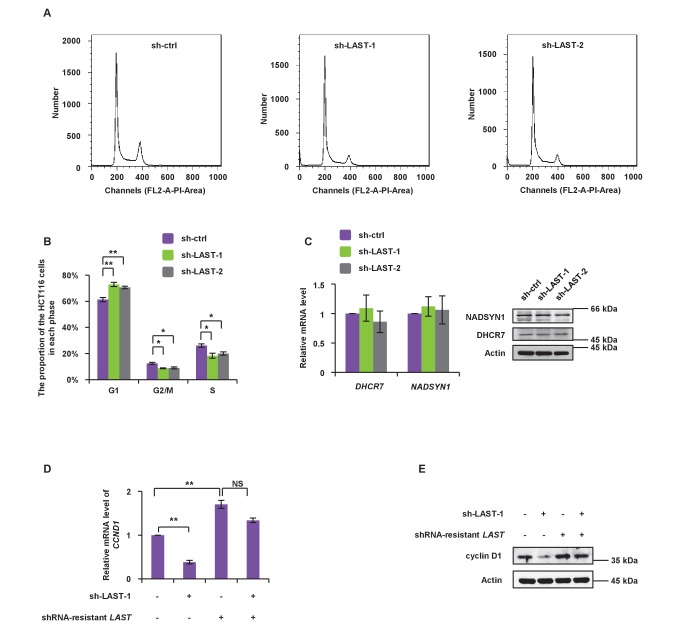
Figure 2—figure supplement 1. LAST knockdown prevents cell passage from the G1 phase into S phase.

Figure 2—figure supplement 1.

(A) HCT116 cells were individually infected with lentiviruses expressing LAST shRNA-1,–2 and non-targeting control shRNA. Ninety-six hours after infection, cells were stained with PI, followed by flow cytometric analysis of the cell cycle phase distribution. (B) The percentage numbers of cells from (A) in the G1, S or G2/M phase were analyzed by FlowJo 7.6 software. Data shown are the mean ± SD (n = 3; *p<0.05, **p<0.01, two-tailed t-test). (C) HCT116 cells were infected with lentiviruses expressing control shRNA, LAST shRNA-1 or −2. Ninety-six hours after infection, total RNA was extracted and the transcript levels of DHCR7 and NADSYN1 were analyzed by real-time RT-PCR. Data shown are the mean ± SD (n = 3; two-tailed t-test). Cell lysates were analyzed by western blotting to examine actin, DHCR7 and NADSYN1 expression. (D) HCT116 cells expressing control shRNA or LAST shRNA-1 were separately transfected with either mock control or shRNA-resistant LAST. Twenty-four hours after transfection, total extracted RNA was subjected to real-time RT-PCR to analyze the mRNA level of CCND1. Data shown are the mean ± SD (n = 3; **p<0.01, two-tailed t-test). (E) Cell lysates from cells treated as described in Figure 2—figure supplement 1B were analyzed by western blotting to detect the cyclin D1 protein level.
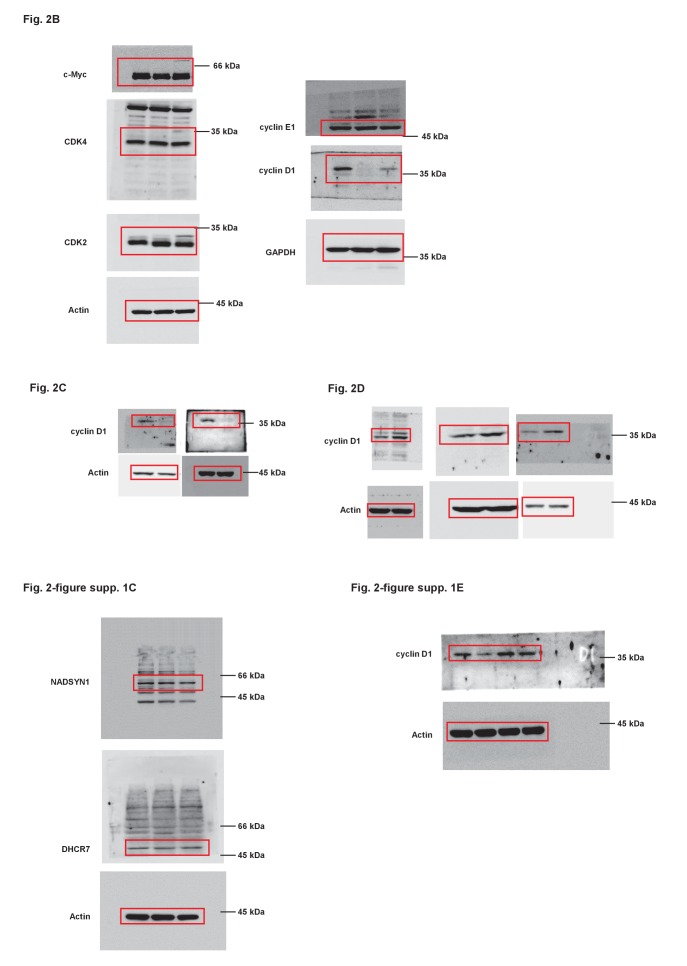
Figure 2—figure supplement 2. Uncropped images of blots.

Figure 2—figure supplement 2.

Red boxes indicate the cropped regions.