

ABSTRACT
Emerging evidence suggests that NLRP3 inflammasome provides a link between colitis-associated colorectal cancer and inflammatory bowel diseases. Autophagy is induced in macrophages by AMPK activation and regulates NLRP3 inflammasome to maintain intracellular homeostasis. Here we report that a small-molecule AMPK activator (GL-V9) exerts potent anti-inflammatory effects on macrophages in vitro and in vivo, which trigger autophagy to degraded NLRP3 inflammasome. Treatment with GL-V9 protected against colitis and tumorigenesis in colitis-associated colorectal cancer. This suggests that GL-V9 may be an interesting candidate for clinical evaluation in the treatment of colitis-associated colorectal cancer.
KEYWORDS: autophagy, colitis-associated colorectal cancer, colitis, GL-V9, NLRP3 inflammasome
Introduction
Colorectal cancer is one of the leading causes of cancer-related deaths in the world.1,2 Although the exact mechanisms of colorectal cancer development still remain unclear, chronic colonic inflammation may increase the risk of colitis-associated colorectal cancer.3,4 Increasing evidence has shown that patients with colorectal cancer can result from prolonged inflammatory bowel diseases (IBD; e.g., ulcerative colitis and Crohn's disease). The pathogenesis of IBD is multifaceted and not entirely clear, but duration of chronic colonic inflammation induced by IBD have all been found to influence colorectal cancer risk.5,6 The infiltration of immune cells, production of inflammatory cytokines and activation of the pro-inflammation transcription factors promote tumorigenesis during colitis-associated colon cancer.7 Therefore, the anti-inflammatory interventions are urgently needed for high risk patients of colitis-associated colon cancer.
Inflammasomes are multiprotein complexes that contain Nod-like receptors (NLRs) that are activated upon cellular infection or stress and trigger the maturation of interleukin-1β to engage innate immune defenses. Thus, inflammasomes play a crucial role in innate immune responses.8 Various inflammasomes are activated by distinct stimuli. The NLRP1 inflammasome is stimulated by Bacillus anthracis lethal toxin; the NLRP3 inflammasome is activated upon exposure to whole pathogens, as well as a number of danger-associated molecular patterns (DAMPs) and pathogen-associated molecular patterns (PAMPs); and the AIM2 inflammasome is triggered by cytosolic double-stranded DNA. Among multiple inflammasomes, the NLRP3 inflammasome is the most detailedly studied. Indeed, NLRP3 inflammasome plays an important role in IBD.9 In the pathogenesis of IBD, several findings towards the potential role of the inflammasome in the development of chronic colonic inflammation. The first evidence refers to the promotion of inflammatory cytokines IL-1β and IL-18 secretion in active IBD.10,11 The second is the dysregulation of IL-1β production in Crohn's disease.12,13 The third is the association between the NLRP3 gene and IBD in candidate-gene approach studies.9 Therefore, targeting the pathogenic roles of NLRP3 inflammasome in the progression of IBD is required for limiting intestinal inflammation and colon cancer.
Autophagy is a mechanism to deliver damaged organelles and long-lived proteins in double membrane vesicles (autophagosomes) that traffic to and fuse with lysosomes for clearance.14 The intracellular protozoa, bacteria and viruses can be cleared by autophagy.15,16 Thus, defects in autophagy are associated with many diseases and the function of immune response. Autophagy is induced in response to noxious stimuli, such as starvation or damaging stress. In noxious stimuli, autophagy accelerate degradation of damaged proteins and organelles to reduce the accumulation of harmful stimulation. Hence, defects in autophagy lead to tissue damage and chronic inflammation.17 Atg16L1-deficient mice, genetic deletion of autophagy regulator Atg16L1 to block autophagy, enhanced inflammasome activity compared with Atg16L1-wt mice suffer severe dextran sulfate sodium (DSS) to induce colitis.18 Another important research has shown that autophagy accompanies inflammasome activation to temper inflammation by eliminating active inflammasomes.19 These observations prompted us there is a dynamic balance between inflammasome activation and autophagy.
To intervene the chronic colonic inflammation, we tried to break the balance of inflammasome activation and autophagy. Previous studies have shown that the small molecule GL-V9 (5-hydroxy-8-methoxy-2-phenyl-7-(4-(pyrrolidin-1-yl)butoxy)4 H-chromen-4-one) attenuated DSS-induced colitis against oxidative stress by up-regulating Trx-1 via activation of AMPK/FOXO3 a pathway.20 Further research found that the small molecule GL-V9 triggered autophagy in macrophages by activating AMPK. Furthermore, GL-V9 degraded NLRP3 inflammasome by antophagosomes activation. Therefore, our findings may provide new therapeutic strategies for IBD and the development of colorectal cancer.
Results
GL-V9 prevented tumorigenesis in colitis-associated colon cancer
To assess the role of GL-V9 in colitis-associated colon cancer, C57 BL/6 mice were intraperitoneally (i.p.) injected with azoxymethane (AOM) followed by three cycles of 3% dextran sodium sulfate (DSS) in drinking water (Fig. 1A).21 The survival curves showed that 100% of the mice survived after GL-V9 treatment (Fig. 1B). The mice lost weight substantially following each cycle of 3% DSS and regained the weight with normal water. After GL-V9 treatment, the mice showed less weight loss than AOM/DSS group (Fig. 1C). The area under the curve of percent weight change also confirms this conclusion in Fig. 1D. The assessment of macroscopic polyp counts, tumor number, tumor size and tumor load indicated that GL-V9 decreased numbers of polyps, tumor number, tumor size and average tumor load in AOM/DSS model (Fig. 1E-1H). As shown in Fig. 1I, the mean colon length of AOM/DSS group was slightly shorter than that of GL-V9 group. Colon histopathology revealed that samples in AOM/DSS group had a large adenocarcinoma inside mucosa, exhibited that several abnormal cells and the glands had abnormal sizes and shapes with partial expanding lumens. However, GL-V9 reduced the number and size of adenocarcinoma inside mucosa (Fig. 1J). Together, these results indicated that GL-V9 inhibited tumorigenesis in colitis-associated colon cancer.
Figure 1.

GL-V9 treatment reduced the occurrence of inflammation-driven colon tumorigenesis. (A) Schematic of the AOM/DSS model of colitis-associated colon cancer. Percent survival (d, days) (B) Percent weight change (C), Area under the percent weight change curve (D) and macroscopic appearances of colon (E) in AOM/DSS-treated mice following treatment of GL-V9. Mock mice received a single i.p. injection of AOM and were given regular drinking water instead of DSS. Tumor numbers (F), tumor sizes (G) and tumor load (H) was determined after mice sacrificed. (I) The length of colons from each group of mice were measured. (J) H&E stains of serial sections of colons. Data are presented as mean ± SD. **P < 0.01 compared with AOM/mock group; #P < 0.05, ##P < 0.01 compared with AOM/DSS group.
GL-V9 diminished inflammation in colitis-associated colon cancer
It is recognized that the chronic infiltration of immune cells promote tumorigenesis through production of inflammatory cytokines during colitis-associated colon cancer.7 In consequence, we assessed the effect of GL-V9 on the inflammation in colitis-associated colon cancer. Colonic cytokine mRNA expression (Fig. 2A) and cytokine production (Fig. 2B) were significantly suppressed in GL-V9 treatment group. Then we stained colon tissue sections to detect Gr-1+ cells and F4/80+ cells infiltration. As shown in Fig. 2C-2F, GL-V9 obviously decreased the chronic infiltration of immune cells into both tumors and matched inflamed mucosa. Additionally, FACS analysis showed a significantly increased number of F4/80+ CD11b+ macrophages and CD11b+ Ly6G+ neutrophils in DSS-treated colon tissues, which could be abolished by GL-V9 treatment (Fig. 2G and 2H). Thus, GL-V9 suppressed the inflammation in colitis-associated colon cancer.
Figure 2.

GL-V9 treatment inhibited inflammation in colitis-associated colon cancer. Inflammatory cytokine mRNA (A) and protein expression level (B) in AOM/DSS-treated mice colons following treatment of GL-V9. The distribution of F4/80+ cells (C) and Gr-1+ cells (D) infiltration were observed by confocal laser-scanning microscope. Representative images are shown. Scale bars, 100 µm. The F4/80 (E) and Gr-1 (F) expression was quantified with statistical significances. FACS analysis of macrophages (G) and neutrophils (H) in colonic tissues. Data are presented as mean ± SD. **P < 0.01 compared with AOM/mock group; #P < 0.05, ##P < 0.01 compared with AOM/DSS group.
GL-V9 protected against experimental recurring colitis
Current clinical research showed that patients suffering from ulcerative colitis had a high risk of colorectal cancer, which is associated with both the duration of the inflammation and the degree of mucosal inflammation damage3. We next assessed the roles of GL-V9 in a recurring colitis model. The mice were subjected to three cycles of 3% DSS treatment (Fig. 3A).21 After the completion of the recurring colitis model, the mice showed dramatic body weight loss, rectal bleeding and diarrhea. Increased weight loss was observed in all DSStreated mice, but administration of GL-V9 attenuated weight loss during three cycles of DSS treatment, by calculating the area under the percentile weight change curve (Fig. 3B and 3C). Moreover, GL-V9 alleviated the DSS-induced colon shortening (Fig. 3D and E). Haematoxylin & eosin (H&E) staining and histological analysis revealed the severity of colitis. Mucosal damage, necrosis and infiltration of inflammatory cells were observed in DSS-treated mice. Strikingly, GL-V9-treated mice exhibited less inflammatory cells infiltration and intact colonic architecture without mucosal damage (Fig. 3F). The hallmark of DSS-induced colitis is high levels of cytokines production.22 Then, we investigated the effect of GL-V9 on the production of cytokines in the recurring colitis model. Colonic cytokine mRNA expression (Fig. 3G) and cytokine production (Fig. 3H) were markedly suppressed in GL-V9-treated mice. Furthermore, DSS-induced overactive myeloperoxidase (MPO) and inducible nitric oxide synthase (iNOS) were notably reversed by GL-V9 (Figure S1 A and S1B). The infiltration of macrophages was reduced after GL-V9 treatment (Figure S1 C). Thus, treatment of GL-V9 alleviated the severity of colitis in the recurring colitis model.
Figure 3.

GL-V9 treatment attenuated recurring ulcerative colitis. (A) Schematic of the recurring model of DSS-induced ulcerative colitis. (B) Weight loss was detected in DSS-treated mice colons following treatment of GL-V9. (C) Area under percent weight change curve was calculated from (B). (D) Macroscopic appearances of colon was observed in each group of mice. (E) The length of colons were measured in each group of mice. (F) H&E stains of serial sections of colons. Inflammatory cytokine mRNA (G) and protein expression level (H) in DSS-treated mice colons following treatment of GL-V9. Data are presented as mean ± SD. **P < 0.01 compared with normal group; #P < 0.05, ##P < 0.01 compared with DSS group.
GL-V9 inhibited the activation of NLRP3 inflammasome
It is reported that NLRP3 inflammasome play an important role in DSS-induce colitis.23 To clarify the mechanism of GL-V9 against colitis, we explored the activation of NLRP3 inflammasome in vivo and in vitro. The expression of mature IL-1β (p17), cleaved caspase-1 (p10) and ASC were markedly suppressed in GL-V9 treatment colonic tissues (Fig. 4A). Furthermore, the colonic caspase-1 activity was inhibited after GL-V9 treatment (Fig. 4B). In vitro, we used LPS plus nigericin to active NLRP3 inflammasome in macrophages differentiated from THP-1 cells and murine bone marrow-derived macrophages (BMDMs). Treatment of LPS results in NF-κB activation, which induced pro-IL-1β transcription and also controlled NLRP3 inflammasome activity through induction of NLRP3. After LPS treatment, stimulation of nigericin will lead to NLRP3 oligomerization to interact with ASC, which recruits the procaspase-1. Procaspase-1 clustering undergoes autocleavage to form the cleaved caspase-1, which then processes pro-IL-1β to generate the active molecules.8 Therefore, secretion of IL-1β directly reflects the function of NLRP3 inflammasome. ELISA assay results showed that GL-V9 inhibited IL-1β secretion from differentiated THP-1 cells (Fig. 4C) and BMDMs (Figure S2 A). Moreover, the expression of mature IL-1β (p17) in the supernatants and cleaved caspase-1 (p10) and ASC in the lysates were significantly down-regulated after GL-V9 treatment in differentiated THP-1 cells (Fig. 4D) and BMDMs (Figure S2B). Immunoprecipitation and immunofluorescence results revealed that NLRP3 inflammasome formation was interrupted following GL-V9 treatment (Fig. 4E, 4F and Figure S2 C). Together these results indicated that GL-V9 suppressed the activation of NLRP3 inflammasome in vivo and in vitro.
Figure 4.
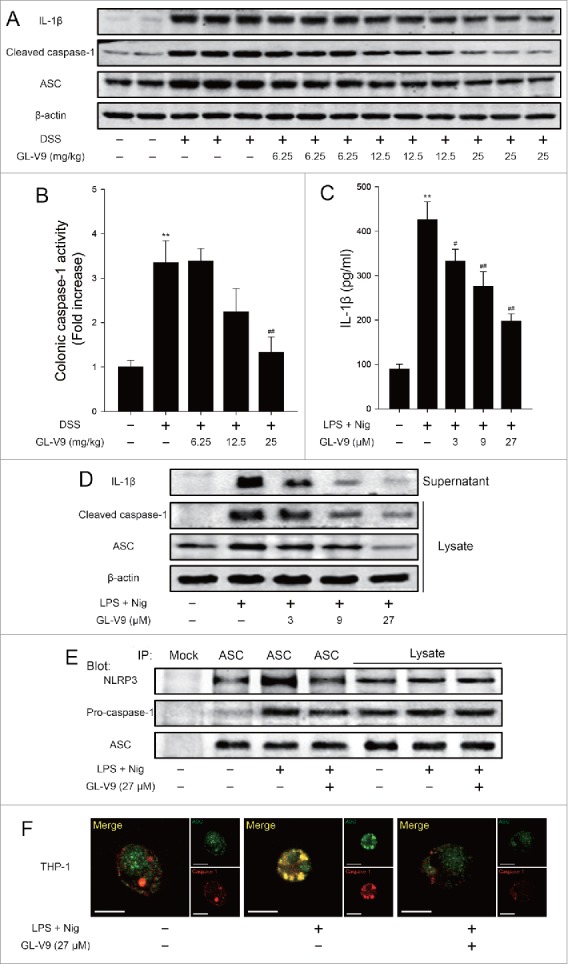
GL-V9 treatment inhibited caspase-1 activation and IL-1β maturation by suppressing NLRP3 inflammasome. (A) Immunoblot analysis of NLRP3 inflammasome activation in colonic tissues. (B) The colonic caspase-1 activity was measured. Data are presented as mean ± SD. **P < 0.01 compared with normal group; ##P < 0.01 compared with DSS group. (C) Enzyme-linked immunosorbent assay of IL-1β in supernatants of differentiated THP-1 cells, which treated with LPS (500 ng/ml) and indicated concentration of GL-V9 for 12 h, followed by incubation with nigericin (4 μM) for 3 h. Data are presented as mean ± SD. **P < 0.01 compared with control group; #P < 0.05, ##P < 0.01 compared with LPS + nigericin group. (D) Immunoblot analysis of ASC, processed caspase-1 and IL-1β in supernatants and lysates of differentiated THP-1 cells treated as above. (E) Immunoblot analysis of ASC immunoprecipitates of differentiated THP-1 cells treated as above, probed for NLRP3, pro-caspase-1 and ASC. (F) Confocal microscopy of differentiated THP-1 cells treated as above, immunostained for ASC (green) and caspase-1 (red). Scale bars, 10 µm. Data are representative of at least three experiments.
GL-V9 increased autophagic flux in differentiated THP-1 cells.
Previous studies have showed that activation of inflammasome is regulated by autophagy.19 To explore the mechanism of GL-V9 on NLRP3 inflammasome activation, we investigated the effects of GL-V9 on autophagy. We assessed LC3 in the cell lysates by immunoblot analysis. LC3-I and LC3-II are both produced post-translationally, but LC3-I is cytosolic and LC3-II, the hallmarks of autophagy, is membrane bound.24 We found that LC-II protein levels was gradually increased following treatment with GL-V9 (27 μM) for 0.75, 1.5, 3 and 6 hours in differentiated THP-1 cells but was reversed in 12 hours (Fig. 5A). Thus indicate that GL-V9 increased autophagosome formation in differentiated THP-1 cells. To determine whether a complete autophagic flux is occurred after GL-V9 treatment, we investigated the degradation of p62. As shown in Fig. 5A, the level of p62 protein in differentiated THP-1 cells decreased significantly with time during GL-V9 treatment. Since enhanced autophagosome accumulation could be caused either by increased autophagosome formation or by decreased autophagosome degradation, the levels of LC3-II and p62 were measured in the presence of bafilomycin A1 (Baf A1), which blocks the fusion of autophagolysosome. As demonstrated in Fig. 5B, bafilomycin A1 treatment significantly increased the levels of p62 and LC3-II in GL-V9-treated differentiated THP-1 cells, suggesting that GL-V9 treatment enhanced autophagic flux. To further assess the status of autophagic flux, we used the mCherry-GFP-LC3 construct. As the more stable of mCherry in acidic conditions compared with GFP, autophagic flux can be determined by the appearance of more GFP-mCherry+ (red) puncta. After treatment of GL-V9, the numbers of GFP-mCherry+ (red) puncta increased, indicating an increase in autolysosomes. In contrast, large-sized GFP+mCherry+ (yellow) puncta and few GFP-mCherry+ (red) puncta were observed in bafilomycin A1 treatment group (Fig. 5C and 5D). After the maturation of autophagosome, the fusion of the lysosomal and autophagosome to form autophagolysosome, results in degradation of the contents of the autophagosome.14 After treatment of GL-V9, we detected co-localization of LC3 with LAMP-1, which indicated autophagolysosome formation (Figure S3 A). During the process of autophagosome maturation, p62 can bind polyubiquitinated targets and LC3.25 Therefore, autophagosome maturation in differentiated THP-1 cells was also confirmed by co-localization of p62 and LC3 following GL-V9 treatment (Figure S3B). These results revealed that GL-V9 increased autophagic flux in differentiated THP-1 cells.
Figure 5.
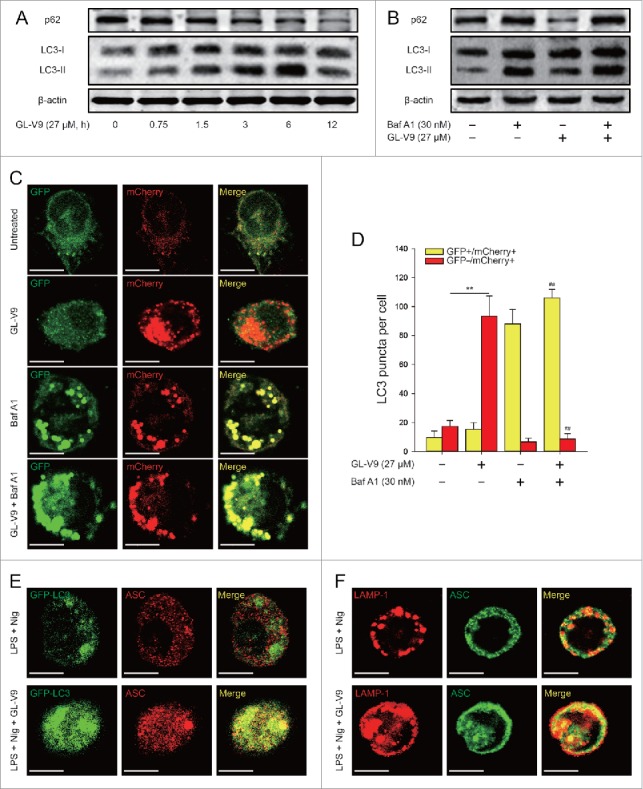
GL-V9 treatment increased autophagic flux in differentiated THP-1 cells. (A) Immunoblot analysis of p62 and LC3 expression in differentiated THP-1 cells following treatment of GL-V9 (27 μM) for the indicated times. (B) Immunoblot analysis of p62 and LC3 expression in differentiated THP-1 cells, which were treated with GL-V9 (27 μM) alone or with bafilomycin A1 (30 nM). (C) Differentiated THP-1 cells were transfected with mCherry-GFP-LC3 for 24 hours, after transfection cells were treated with GL-V9 (27 μM) alone or with bafilomycin A1 (30 nM). Cells were observed under a confocal microscopy. Representative images are shown. Scale bars, 10 µm. (D) The average numbers of yellow or red puncta were obtained from three countings. Data are presented as mean ± SD. **P < 0.01. #P < 0.05, ##P < 0.01 compared with GL-V9 group. (E) Confocal microscopy of differentiated GFP-LC3+ THP-1 cells treated with LPS (500 ng/ml) and untreated or treated with GL-V9 (27 μM) for 6 h and then stimulated with nigericin (4 μM) for 3 h, immunostained for endogenous ASC. (F) Confocal microscopy of differentiated THP-1 cells treated as above, immunostained for ASC (green) and LAMP-1 (red). Scale bars, 10 µm. Data are representative of at least three experiments.
To study the interaction between autophagosomes and NLRP3 inflammasomes after GL-V9 treatment, we transfected GFP-LC3 plasmid into differentiated THP-1 cells and then immunostained ASC to visualize inflammasomes. We detected ASC partially localized together with the GFP-LC3+ autophagosomes following GL-V9 treatment (Fig. 5E). Mature autophagosomes merge with lysosomes to form autophagolysosome, where degradation occurs. Immunostaining of cells treated with GL-V9 showed that ASC surrounded by the lysosome marker LAMP-1, suggesting the fusion of autophagosomes with inflammasome components and lysosomal (Fig. 5F). Then, we verified the co-localization of intracellular sensors NLRP3 with autophagosomes. We found that GFP-LC3 or LAMP-1 partial overlapped with NLRP3 after treatment of GL-V9 (Figure S3 C and S3D). All these results indicated that NLPR3 inflammasomes can be engulfed by autophagosomes and probably be degraded by lysosomes following GL-V9 treatment.
Autophagy was involved in the degradation of NLRP3 inflammasome induced by GL-V9
To investigate the role of autophagy in the inhibitory effect of GL-V9 on NLRP3 inflammasome activation, we blocked the fusion of autophagolysosome with bafilomycin A1 and suppressed the formation of autophagosomes with 3-MA. Either treatment of bafilomycin A1 or 3-MA resulted in dramatic increases of mature IL-1β (p17), cleaved caspase-1 (p10) and ASC expression in GL-V9-treated differentiated THP-1 cells (Fig. 6A and 6B). The autophagic adaptor p62 can deliver ubiquitinated substrates to the autophagosome. It has been confirmed that ASC, the adaptor of inflammasome complex, which is polyubiquitinated, could be targeted to the autophagic pathway by p62.19 Immunostaining showed that autophagy induced by GL-V9 promoted co-localization of ASC and p62 (Fig. 6C). To further study the role of p62 in the regulation of NLRP3 inflammasome by GL-V9, we diminished the expression of beclin-1 or p62 through transfecting siRNA. The siRNA transfection resulted in lower expression of beclin-1 or p62 in the cell lysates (Fig. 6D). The expression of mature IL-1β (p17) in the supernatants and cleaved caspase-1 (p10) and ASC in the lysates was enhanced after diminishing the expression of beclin-1 or p62 in GL-V9-treated differentiated THP-1 cells (Fig. 6E). Further diminished the expression of ATG5 or ATG7, the expression of mature IL-1β (p17) in the supernatants and cleaved caspase-1 (p10) and ASC in the lysates was enhanced in GL-V9-treated differentiated THP-1 cells (Fig. 6F and 6G). Taken together, these results suggested that NLRP3 inflammasome can be degraded by GL-V9-trigged autophagy through p62.
Figure 6.

GL-V9 treatment degraded NLRP3 inflammasome trigging autophagy. (A) Immunoblot analysis of ASC, processed caspase-1 and IL-1β in supernatants and lysates of differentiated THP-1 cells treated with LPS (500 ng/ml), GL-V9 (27 μM) and bafilomycin A1 (30 nM) for 6 h and then stimulated with nigericin (4 μM) for 3 h. (B) Immunoblot analysis of ASC, processed caspase-1 and IL-1β in supernatants and lysates of differentiated THP-1 cells treated with LPS (500 ng/ml), GL-V9 (27 μM) and 3-MA (5 mM) for 6 h and then stimulated with nigericin (4 μM) for 3 h. (C) Confocal microscopy of differentiated THP-1 cells treated as above, immunostained for ASC (green) and p62 (red). Scale bars, 10 µm. (D) Immunoblot analysis of differentiated THP-1 cells transfected with siRNA with scrambled sequence (−) or siRNA specific for beclin-1 or p62 for 24 h. (E) Immunoblot analysis of ASC, processed caspase-1 and IL-1β in supernatants and lysates of differentiated THP-1 cells transfected with Beclin-1 siRNA or p62 siRNA following treatment of 500 ng/ml LPS and 27 μM GL-V9 for 6 h, finally stimulated with 4 μM nigericin for 3 h. Data are representative of at least three experiments. (F) Immunoblot analysis of differentiated THP-1 cells transfected with siRNA with scrambled sequence (−) or siRNA specific for ATG5 or ATG7 for 24 h. (G) Immunoblot analysis of ASC, processed caspase-1 and IL-1β in supernatants and lysates of differentiated THP-1 cells transfected with ATG5 siRNA or ATG7 siRNA following treatment of 500 ng/ml LPS and 27 μM GL-V9 for 6 h, finally stimulated with 4 μM nigericin for 3 h. Data are representative of at least three experiments.
The AMPK-ULK1 pathway is required for inhibition of NLRP3 inflammasome induced by GL-V9
Previous studies have reported that AMPK is involved in the activation of autophagy by regulation of ULK1 or mTOR.26,27 To determine whether AMPK-ULK1 pathway was affected after treatment of GL-V9, we used immunoblot analysis for the related proteins expression. We found that AMPK was activated by phosphorylation at Thr172 and ULK1 was activated by phosphorylation at Ser555 and dephosphorylation at Ser757 in GL-V9 treatment group (Fig. 7A). Moreover, treatment of GL-V9 did not alter the expression of phosphorylated mTOR and phosphorylated p70S6 K (Fig. 7B). These findings suggested that GL-V9 trigged autophagy through activation of AMPK-ULK1 pathway rather than via regulating mTOR.
Figure 7.
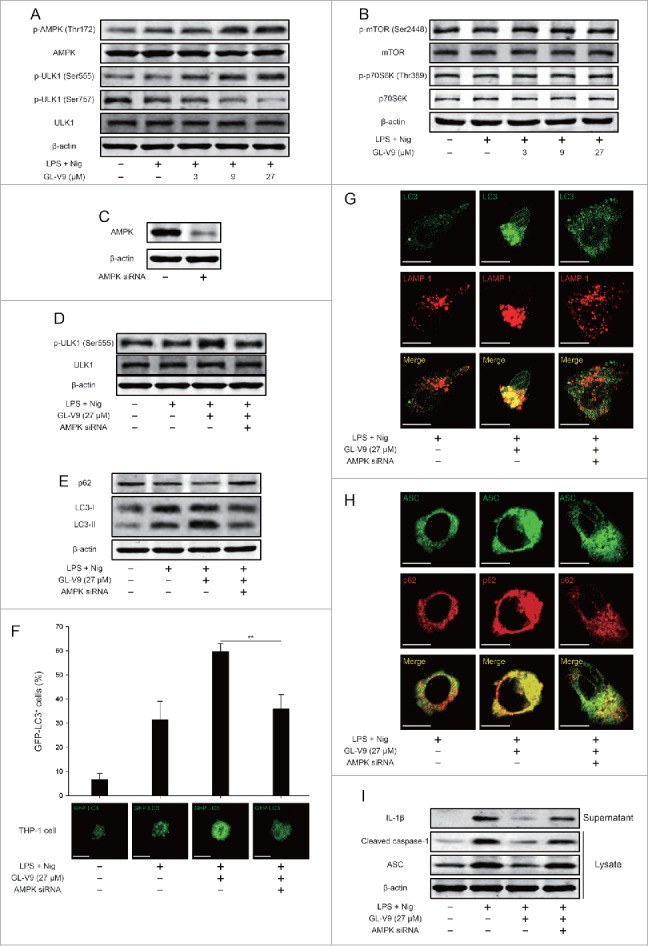
Activation of AMPK-ULK1 pathway triggered autophagy is involved in degradation of NLRP3 inflammasome after GL-V9 treatment. (A) Immunoblot analysis of p-AMPK (Thr172), AMPK, p-ULK1 (Ser555), p-ULK1 (Ser757) and ULK1 in lysates of differentiated THP-1 cells treated with 500 ng/ml LPS and 27 μM GL-V9 for 6 h, finally stimulated with 4 μM nigericin for 3 h. (B) Immunoblot analysis of p-mTOR (Ser2448), mTOR, p-p70S6 K (Thr389) and p70S6 K in lysates of differentiated THP-1 cells treated with 500 ng/ml LPS and 27 μM GL-V9 for 6 h, finally stimulated with 4 μM nigericin for 3 h. (C) Immunoblot analysis of differentiated THP-1 cells transfected with siRNA with scrambled sequence (−) or siRNA specific for AMPK for 24 h. (D) Immunoblot analysis of p-ULK1 (Ser555) and ULK1 in lysates of differentiated THP-1 cells transfected with AMPK siRNA following treatment of 500 ng/ml LPS and 27 μM GL-V9 for 6 h, finally stimulated with 4 μM nigericin for 3 h. (E) Immunoblot analysis of p62 and LC3 in lysates of differentiated THP-1 cells transfected with AMPK siRNA following treatment of 500 ng/ml LPS and 27 μM GL-V9 for 6 h, then stimulated with 4 μM nigericin for 3 h. (F) Induction of GFP+ dots in differentiated THP-1 cells expressing GFP-LC3 and transfected with AMPK siRNA following treatment of 500 ng/ml LPS and 27 μM GL-V9 for 6 h, then stimulated with 4 μM nigericin for 3 h., quantified of GFP-LC3+ dots (top) and images of individual cells (middle). Data are presented as mean ± SD. **P < 0.01. Confocal microscopy of differentiated THP-1 cells transfected with AMPK siRNA following treatment of GL-V9, immunostained for LC3 (green) and LAMP-1 (red) (G) or ASC (green) and p62 (red) (H). Scale bars, 10 µm. (I) Immunoblot analysis of ASC, processed caspase-1 and IL-1β in supernatants and lysates of differentiated THP-1 cells transfected with AMPK siRNA following treatment of 500 ng/ml LPS and 27 μM GL-V9 for 6 h, finally stimulated with 4 μM nigericin for 3 h. Data are representative of at least three experiments.
To further verify the role of AMPK-ULK1 pathway in inhibition of NLRP3 inflammasome of GL-V9, we diminished the expression of AMPK in differentiated THP-1 cells by siRNA (Fig. 7C). The activation of ULK1 was reversed after transfection of AMPK siRNA (Fig. 7D). Diminishing AMPK expression impaired the formation of autophagosome induced by GL-V9 (Fig. 7E). Additionally, diminishing AMPK expression decreased GFP-LC3 puncta accumulation in differentiated THP-1 cells treated with GL-V9 (Fig. 7F). The formation of autophagolysosome trigged by GL-V9 was blocked after diminishing AMPK expression (Fig. 7G). AMPK siRNA transfection reversed the co-localization of ASC and p62 (Fig. 7H). Furthermore, the inhibitory effects of GL-V9 on the expression of mature IL-1β (p17) in the supernatants and cleaved caspase-1 (p10) and ASC in the lysates were remarkably attenuated after diminishing AMPK expression (Fig. 7I). Our findings demonstrated that GL-V9 triggered autophagy and promoted degradation of NLRP3 inflammasome via activation of AMPK-ULK1 pathway.
Discussion
The high risk of colorectal cancer is associated with the progression of chronic inflammation.28-30 Our study showed that GL-V9 prevented AOM/DSS-induced colitis-associated tumorigenesis and suppressed the chronic infiltration of immune cells and inflammation-associated signaling pathway in colitis-associated colon cancer. To assess the mechanism of the inhibitory effect of GL-V9 on the inflammation, we investigated the roles of GL-V9 in the recurring colitis. The results showed that treatment of GL-V9 attenuated the severity of colitis by reducing intestinal mucosal damage, the infiltration of inflammatory cells and inhibiting activation of the inflammatory signaling. In the development of colitis, NLRP3 inflammasome was activated excessively and persistently, which was seem to be a potential target for therapeutics of IBD.31 Our study showed that NLRP3 inflammasome was inhibited by GL-V9 treatment in vivo and in vitro. Meanwhile, we found GL-V9 triggered autophagy to degrade NLRP3 inflammasome in differentiated THP-1 cells and BMDMs by recruiting p62 and LC3. Repressing formation or degradation of autophagosome reversed the effect of GL-V9 on NLRP3 inflammasome. Activation of AMPK signaling rapidly led to autophagosome formation through activation of ULK1 but not inhibition of mTOR after treatment of GL-V9. Furthermore, diminishing AMPK expression resulted in less autophagy induction and more NLRP3 inflammasome activation compared to GL-V9 group. Together, these data indicated that GL-V9 attenuated experimental colitis and colitis-associated tumorigenesis through inhibiting NLRP3 inflammasome by triggering autophagy.
It is well known that inflammation plays an important role in the initiation, promotion and progression of tumor development. Although more and more studies have showed that the non-resolving inflammation increased the risk of cancer, such as ulcerative colitis, which increased the risk of colorectal cancer, however the underlying mechanisms was still not clear.32 Therefore, it is necessary for the anti-inflammatory intervention in inflammation-associated cancer.33,34 The promotion of tumor development by inflammation correlated with production of cytokines. High levels of IL-1β, a pro-inflammatory cytokine secreted by macrophage, aggravated the degree of inflammation.35-37 Inflammasomes involved in the maturation of IL-1β, which were activated after cellular stress and triggered caspase-1 activation.8 Activation of inflammasomes contributed to inflammation-associated diseases such as ulcerative colitis and colitis-associated colon cancer via mediating host defense against microbial pathogens and maintaining intestinal homeostasis.38 Therefore, inflammasomes were constantly recognized as a target, which was intervened in treatment of inflammation and cancer.
The function of autophagy is to maintain the intracellular homeostasis through the degradation of cellular content. In response to cellular stress, autophagy plays a crucial role in preventing accumulation of damaged proteins and organelles. In autophagy-defective cells and tissues, accumulation of intracellular garbage leads to cell death, tissue damage and chronic inflammation.39 In macrophages, autophagy also regulates the function of inflammasomes.19 Activation of inflammasomes trigger autophagy to degrade inflammasomes, which is involved in maintenance of homeostasis. In aging process, degradation of autophagy function result in NLRP3 inflammasome activation .40 Therefore, induction of autophagy is an effective means to inhibit the inflammasome.
The signaling pathway that triggered autophagy is associated with mTOR function, which is as a critical negative regulator of autophagy.41,42 The mTOR kinase forms two multiple complexes, mTOR complex 1 (mTORC1) which is sensitive to rapamycin and mTOR complex 2 (mTORC2) which is insensitive to rapamycin.43 Under starvation conditions or rapamycin treatment, mTORC1 is inhibited then triggered autophagy.44,45 However, under nutrient conditions, suppression of mTOR is not necessary for the induction of autophagy.46 It is reported that activation of AMPK triggered autophagy rather than inhibition of mTOR.47 In our study, we found that AMPK was activated by phosphorylation at Thr172 but have no influence on mTOR after GL-V9 treatment (Fig. 7B). After diminishing AMPK expression by siRNA, autophagy triggered by GL-V9 was suppressed. These data indicated that GL-V9 induced the autophagy via activating AMPK rather than mTOR.
Previous studies have shown that GL-V9 could alleviate DSS-induced colitis and illustrated its anti-oxidative mechanism by up-regulating Trx-1 via activation of AMPK/FOXO3 a pathway.20 However, the role of GL-V9 in tumorigenesis is not clear. In the present study, we demonstrated that GL-V9 exerted the chemopreventive effect to prevent tumorigenesis in colitis-associated colon cancer through inhibiting inflammation. We further illustrated the mechanism of GL-V9 that GL-V9 inhibited NLRP3 inflammasome by triggering autophagy via activating AMPK-ULK1 pathway. Our study suggested that GL-V9 could be a new anti-inflammatory and anti-cancer drug for IBD and colitis-associated colon cancer.
Materials and methods
Reagents and antibodies
GL-V9 (C24H27NO5, MW: 409.47), prepared from Dr. Zhiyu Li (China Pharmaceutical University, China), was dissolved in dimethylsulfoxide (DMSO) to 100 mM and stored at -20°C, and freshly diluted with RPMI-1640 medium (Gibco, Carlsbad, USA) or Dulbecco's Modified Eagle Medium (DMEM, GIBCO, Carlsbad, USA) to the final concentration in vitro study. In vivo study, GL-V9 was prepared as intragastric administration (0.5% sodium carboxyl methyl cellulose (CMC)) by Dr. Xue Ke from College of Pharmacy, China Pharmaceutical University. The DSS-treated group of mice were administered 0.5% CMC as vehicle.
LPS (E. coli: Serotype O55:B5), Azoxymethane (AOM), Dimethylsulfoxide (DMSO), phorbol 12-myristate 13-acetate (PMA) and 3-MA were purchased from Sigma-Aldrich (St. Louis, USA). Dextran sulfate sodium (DSS, molecular weight 36–50 kDa) was obtained from MP Biomedicals Inc. (Irvine, USA). Dye DAPI was purchased from Invitrogen (Carlsbad, USA). Paraformaldehyde (PFA) was purchased from Yonghua Chemical Technology (Jiangsu) Co. Ltd. (Changshu, China). Triton X-100 was purchased from Shanghai Chao Rui Biotech. Co. Ltd. (Shanghai, China). Murine GM-CSF was obtained from PeproTech (Suzhou, China). BSA was purchased from Roche Diagnosis (Shanghai) Ltd. (Shanghai, China).
Myeloperoxidase (MPO) activity assay kit was purchased from Nanjing Jiancheng Bioengineering Institute (Nanjing, China). Nitric Oxide Synthase (NOS) Assay Kit was purchased from Beyotime Institute of Biotechnology (Nanjing, China). ELISA kits for mouse IL-1β, TNF-α, IL-6, IFN-γ, IL-17 and human IL-1β were purchased from Boster Biotech Co. Ltd. (Wuhan, China).
Primary antibodies against IL-1β, caspase-1, ASC, LAMP-1 and β-actin were obtained from Santa Cruz Biotechnology (CA, USA); Beclin-1, LC3 and AMPK was from Bioworld (OH, USA) and antibodies against p-AMPK, p-ULK1 (Ser555), p-ULK1 (Ser757), ULK1, p-mTOR (Ser2448), mTOR, p-p70S6 K (Thr389) and p70S6 K were purchased from Cell Signaling Technology (Danvers, MA); Antibodies to NLRP3 and SQSTM1/p62 were obtained from Abcam (Cambridge, UK). IRDye™800 conjugated secondary antibodies were obtained from Rockland Inc. (Philadelphia, USA). FITC-anti-F4/80, FITC-anti-CD11b, PE-anti-Gr-1 and PE-anti-Ly6G were purchased from eBioscience (San Diego, USA). Alexa Fluor 488 donkey anti-rabbit IgG, Alexa Fluor 594 donkey anti-rabbit IgG, Alexa Fluor 594 donkey anti-mouse IgG were obtained from Invitrogen (CA, USA).
Cell culture
Human acute monocytic leukemia THP-1 cells were obtained from CBCAS (Cell Bank of the Chinese Academic of Sciences, Shanghai, China). THP-1 cells were cultured in RPMI-1640 medium (Gibco, Carlsbad, USA), supplemented with 10% (v/v) fetal bovine serum (Gibco, Carlsbad, USA) and 0.05 mM 2-mercaptoethanol, 100 U/ml benzyl penicillin and 100 mg/m streptomycin. Cells were cultured in a humidified environment with 5% CO2 at 37°C. Differentiation of THP-1 cells was induced by 0.5 mM phorbol 12-myristate 13-acetate (PMA) for 3 h. The differentiated cells were washed three times with PBS and treated with 500 ng/ml LPS in the absence or presence of GL-V9, then stimulated with nigericin (4 μM) for 3 h.
Bone marrow derived macrophages (BMDMs) were isolated from C57 BL/6 mice and cultured with DMEM medium (Gibco, Carlsbad, USA) supplemented with 10% (v/v) fetal bovine serum (Gibco, Carlsbad, USA) and 20 ng/ml GM-CSF (PeproTech, USA). Cells were harvested and seeded on cell culture dishes (60 mm × 15 mm). Exchanging culture medium every 3 days, adherent macrophages were obtained within about one week. After being cultured for 6 h without GM-CSF, the cells were washed three times with PBS and treated with 500 ng/ml LPS in the absence or presence of GL-V9, then stimulated with nigericin (4 μM) for 3 h.
Colitis-associated colon cancer and experimental recurring colitis
Female C57 BL/6 mice, 6–8 weeks old, weighing 18–22 g, were supplied by Shanghai Laboratory Animal Center, China Academy of Sciences and manipulated in accordance with the local Ethical Committee guidelines. Experimental protocols were in accordance with National Institutes of Health regulations and approved by the Institutional Animal Care and Use Committee. Throughout the acclimatization and study periods, all animals had access to food and water ad libitum and were maintained on a 12 h light/dark cycle (21±2°C with a relative humidity of 45±10%).
To assess the induction of colitis-associated colon cancer (CAC), mice were given a single i.p. injection of the mutagen azoxymethane (AOM, Sigma-Aldrich) (10 mg/kg body weight) in combination with three cycles of 3% DSS in drinking water for 5 days followed by regular drinking water for 14 days (Fig. 1A). Thirty mice were randomly assigned to AOM/mock, AOM/DSS and AOM/DSS+GL-V9 groups, ten mice in each group. The mice were treated GL-V9 80 mg/kg every day via gastric intubation starting 7 days before the AOM injection, until the termination of the experiment. Animals were blindly monitored for weight loss daily during DSS treatment and once every 2 days during regular water administration to assess disease progression. Animals were sacrificed following completion of either model or when they reached the limits endpoints.
To assess the induction of recurring colitis, mice were given 3 cycles of 3% dextran sulfate sodium salt (DSS) (MP Biomedical, LLC) dissolved in drinking water for 5 consecutive days followed by regular drinking water for 14 days as illustrated in Fig. 3A (without the addition of AOM; 21). Forty mice were randomly assigned to normal, DSS-treated and GL-V9 (6.25, 12.5 or 25 mg/kg)-treated groups, eight mice in each group. GL-V9 was given every day via gastric intubation from day 1 to day 57, respectively. Animals were blindly monitored for weight loss daily during DSS treatment and once every 2 days during regular water administration to assess disease progression. Animals were sacrificed following completion of either model or when they reached the limits endpoints.
Macroscopic assessment and histological analysis of colonic lesions
After AOM/DSS-induced colitis-associated colon cancer and DSS-induced recurring colitis, the mice were sacrificed and colons were removed, opened longitudinally, and washed with phosphate-buffered saline (PBS). The pieces of colonic tissue were fixed in 10% neutral-buffered formalin and routinely paraffin embedded and processed. The histological analysis was performed as previously described48.
Immunofluorescence of colon tissues
The Gr-1+, F4/80+ and CD11b+ cells infiltration analysis was performed on paraffin-embedded colon tissue sections. Briefly, the sections were deparaffinized, rehydrated and washed in PBS. After treating with 3% hydrogen peroxide, blocking with 3% bovine serum albumin (BSA), the sections were incubated for 1 h at room temperature with anti-F4/80+, anti-Gr-1+ or anti-CD11b+ (1:100). The slides were then counter-stained with DAPI for 30 min. The reaction was stopped by thorough washing in water for 5 min. Images were acquired by confocal laser-scanning microscope (Olympus, Lake Success, NY). Settings for image acquisition were identical for control and experimental tissues.
Cytokine quantification by enzyme-linked immunoassay
Colons from mice in each group were homogenated with lysis buffer to extract total protein. The homogenate was centrifuged at 12,000 × g at 4°C for 15 min. The amount of total extracted protein was determined by BCA™ protein assay kit (Thermo, MA, USA). The amounts of TNF-α, IL-6, IL-17 and IFN-γ in the colon homogenate were measured by ELISA kit. IL-1β production in supernatant differentiated THP-1 cells and BMDMs were measured by ELISA kits according to the manufacturers’ recommendations.
Single-cell preparation and FACS analysis
To prepare single-cell suspension, colonic tissues were minced, grinded and filtered through a 40 μm nylon mesh strainer. The cell suspension was resuspended in 1 ml PBS buffer and centrifuged repeatedly. Then resuspended cell pellets were diluted into 5–10 × 106 cells/ml and subjected to FACS analysis as previously described.48
Measurement of mature IL-1β
Cells cultured in 6-well plates were washed with OPTI-MEM, and 2 ml OPTI-MEM was added to each well along with reagents, followed by culture for 3 h. Medium from each well was mixed with 2 ml methanol and 0.5 ml chloroform, vortexed, and centrifuged at 12,000 × g at 4°C for 5 min. The upper phase of each sample was removed and 0.5 ml methanol was added. Samples were centrifuged again at 12,000 × g at 4°C for 5 min as described above, then supernatants were removed and pellets were dried for 5 min at 50°C. Then, 20 µl loading buffer was added to each sample, followed by boiling for 10 min before SDS-PAGE and immunoblot analysis with antibodies for the detection of mature IL-1β. Adherent cells in each well were lysed with the lysis buffer described above, followed by immunoblot analysis to determine the cellular content of various proteins.
Immunoprecipitation
Cells were collected and lysed with lysis buffer on ice for 1 h and centrifuged at 12,000 g at 4°C for 30 min. The supernatant fractions were collected and incubated with the appropriate antibody at 4°C overnight and precipitated with protein A/G-agarose beads (Santa Cruz, CA, USA) for another 4 h at 4°C. The beads were washed with the lysis buffer 3 times by centrifugation at 1,000 g at 4°C. The immunoprecipitated proteins were separated by SDS-PAGE and western blot was performed with the indicated antibodies.
Western blot analysis
After whole cell lysates were prepared. Western blot analysis was prepared as described previously.49 Protein samples were separated by 10% SDS-PAGE and transferred onto nitrocellulose membranes. The membranes were blocked with 1% BSA at 37°C for 1 h and incubated with indicated antibodies overnight at 4°C, followed by IRDye800 conjugated secondary antibody for 1 h at 37°C. Immunoreactive protein was detected with an Odyssey Scanning System (LI-COR Inc., Lincoln, Nebraska).
Cell transfection
GFP-LC3, mCherry-GFP-LC3 plasmid (Addgene, MA, USA) and the siRNA targeting human beclin-1, human p62 or human AMPK, or control siRNA with scrambled sequence (Santa Cruz, CA, USA) were transfected using Lipofectamine 2000™ reagent (Invitrogen, CA, USA), according to the manufacturer's instructions.50
Immunofluorescence
For confocal imaging of fixed cells, differentiated THP-1 cells and mouse BMDMs were used. After the appropriate treatment, cells were washed with PBS, fixed with 4% paraformaldehyde and washed again with PBS. Nonspecific receptors on cells were blocked for 1 h with 3% BSA. Rabbit anti-ASC (Santa Cruz, CA, USA), mouse anti-caspase-1 (Santa Cruz, CA, USA), rabbit anti-LC3 (Bioworld, OH, USA), mouse anti-LAMP-1 (Santa Cruz, CA, USA), mouse anti-p62 (Abcam, Cambridge, UK), rabbit anti-NLRP3 (Abcam, Cambridge, UK) were used for immunostaining. Alexa Fluor 488 donkey anti-rabbit IgG, Alexa Fluor 594 donkey anti-rabbit IgG, Alexa Fluor 594 donkey anti-mouse IgG were used as secondary antibodies (Invitrogen, CA, USA). Samples were observed and captured with a confocal laser scanning microscope (Olympus Corp., Tokyo, Japan).
Statistical analysis
The data shown in the study were obtained in at least three independent experiments and all results represent the mean ± S.E.M. Differences between the groups were assessed by one-way ANOVA test. Details of each statistical analysis used are provided in the figure legends. Differences with P values < 0.05 were considered statistically significant.
Supplementary Material
Conflict of interest statement
None declared.
Acknowledgments
This work was supported by the National Science & Technology Major Project (No. 2012ZX09304-001, No. 2013ZX09103-001-007), Program for Changjiang Scholars and Innovative Research Team in University (IRT1193), the National Natural Science Foundation of China (No. 91029744, No. 81373448 and No. 81373449), the Project Program of State Key Laboratory of Natural Medicines, China Pharmaceutical University (NO.SKLNMZZCX201606).
References
- 1.Parkin DM, Bray F, Ferlay J, Pisani P. Global cancer statistics, 2002. CA Cancer J Clin. 2005;55:74-108. doi: 10.3322/canjclin.55.2.74. PMID:15761078 [DOI] [PubMed] [Google Scholar]
- 2.Jemal A, Siegel R, Ward E, Hao Y, Xu J, Murray T, Thun MJ. Cancer statistics, 2008. CA Cancer J Clin. 2008;58:71-96. doi: 10.3322/CA.2007.0010. PMID:18287387 [DOI] [PubMed] [Google Scholar]
- 3.Eaden JA, Abrams KR, Mayberry JF. The risk of colorectal cancer in ulcerative colitis: a meta-analysis. Gut. 2001;48:526-35. doi: 10.1136/gut.48.4.526. PMID:11247898 [DOI] [PMC free article] [PubMed] [Google Scholar]
- 4.Freeman HJ. Colorectal cancer risk in Crohn's disease. World J Gastroenterol. 2008;14:1810-1. doi: 10.3748/wjg.14.1810. PMID:18350616 [DOI] [PMC free article] [PubMed] [Google Scholar]
- 5.Gupta RB, Harpaz N, Itzkowitz S, Hossain S, Matula S, Kornbluth A, Bodian C, Ullman T. Histologic inflammation is a risk factor for progression to colorectal neoplasia in ulcerative colitis: a cohort study. Gastroenterology. 2007;133:1099-105; quiz 340–1. doi: 10.1053/j.gastro.2007.08.001. PMID:17919486 [DOI] [PMC free article] [PubMed] [Google Scholar]
- 6.Rutter M, Saunders B, Wilkinson K, Rumbles S, Schofield G, Kamm M, Williams C, Price A, Talbot I, Forbes A. Severity of inflammation is a risk factor for colorectal neoplasia in ulcerative colitis. Gastroenterology. 2004;126:451-9. doi: 10.1053/j.gastro.2003.11.010. PMID:14762782 [DOI] [PubMed] [Google Scholar]
- 7.Karin M. NF-kappaB as a critical link between inflammation and cancer. Cold Spring Harb Perspect Biol. 2009;1:a000141. doi: 10.1101/cshperspect.a000141. PMID:20066113 [DOI] [PMC free article] [PubMed] [Google Scholar]
- 8.Schroder K, Tschopp J. The inflammasomes. Cell. 2010;140:821-32. doi: 10.1016/j.cell.2010.01.040. PMID:20303873 [DOI] [PubMed] [Google Scholar]
- 9.Nunes T, de Souza HS. Inflammasome in intestinal inflammation and cancer. Mediators Inflamm. 2013;2013:654963. doi: 10.1155/2013/654963. PMID:23606794 [DOI] [PMC free article] [PubMed] [Google Scholar]
- 10.Li J, Moran T, Swanson E, Julian C, Harris J, Bonen DK, Hedl M, Nicolae DL, Abraham C, Cho JH. Regulation of IL-8 and IL-1beta expression in Crohn's disease associated NOD2/CARD15 mutations. Hum Mol Genet. 2004;13:1715-25. doi: 10.1093/hmg/ddh182. PMID:15198989 [DOI] [PubMed] [Google Scholar]
- 11.Zhernakova A, Festen EM, Franke L, Trynka G, van Diemen CC, Monsuur AJ, Bevova M, Nijmeijer RM, van 't Slot R, Heijmans R, et al. Genetic analysis of innate immunity in Crohn's disease and ulcerative colitis identifies two susceptibility loci harboring CARD9 and IL18RAP. Am J Hum Genet. 2008;82:1202-10. doi: 10.1016/j.ajhg.2008.03.016. PMID:18439550 [DOI] [PMC free article] [PubMed] [Google Scholar]
- 12.Mariathasan S, Monack DM. Inflammasome adaptors and sensors: intracellular regulators of infection and inflammation. Nat Rev Immunol. 2007;7:31-40. doi: 10.1038/nri1997. PMID:17186029 [DOI] [PubMed] [Google Scholar]
- 13.Dinarello CA, Simon A, van der Meer JW. Treating inflammation by blocking interleukin-1 in a broad spectrum of diseases. Nat Rev Drug Discov. 2012;11:633-52. doi: 10.1038/nrd3800. PMID:22850787 [DOI] [PMC free article] [PubMed] [Google Scholar]
- 14.Behrends C, Sowa ME, Gygi SP, Harper JW. Network organization of the human autophagy system. Nature. 2010;466:68-76. doi: 10.1038/nature09204. PMID:20562859 [DOI] [PMC free article] [PubMed] [Google Scholar]
- 15.Levine B, Deretic V. Unveiling the roles of autophagy in innate and adaptive immunity. Nat Rev Immunol. 2007;7:767-77. doi: 10.1038/nri2161. PMID:17767194 [DOI] [PMC free article] [PubMed] [Google Scholar]
- 16.Schmid D, Munz C. Innate and adaptive immunity through autophagy. Immunity. 2007;27:11-21. doi: 10.1016/j.immuni.2007.07.004. PMID:17663981 [DOI] [PMC free article] [PubMed] [Google Scholar]
- 17.White E, Karp C, Strohecker AM, Guo Y, Mathew R. Role of autophagy in suppression of inflammation and cancer. Curr Opin Cell Biol. 2010;22:212-7. doi: 10.1016/j.ceb.2009.12.008. PMID:20056400 [DOI] [PMC free article] [PubMed] [Google Scholar]
- 18.Saitoh T, Fujita N, Jang MH, Uematsu S, Yang BG, Satoh T, Omori H, Noda T, Yamamoto N, Komatsu M, et al. Loss of the autophagy protein Atg16L1 enhances endotoxin-induced IL-1beta production. Nature. 2008;456:264-8. doi: 10.1038/nature07383. PMID:18849965 [DOI] [PubMed] [Google Scholar]
- 19.Shi CS, Shenderov K, Huang NN, Kabat J, Abu-Asab M, Fitzgerald KA, Sher A, Kehrl JH. Activation of autophagy by inflammatory signals limits IL-1beta production by targeting ubiquitinated inflammasomes for destruction. Nat Immunol. 2012;13:255-63. doi: 10.1038/ni.2215. PMID:22286270 [DOI] [PMC free article] [PubMed] [Google Scholar]
- 20.Zhao Y, Sun Y, Ding Y, Wang X, Zhou Y, Li W, Huang S, Li Z, Kong L, Guo Q, et al. GL-V9, a new synthetic flavonoid derivative, ameliorates DSS-induced colitis against oxidative stress by up-regulating Trx-1 expression via activation of AMPK/FOXO3 a pathway. Oncotarget. 2015;6:26291-307. doi: 10.18632/oncotarget.4657. PMID:26327408 [DOI] [PMC free article] [PubMed] [Google Scholar]
- 21.Neufert C, Becker C, Neurath MF. An inducible mouse model of colon carcinogenesis for the analysis of sporadic and inflammation-driven tumor progression. Nat Protoc. 2007;2:1998-2004. doi: 10.1038/nprot.2007.279. PMID:17703211 [DOI] [PubMed] [Google Scholar]
- 22.Egger B, Bajaj-Elliott M, MacDonald TT, Inglin R, Eysselein VE, Buchler MW. Characterisation of acute murine dextran sodium sulphate colitis: cytokine profile and dose dependency. Digestion. 2000;62:240-8. doi: 10.1159/000007822. PMID:11070407 [DOI] [PubMed] [Google Scholar]
- 23.Siegmund B, Lehr HA, Fantuzzi G, Dinarello CA. IL-1 beta -converting enzyme (caspase-1) in intestinal inflammation. Proc Natl Acad Sci U S A. 2001;98:13249-54. doi: 10.1073/pnas.231473998. PMID:11606779 [DOI] [PMC free article] [PubMed] [Google Scholar]
- 24.Klionsky DJ, Abdelmohsen K, Abe A, Abedin MJ, Abeliovich H, Acevedo Arozena A, Adachi H, Adams CM, Adams PD, Adeli K, et al. Guidelines for the use and interpretation of assays for monitoring autophagy (3rd edition). Autophagy. 2016;12:1-222. doi: 10.1080/15548627.2015.1100356. PMID:26799652 [DOI] [PMC free article] [PubMed] [Google Scholar]
- 25.Mathew R, Karp CM, Beaudoin B, Vuong N, Chen G, Chen HY, Bray K, Reddy A, Bhanot G, Gelinas C, et al. Autophagy suppresses tumorigenesis through elimination of p62. Cell. 2009;137:1062-75. doi: 10.1016/j.cell.2009.03.048. PMID:19524509 [DOI] [PMC free article] [PubMed] [Google Scholar]
- 26.Egan DF, Shackelford DB, Mihaylova MM, Gelino S, Kohnz RA, Mair W, Vasquez DS, Joshi A, Gwinn DM, Taylor R, et al. Phosphorylation of ULK1 (hATG1) by AMP-activated protein kinase connects energy sensing to mitophagy. Science. 2011;331:456-61. doi: 10.1126/science.1196371. PMID:21205641 [DOI] [PMC free article] [PubMed] [Google Scholar]
- 27.Kim J, Kundu M, Viollet B, Guan KL. AMPK and mTOR regulate autophagy through direct phosphorylation of Ulk1. Nat Cell Biol. 2011;13:132-41. doi: 10.1038/ncb2152. PMID:21258367 [DOI] [PMC free article] [PubMed] [Google Scholar]
- 28.Terzic J, Grivennikov S, Karin E, Karin M. Inflammation and colon cancer. Gastroenterology. 2010;138:2101-14 e5. doi: 10.1053/j.gastro.2010.01.058. [DOI] [PubMed] [Google Scholar]
- 29.Fantini MC, Pallone F. Cytokines: from gut inflammation to colorectal cancer. Curr Drug Targets. 2008;9:375-80. doi: 10.2174/138945008784221206. PMID:18473765 [DOI] [PubMed] [Google Scholar]
- 30.Triantafillidis JK, Nasioulas G, Kosmidis PA. Colorectal cancer and inflammatory bowel disease: epidemiology, risk factors, mechanisms of carcinogenesis and prevention strategies. Anticancer Res. 2009;29:2727-37. PMID:19596953 [PubMed] [Google Scholar]
- 31.Bauer C, Duewell P, Mayer C, Lehr HA, Fitzgerald KA, Dauer M, Tschopp J, Endres S, Latz E, Schnurr M. Colitis induced in mice with dextran sulfate sodium (DSS) is mediated by the NLRP3 inflammasome. Gut. 2010;59:1192-9. doi: 10.1136/gut.2009.197822. PMID:20442201 [DOI] [PubMed] [Google Scholar]
- 32.Coussens LM, Werb Z. Inflammation and cancer. Nature. 2002;420:860-7. doi: 10.1038/nature01322. PMID:12490959 [DOI] [PMC free article] [PubMed] [Google Scholar]
- 33.Hanahan D, Weinberg RA. Hallmarks of cancer: the next generation. Cell. 2011;144:646-74. doi: 10.1016/j.cell.2011.02.013. PMID:21376230 [DOI] [PubMed] [Google Scholar]
- 34.Nathan C, Ding A. Nonresolving inflammation. Cell. 2010;140:871-82. doi: 10.1016/j.cell.2010.02.029. PMID:20303877 [DOI] [PubMed] [Google Scholar]
- 35.Ligumsky M, Simon PL, Karmeli F, Rachmilewitz D. Role of interleukin 1 in inflammatory bowel disease–enhanced production during active disease. Gut. 1990;31:686-9. doi: 10.1136/gut.31.6.686. PMID:2379873 [DOI] [PMC free article] [PubMed] [Google Scholar]
- 36.McAlindon ME, Hawkey CJ, Mahida YR. Expression of interleukin 1 beta and interleukin 1 beta converting enzyme by intestinal macrophages in health and inflammatory bowel disease. Gut. 1998;42:214-9. doi: 10.1136/gut.42.2.214. PMID:9536946 [DOI] [PMC free article] [PubMed] [Google Scholar]
- 37.Coccia M, Harrison OJ, Schiering C, Asquith MJ, Becher B, Powrie F, Maloy KJ. IL-1beta mediates chronic intestinal inflammation by promoting the accumulation of IL-17 A secreting innate lymphoid cells and CD4(+) Th17 cells. J Exp Med. 2012;209:1595-609. doi: 10.1084/jem.20111453. PMID:22891275 [DOI] [PMC free article] [PubMed] [Google Scholar]
- 38.Chen GY, Nunez G. Inflammasomes in intestinal inflammation and cancer. Gastroenterology. 2011;141:1986-99. doi: 10.1053/j.gastro.2011.10.002. PMID:22005480 [DOI] [PMC free article] [PubMed] [Google Scholar]
- 39.Singh R, Kaushik S, Wang Y, Xiang Y, Novak I, Komatsu M, Tanaka K, Cuervo AM, Czaja MJ. Autophagy regulates lipid metabolism. Nature. 2009;458:1131-5. doi: 10.1038/nature07976. PMID:19339967 [DOI] [PMC free article] [PubMed] [Google Scholar]
- 40.Salminen A, Kaarniranta K, Kauppinen A. Inflammaging: disturbed interplay between autophagy and inflammasomes. Aging (Albany NY). 2012;4:166-75. doi: 10.18632/aging.100444. PMID:22411934 [DOI] [PMC free article] [PubMed] [Google Scholar]
- 41.Levine B, Klionsky DJ. Development by self-digestion: molecular mechanisms and biological functions of autophagy. Dev Cell. 2004;6:463-77. doi: 10.1016/S1534-5807(04)00099-1. PMID:15068787 [DOI] [PubMed] [Google Scholar]
- 42.Chang YY, Juhasz G, Goraksha-Hicks P, Arsham AM, Mallin DR, Muller LK, Neufeld TP. Nutrient-dependent regulation of autophagy through the target of rapamycin pathway. Biochem Soc Trans. 2009;37:232-6. doi: 10.1042/BST0370232. PMID:19143638 [DOI] [PubMed] [Google Scholar]
- 43.Wullschleger S, Loewith R, Hall MN. TOR signaling in growth and metabolism. Cell. 2006;124:471-84. doi: 10.1016/j.cell.2006.01.016. PMID:16469695 [DOI] [PubMed] [Google Scholar]
- 44.He C, Klionsky DJ. Regulation mechanisms and signaling pathways of autophagy. Annu Rev Genet. 2009;43:67-93. doi: 10.1146/annurev-genet-102808-114910. PMID:19653858 [DOI] [PMC free article] [PubMed] [Google Scholar]
- 45.Jung CH, Ro SH, Cao J, Otto NM, Kim DH. mTOR regulation of autophagy. FEBS Lett. 2010;584:1287-95. doi: 10.1016/j.febslet.2010.01.017. PMID:20083114 [DOI] [PMC free article] [PubMed] [Google Scholar]
- 46.Lipinski MM, Hoffman G, Ng A, Zhou W, Py BF, Hsu E, Liu X, Eisenberg J, Liu J, Blenis J, et al. A genome-wide siRNA screen reveals multiple mTORC1 independent signaling pathways regulating autophagy under normal nutritional conditions. Dev Cell. 2010;18:1041-52. doi: 10.1016/j.devcel.2010.05.005. PMID:20627085 [DOI] [PMC free article] [PubMed] [Google Scholar]
- 47.Guo L, Stripay JL, Zhang X, Collage RD, Hulver M, Carchman EH, Howell GM, Zuckerbraun BS, Lee JS, Rosengart MR. CaMKIalpha regulates AMP kinase-dependent, TORC-1-independent autophagy during lipopolysaccharide-induced acute lung neutrophilic inflammation. J Immunol. 2013;190:3620-8. doi: 10.4049/jimmunol.1102975. PMID:23447692 [DOI] [PMC free article] [PubMed] [Google Scholar]
- 48.Yao J, Pan D, Zhao Y, Zhao L, Sun J, Wang Y, You QD, Xi T, Guo QL, Lu N.. Wogonin prevents lipopolysaccharide-induced acute lung injury and inflammation in mice via peroxisome proliferator-activated receptor gamma-mediated attenuation of the nuclear factor-kappaB pathway. Immunology. 2014;143:241-57. doi: 10.1111/imm.12305. PMID:24766487 [DOI] [PMC free article] [PubMed] [Google Scholar]
- 49.Qiang L, Yang Y, You QD, Ma YJ, Yang L, Nie FF, Gu HY, Zhao L, Lu N, Qi Q, et al. Inhibition of glioblastoma growth and angiogenesis by gambogic acid: an in vitro and in vivo study. Biochem Pharmacol. 2008;75:1083-92. doi: 10.1016/j.bcp.2007.10.033. PMID:18070617 [DOI] [PubMed] [Google Scholar]
- 50.Mu R, Qi Q, Gu H, Wang J, Yang Y, Rong J, Liu W, Lu N, You Q, Guo Q, et al. Involvement of p53 in oroxylin A-induced apoptosis in cancer cells. Mol Carcinog. 2009;48:1159-69. doi: 10.1002/mc.20570. PMID:19626645 [DOI] [PubMed] [Google Scholar]
Associated Data
This section collects any data citations, data availability statements, or supplementary materials included in this article.