Figure 2.
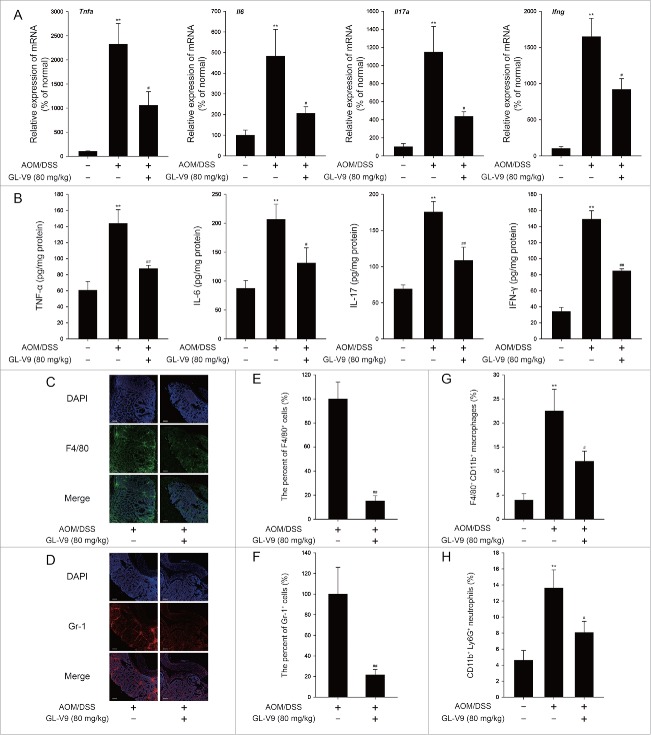
GL-V9 treatment inhibited inflammation in colitis-associated colon cancer. Inflammatory cytokine mRNA (A) and protein expression level (B) in AOM/DSS-treated mice colons following treatment of GL-V9. The distribution of F4/80+ cells (C) and Gr-1+ cells (D) infiltration were observed by confocal laser-scanning microscope. Representative images are shown. Scale bars, 100 µm. The F4/80 (E) and Gr-1 (F) expression was quantified with statistical significances. FACS analysis of macrophages (G) and neutrophils (H) in colonic tissues. Data are presented as mean ± SD. **P < 0.01 compared with AOM/mock group; #P < 0.05, ##P < 0.01 compared with AOM/DSS group.

