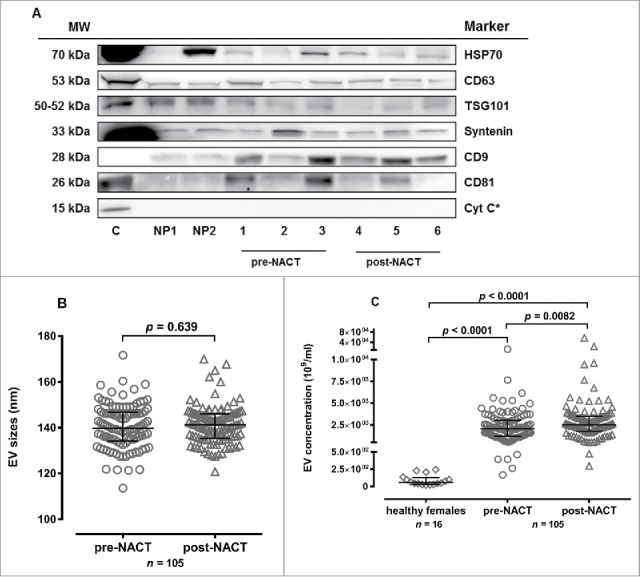
Figure 1.

EV characterization by western blot and nanoparticle tracking analysis. (A) EV marker expression analysis for HSP70, CD63, TSG101, Syntenin, CD9, CD81, Cytochrome C (Cyt C) in EV fractions from two healthy persons (NP1, NP2), three BC patients pre-NACT (1-3) and post-NACT (4-6). In all analyses, HEK cell culture supernatant derived EVs served as positive control, for Cyt C detection MCF-7 cell lysate (*) was used as control. (B) The EV size [median (interquartile range) nm] did not differ pre- and post-NACT (Mann-Whitney test). (C) Healthy females presented lower EV levels [median (interquartile range) 109/ml] compared to BC patients pre- and post-NACT. EV levels increased post-NACT in BC patients (Mann-Whitney test).
