

Abstract
Personalized medicine requires the identification of unambiguous prognostic and predictive biomarkers to inform therapeutic decisions. Within this context, the management of lymph node-negative breast cancer is the subject of much debate with particular emphasis on the requirement for adjuvant chemotherapy. The identification of prognostic and predictive biomarkers in this group of patients is crucial. Here, we demonstrate by tissue microarray and automated image analysis that the cocaine- and amphetamine-regulated transcript (CART) is expressed in primary and metastatic breast cancer and is an independent poor prognostic factor in estrogen receptor (ER)-positive, lymph node-negative tumors in two separate breast cancer cohorts (n = 690; P = 0.002, 0.013). We also show that CART increases the transcriptional activity of ERα in a ligand-independent manner via the mitogen-activated protein kinase pathway and that CART stimulates an autocrine/paracrine loop within tumor cells to amplify the CART signal. Additionally, we demonstrate that CART expression in ER-positive breast cancer cell lines protects against tamoxifen-mediated cell death and that high CART expression predicts disease outcome in tamoxifen-treated patients in vivo in three independent breast cancer cohorts. We believe that CART profiling will help facilitate stratification of lymph node-negative breast cancer patients into high- and low-risk categories and allow for the personalization of therapy.
Keywords: cocaine- and amphetamine-regulated transcript, breast cancer, prognosis, estrogen receptor
Introduction
Transcriptomic profiling of tumor specimens has identified a large number of breast cancer-associated genes for which the patho-physiological significance remains unknown. Previously, we described the discovery of novel breast cancer biomarkers through bioinformatic mining of publicly available data sets (O’Brien et al., 2007). In this manner, following re-analysis of the Van’t Veer et al. (2002) breast cancer data set, we identified the cocaine- and amphetamine-regulated transcript (CART) as a gene specifically upregulated in breast tumors with poor prognosis (O’Brien et al., 2007).
Originally described as a transcript upregulated in rat striatum after acute administration of cocaine and amphetamine (Douglass et al., 1995), CART is a leptin-regulated neuropeptide hormone (Kristensen et al., 1998) implicated in a variety of physiological and pathological processes, including regulation of body mass (Rogge et al., 2008), inhibition of food intake (Arora and Anubhuti, 2006), energy homeostasis (Koylu et al., 2006), bone metabolism (Elefteriou et al., 2005) and neuroendocrine malignancy (Bech et al., 2008).
In this study, we describe the prognostic value of CART in lymph node-negative breast cancer and its molecular mechanism of action in vitro. We demonstrate that CART is expressed in primary and metastatic breast cancer and, using a consistently applied threshold for definition of CART levels, that high CART expression is an independent poor prognostic marker in lymph node-negative tumors. We also show that CART mediates an autocrine/paracrine effect, leading to an amplification of the CART signal via induction of CART expression in breast cancer cells. Furthermore, CART increases the transcriptional activity of estrogen receptor-α (ERα) in a ligand-independent manner via activation of the mitogen-activated protein kinase (MAPK) pathway and phosphorylation of ERα at serine 118. Finally, we show that ectopic expression of CART in two independent ERα-positive breast cancer cell lines protects against tamoxifen-mediated cell death and that high CART expression predicts outcome in tamoxifen-treated patients in vivo.
Results
CART is expressed in primary breast cancer and lymph node metastases
CART protein expression was examined in normal breast epithelium, pimary breast tumors and lymph node metastases. Immunohistochemistry performed on 10 single patient tissue microarrays (TMA) containing normal breast epithelium, invasive cancer and lymph node metastasis and revealed high levels of tumor-specific CART protein expression in 20% of cases. CART expression was restricted to tumor cells and no stromal expression was evident (Figure 1a). The expression pattern was predominantly cytoplasmic; however, some membranous and granular staining was also seen. When present in the primary tumor, CART protein expression was also evident in the corresponding lymph node metastases. CART expression was not evident in normal breast epithelium in the 10 cases examined.
Figure 1.
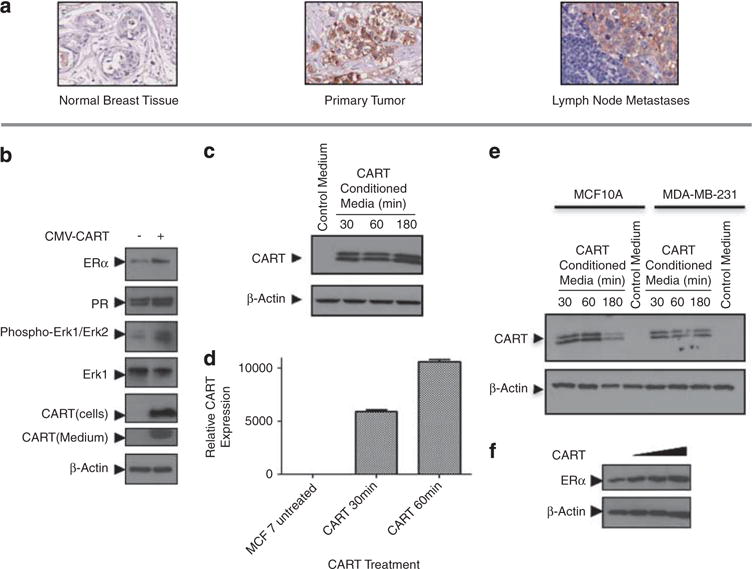
CART protein expression in primary and metastatic breast cancer and breast cancer cell lines. (a) Immunohistochemical analysis of breast cancer single patients chips demonstrating the absence of CART expression in normal breast epithelium (left panel), positive CART expression in primary breast cancer (central panel) and a lymph node metastasis from the same patient (right panel). CART expression was generally tumor specific and the pattern of expression seen was generally cytoplasmic. (b) Western immunoblot analysis of MCF-7 cells transfected with CMV-CART or empty vector control depicting an increase in ER expression, activation of the MAPK pathway (seen by an increase in ERK phosphorylation at Thr 202/Tyr 204) and increased expression of the ERα target gene, PR, following ectopic expression of CART. Additionally, secretion of CART peptide into MCF-7 culture medium is shown. (c) Western immunoblot demonstrating the induction of CART expression in MCF-7 cells over time following treatment with CART-conditioned medium. (d) Quantitative real-time–PCR demonstrating induction of CART mRNA following treatment of MCF-7 cells with CART-conditioned media. (e) Western immunoblot depicting the induction of CART expression in MCF-10A and MDA-MB-231 cells over time following treatment with CART-conditioned medium. (f) Western immunoblot depicting concentration dependent induction of ERα expression following treatment of MCF-7 cells with 1, 10 and 100 nM of recombinant CART (42–89) peptide.
CART stimulates CART expression in an autocrine/ paracine fashion
Western blot and immunohistochemistry analysis showed that CART was not expressed in a panel of breast cancer cells under normal growth conditions (Supplementary Figure 1A); therefore, MCF-7 breast cancer cells were transiently transfected with a CMV-CART expression construct. Ectopic expression of CART in MCF-7 cells resulted in increased ERα levels and a corresponding increase in progesterone receptor (PR), an endogenous ERα target gene (Figure 1b). Furthermore, similar to previous observations in bovine granulosa and AtT20 murine pituitary tumor cells (Lakatos et al., 2005; Jia et al., 2008; Sen et al., 2008), CART expression in breast cancer cells led to the activation of the MAPK pathway as evidenced by an increase in phosphorylation of extracellular signal-regulated kinase (Figure 1b). Moreover, CART was also secreted from MCF-7 cells, raising the intriguing possibility that it may also exert autocrine or paracrine effects (Figure 1b). Indeed, treatment of MCF-7 cells with CART-conditioned culture medium revealed that CART does stimulate an autocrine/paracine loop when compared with medium collected from cells not expressing CART, resulting in the amplification of CART expression at both the protein and mRNA level (Figures 1c and d). Furthermore, this effect was not limited to ER+ cell lines as treatment of both MCF-10A and MDA-MB-231 cells with CART-conditioned media also resulted in the induction of CART expression (Figure 1e).
CART activates ER transcriptional activity in a ligand-independent manner through the MAPK pathway
To examine the effect of exogenous CART on breast cancer cells, MCF-7 cells grown in hormone stripped/ phenol red-free media were treated with recombinant human CART(42–89) peptide, which resulted in a concentration-dependent upregulation of ERα at nano-molar concentrations (Figure 1f). As observed following ectopic expression of CART in MCF-7 cells (Figure 1b), treatment with 10 nM recombinant CART peptide activated the MAPK pathway (Figure 2a) and, in addition, induced the phosphorylation of ERα at serine 118 (S118; Figure 2a).
Figure 2.
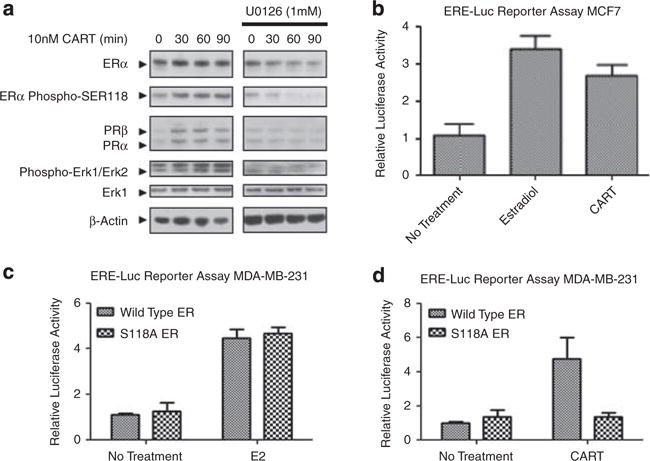
CART causes ligand-independent activation of ERαvia activation of the MAPK pathway and phosphorylation of ERα at Ser118. (a) Western blot analysis of ligand-independent activation of ER via the MAPK pathway following treatment of MCF-7 cells with recombinant CART peptide, with and without 30 min pre-treatment of cells with the Mek inhibitor U0126. (b) Luciferase reporter assay in MCF-7 cells demonstrating activation of an ERE-Luc construct by 10 nM CART and 1 nM E2. (c) Luciferase reporter assay in MDA-MB-231 cells transfected with either wild-type ERα or S118A ERα demonstrating comparable activation of an ERE-Luc reporter by both following induction with 1 nM E2. (d) Luciferase reporter assay in MDA-MB-231 cells transfected with either wild-type ERα or S118A ERα demonstrating loss of CART-mediated activation of an ERE-Luc reporter by both following induction with 10 nM recombinant CART (42–89) peptide. Results of all luciferase assays represent three independent experiments and error bars represent s.d.
Because S118 phosphorylation is a proven mechanism of ligand-independent activation of ERα via the MAPK pathway (Kato et al., 1995), the effect of CART stimulation on the induction of ERα transcriptional activity was examined. MCF-7 cells transfected with an estrogen responsive element-luciferase (ERE-Luc) reporter demonstrated clear activation of the reporter gene following treatment with CART peptide, to a similar extent as 17β-estradiol-mediated activation (Figure 2b). Furthermore, CART stimulation resulted in the induction of the endogenous ERα target gene PR (Figure 2a), suggesting that CART does indeed induce the transcriptional activation of ERα.
Suppression of the MAPK pathway by pre-treatment of MCF-7 cells with a Mek inhibitor (U0126) prevented CART-mediated induction of ERα and prevented the CART-stimulated phosphorylation of ERα at S118 (Figure 2a). Furthermore, MAPK inhibition resulted in a loss of accumulation of PR following CART treatment (Figure 2a), demonstrating that CART stimulates the ligand-independent activation of ERα through MAPK-mediated phosphorylation of ERα at S118. To confirm these findings, ER-negative MDA-MB-231 breast cancer cells were transfected with an ERE-Luc reporter and either wild-type ERα or ERα with a mutation of serine 118 to alanine. Substitution of S118 for alanine had no effect on the ability of 17β-estradiol to activate ERα (Figure 2c); however, the mutation almost completely abrogated CART-mediated activation of the ERE-luc reporter (Figure 2d), proving that MAPK-mediated phosphorylation at S118 is responsible for CART-mediated activation of ERα. A model describing the activation of ERα by CART is shown in Supplementary Figure 2.
CART is an independent prognostic factor in lymph node-negative tumors
Having demonstrated the phenotypic effects of modulating CART expression in breast cancer cells, we proceeded to examine CART protein expression in two independent breast cancer cohorts represented on TMAs using a manual cytoplasmic intensity score and automated image analysis (patient characteristics are described in Supplementary Table 1). Antibody specificity was confirmed by both immunohistochemical analysis of cell pellets (Supplementary Figure 1B) and western blotting (Supplementary Figure 1C). Manual analysis of CART status was classified using a cytoplasmic intensity score (0 = negative, 1 + = weak, 2 + = moderate and 3 + = strong), with low CART defined as 0, 1 and 2 + and high CART defined as 3 +. For automated image analysis, we used a threshold of median intensity plus one s.d. (which corresponded to an RGB (red, green, blue) intensity of 90, or 3 + on the manual scoring scale). Moreover, the correlation between manual analysis and automated analysis was excellent (r = 0.79, P<0.001), and the separation between low CART (0, 1+ and 2+) and high CART (3+) can be clearly seen (Figures 3b and c). In cohort I (n = 512, predominantly post-menopausal patients), 318 tumors (62%) were suitable for analysis and representative cores with relevant mark-up images are shown in Figure 3a. Automated image analysis identified 46 tumors (14.5%) demonstrating high levels of CART expression, which correlated with older age at diagnosis (P = 0.033; Supplementary Table 2).
Figure 3.
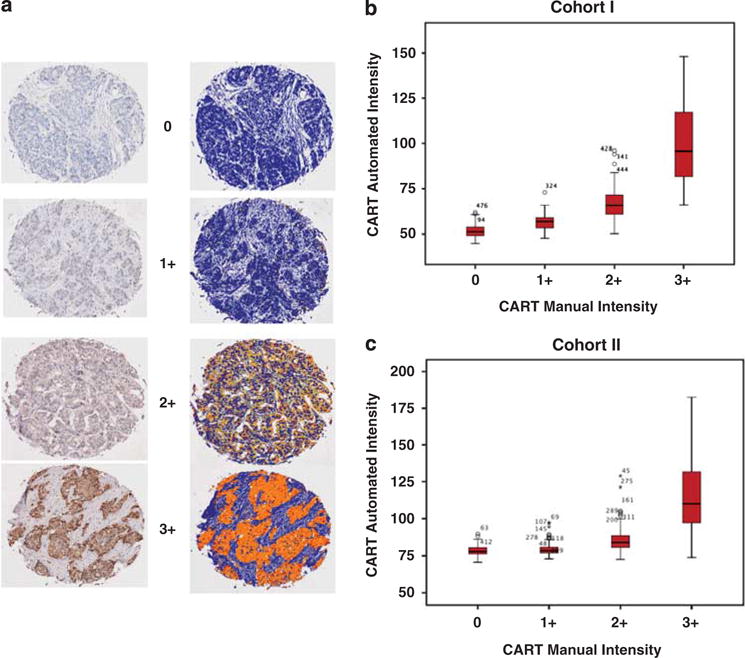
Manual and automated immunohistochemical analysis of CART expression. (a) Immunohistochemical analysis of primary breast cancer with corresponding markup images of automated algorithm used to quantify CART expression. Stromal tissue is mapped in blue on the markup image, and CART expression is mapped on an increasing scale from yellow (low levels of expression) to red (high levels of expression). (b, c) Box plots depicting the correlation between manual and automated analysis in cohorts I and II. Clear separation between low CART (0, 1+ and 2+) and high CART (3+) is seen. The Spearman-Rho correlation coefficient r = 0.79, P < 0.001. Figures on plots are outliers, and refer to tumour id’s.
Kaplan–Meier analysis revealed a significant association between high CART expression and decreased overall survival (OS) within the entire cohort (P = 0.0002; Figure 4a). Age-adjusted Cox multivariate analysis of OS revealed that CART was still a significant predictor of reduced OS (hazard ratio (HR) = 2.06, 95% confidence interval (CI) 1.42–2.96, P < 0.001) in the entire cohort; however, multivariate Cox regression analysis of OS controlling for age, grade, lymph node status, tumor size, ER, Her2 and Ki-67 demonstrated that CART was not an independent prognostic marker (HR = 1.29, 95% CI 0.79–2.10, P < 0.312; Table 1).
Figure 4.
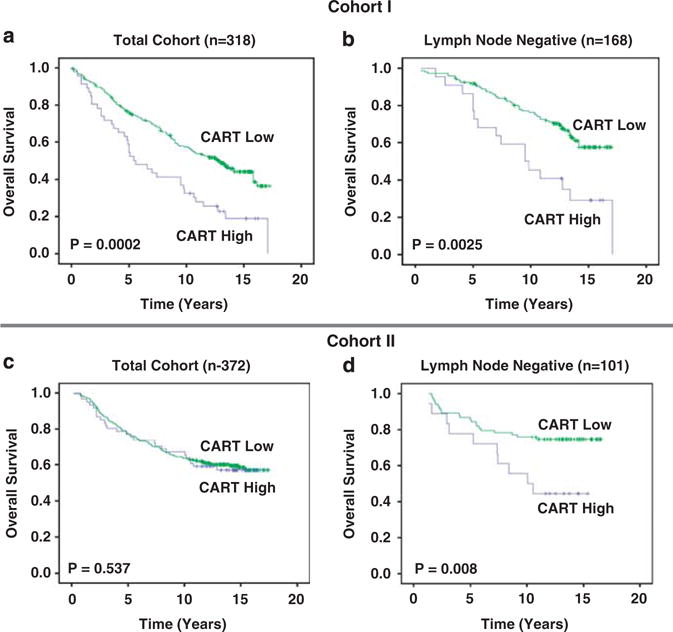
CART protein expression is associated with a poor prognosis in lymph node-negative tumors. (a) Kaplan–Meier analysis of cohort I (n = 318) demonstrating the association between increased CART expression with poor overall survival (OS). (b) Kaplan–Meier analysis of lymph node-negative patients in cohort I (n = 168) demonstrating the association between high CART expression with poor OS. (c) Kaplan–Meier analysis of cohort II (n = 372) demonstrating no association between CART expression and outcome. (d) Kaplan–Meier analysis of lymph node-negative patients within cohort II (n = 101) demonstrating an association between increased levels of CART expression and decreased OS.
Table 1.
Cox regression analysis of OS in cohort I
| All patients (n = 318)
|
Lymph node negative (n = 168)
|
Lymph node positive (n = 112)
|
||||
|---|---|---|---|---|---|---|
| HR (95% CI) | P-value | HR (95% CI) | P-value | HR (95% CI) | P-value | |
| CART | Univariate | Univariate | Univariate | |||
| Low | 1.00 | 1.00 | 1.00 | |||
| High | 1.99 (1.38–2.86) | <0.001 | 2.37 (1.33–4.21) | 0.003 | 1.09 (0.52–2.27) | 0.814 |
| CART | Age adjusted | Age adjusted | Age adjusted | |||
| Low | 1.00 | 1.00 | 1.00 | |||
| High | 2.06 (1.42–2.96) | <0.001 | 2.43 (1.36–4.31) | 0.003 | 1.07 (0.51–2.24) | 0.853 |
| CART | Multivariate | Multivariate | Multivariate | |||
| Low | 1.00 | 1.00 | 1.00 | |||
| High | 1.29 (0.79–2.10) | 0.312 | 1.98 (1.02–3.86) | 0.042 | 1.05 (0.49–2.24) | 0.907 |
Abbreviations: CART, cocaine- and amphetamine-regulated transcript; CI, confidence interval; ER, estrogen receptor; HR, hazard ratio; OS, overall survival.
Multivariate analysis included adjustment for grade, age, nodal status, ER, HER2, Ki-67 and tumor size.
Subset analysis of cohort I revealed that high CART expression was associated with reduced OS in lymph node-negative tumors (P = 0.0025; Figure 4b); however, this effect was not seen in lymph node-postive patients. Furthermore, age-adjusted multivariate analysis in this group confirmed the association between increased levels of CART and reduced OS (HR = 2.43, 95% CI 1.36–4.31, P = 0.003; Supplementary Table 1). This effect was maintained in the multivariate model described above (HR = 1.98, 95% CI 1.02–3.86, P = 0.042) demonstrating that increased CART expression is an independent prognostic marker in lymph node-negative breast tumors (Table 1).
In order to expand our analysis, CART expression was further examined in pre-menopausal patients in cohort II (n = 500), where 372 tumors (74%) were suitable for analysis. Again, data were dichotomized using the same scoring model as cohort I (cut off RGB = 90 for automated analysis, 3 + for manual analysis) and 16.4% of tumors (n = 61) expressed high levels of CART. The mean age of patients with high CART expression was again older (P = 0.007); however, no relationship was seen between CART expression and other clinicopathological parameters (Supplementary Table 2). Given our previously mentioned findings suggesting that CART activated ERα in a ligand-independent fashion, we examined the relationship between CART and ERα and PR in cohort II. This was a relatively homogenous cohort, restricted to premenopausal women, all of whom were treated in a uniform fashion. There were no PR-negative tumors in the ER-positive/CART high group, suggesting that CART increases the expression of PR in premenopausal patients. This effect was not changed by tamoxifen treatment validating our in vitro findings (Figures 1 and 2).
There was no association between CART expression and OS in the entire cohort II (Figure 4c). It should be noted that the mean age of patients in cohort I was higher than that of cohort II (65 v 45) and that cohort II also contained a greater number of lymph node-positive cases (Supplementary Table 1). Subset analysis again revealed a significant association between high CART expression and decreased OS in patients with lymph node-negative tumors (P = 0.008; Figure 4d). Cox univariate and multivariate analysis in this subgroup revealed that increased CART was associated with reduced OS after adjusting for age alone (HR = 2.34, 95% CI 1.09–5.04, P = 0.029) and was also an independent prognostic factor (HR = 4.77, 95% CI 1.89–12.05, P = 0.001) in lymph node-negative tumors of pre-menopausal patients (Table 2).
Table 2.
Cox regression analysis of OS in lymph node-negative tumors in cohort II
| Lymph node negative (n = 101)
|
Untreated lymph node negative (n = 47)
|
|||
|---|---|---|---|---|
| HR (95% CI) | P-value | HR (95% CI) | P-value | |
| CART | Univariate | Univariate | ||
| Low | 1.00 | 1.00 | ||
| High | 2.51 (1.18–5.33) | 0.017 | 5.54 (1.85–16.56) | 0.002 |
| CART | Age adjusted | Age adjusted | ||
| Low | 1.00 | 1.00 | ||
| High | 2.34 (1.09–5.04) | 0.029 | 5.26 (1.75–5.781) | 0.003 |
| CART | Multivariate | Multivariate | ||
| Low | 1.00 | 1.00 | ||
| High | 4.77 (1.89–12.05) | 0.001 | 5.67 (1.48–21.72) | 0.011 |
Abbreviations: CART, cocaine- and amphetamine-regulated transcript; CI, confidence interval; ER, estrogen receptor; HR, hazard ratio; OS, overall survival.
Multivariate analysis included adjustment for grade, age, nodal status, ER, HER2, Ki-67 and tumor size.
As half of cohort II received no adjuvant tamoxifen, the untreated arm of cohort II was then used to investigate the prognostic ability of CART in the absence of any treatment bias. Cox univariate analysis confirmed that CART was associated with a reduced OS (HR = 5.54, 95% CI 1.85–16.56, P = 0.002), and multivariate analysis demonstrated that CART was an independent prognostic factor in untreated lymph node-negative patients (HR = 5.67, 95% CI 1.48–21.72, P = 0.011; Table 2).
CART is associated with poor prognosis in tamoxifen-treated ER-positive tumors
Because ligand-independent activation of ERα via phosphorylation of S118 by the MAPK pathway has been described as a mechanism of modulating gene expression following tamoxifen treatment (Cheng et al., 2007; Yamashita et al., 2008; Zoubir et al., 2008), the relationship between CART expression and response to tamoxifen in both MCF-7 cells and a second ER+ breast cancer cell line, T47D, was examined. Ectopic expression of CART in both cell lines protected from tamoxifen-mediated cell death as measured by fluorescence-activated cell sorting analysis (Figure 5a).
Figure 5.
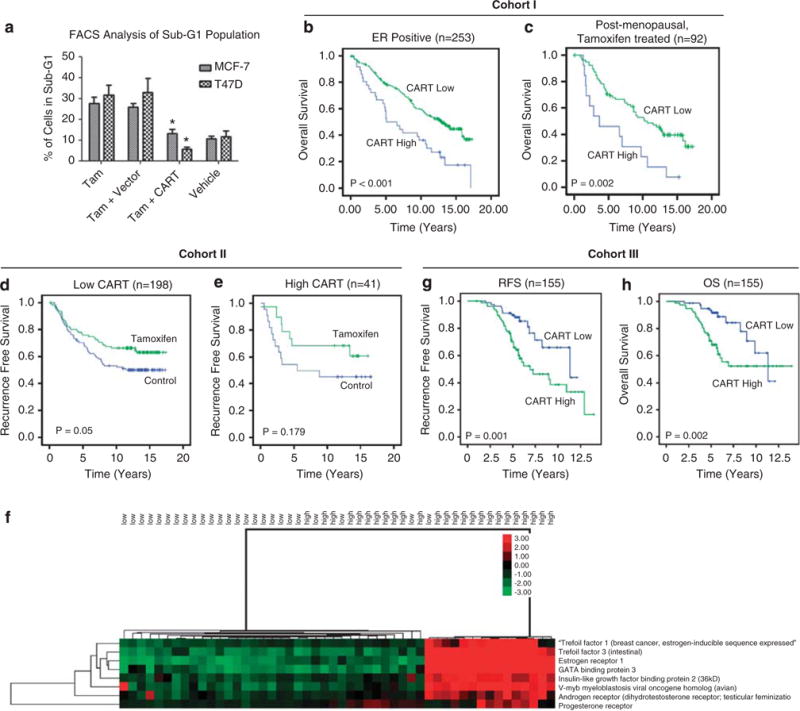
Increased levels of CART protein and mRNA expression are associated with poor tamoxifen response. (a) Fluorescence-activated cell sorting analysis of Sub-G1 population in MCF-7 and T47D cells transfected with CART or empty vector and treated with 1 μM tamoxifen for 48 h or vehicle alone (ethanol). Vehicle alone did not increase the amount of cells in sub-G1. Results depicted represent three independent experiments, and error bars represent s.d., *P<0.05. (b) Kaplan–Meier analysis of ER+ patients in cohort I (n = 253) demonstrating decreased OS associated with increased CART expression. (c) Kaplan–Meier analysis of postmenopausal ER+ patients in cohort I who received tamoxifen (n = 92) showing that high CART is associated with a reduced OS. (d) Kaplan–Meier analysis of premenopausal ER+ patients in cohort II with low CART (n = 198) demonstrating the beneficial effect of 2 years adjuvant tamoxifen and (e) loss of response in patients with high CART (n = 41). (f) Supervised hierarchical clustering demonstrating up regulation of a number of ERα response genes in tamoxifen-treated breast cancer patients with high levels of CART mRNA. (g) Kaplan–Meier analysis of patients in cohort III (n = 155) demonstrating decreased RFS associated with high CART mRNA expression. (h) Kaplan–Meier analysis of patients in cohort III (n = 155) demonstrating decreased OS associated with high levels of CART mRNA expression.
Having demonstrated that CART mediates ligand-independent activation of ERα transcriptional activity in vitro, the effect of CART expression in ER-positive tumors was examined. Subset analysis of ER+ tumors in cohort I revealed that increased levels of CART protein expression were associated with reduced OS (P < 0.001; Figure 5b), whereas high CART expression had no prognostic significance in ER− tumors (P = 0.253). Furthermore, as ectopic CART expression in ER+ breast cancer cell lines protected them from tamoxifen-mediated cell death, the relationship between CART expression and tamoxifen response was examined in both cohort I and II.
In cohort I, this analysis was restricted to ER+ postmenopausal women who had received tamoxifen and revealed a significantly shorter OS in the group of patients expressing high levels of CART (P = 0.002; Figure 5c). Subsequently, cohort II was used to examine the relationship between CART expression and tamoxifen response in pre-menopausal patients. Reccurence-free survival (RFS) was used as the endpoint in this analysis as this was the endpoint used for the original trial (Ryden et al., 2005). Analysis of ER+ tumors expressing low levels of CART demonstrated a significant difference in the RFS of the tamoxifen-treated group compared with the control group (Figure 5d). This effect was lost in ER+ tumors with high CART (n = 41; Figure 5e), suggesting that increased CART expression is associated with an impaired tamoxifen response in pre-menopausal patients.
As patients in cohort II only received 2 years adjuvant tamoxifen and current guidelines suggest a minimum of 5 years adjuvant anti-endocrine therapy (Goldhirsch et al., 2005), the relationship between CART expression and tamoxifen response was examined in a third independent cohort. Cohort III (Chanrion et al., 2008) consisted of pre- and post-menopausal patients treated with 5 years adjuvant tamoxifen. To confirm our findings regarding CART-regulated expression of ERα in tamoxifen-treated patients irrespective of menopausal status, supervised hierarchical clustering was performed comparing the 25 lowest expressing CART tumors compared with the 25 highest expressing tumors in cohort III. This demonstrated upregulation of ERα-responsive genes, including TFF1, GATA3, IGFBP2, AR and PGR in a significant proportion of CART high tumors, while in the CART-low tumors, all of the ER-responsive genes were downregulated (Figure 5f). In addition, CART mRNA levels were higher in patients who recurred on tamoxifen compared with those that remained disease free (P = 0.001). Increased levels of CART mRNA were also associated with a reduced RFS (P = 0.001; Figure 5g) and OS (P = 0.002; Figure 5h) in cohort III and mulitvariate Cox regression analysis confirmed CART was an independent predictor of RFS (HR = 2.33, 95% CI 1.17–4.66, P 0.017) and OS (HR = 2.34, 95% CI 1.01–5.59, P = 0.048; Table 3), further confirming that high CART is an independent predictor of outcome in tamoxifen-treated patients.
Table 3.
Cox regression analysis of RFS and OS in cohort III (n = 155)
| RFS | OS | |||
|---|---|---|---|---|
|
| ||||
| HR (95% CI) | P-value | HR (95% CI) | P-value | |
| CART mRNA | Univariate | Univariate | ||
| Low | 1.00 | 1.00 | ||
| High | 2.61 (1.43–4.77) | 0.002 | 2.72 (1.39–5.33) | 0.003 |
| CART mRNA | Age adjusted | Age adjusted | ||
| Low | 1.00 | 1.00 | ||
| High | 2.53 (1.38–4.65) | 0.003 | 2.71 (1.38–5.33) | 0.004 |
| CART mRNA | Multivariate | Multivariate | ||
| Low | 1.00 | 1.00 | ||
| High | 2.33 (1.17–4.66) | 0.017 | 2.34 (1.01–5.59) | 0.048 |
Abbreviations: CART, cocaine- and amphetamine-regulated transcript; CI, confidence interval; HR, hazard ratio; OS, overall survival; RFS, reccurence-free survival.
Multivariate analysis included adjustment for grade, age, nodal status and tumor size.
Discussion
To our knowledge, this is the first description of CART expression in breast cancer. The majority of work carried out to date on this neuropeptide hormone has concentrated on its multiple neurophysiological functions (Rogge et al., 2008). A role for neuropeptides in breast cancer is not without precedence, for example, neuropeptide Y, nerve growth factor, Oxytocin and Vasopressin have all long been associated with disease progression (Taylor et al., 1990; Dolle et al., 2004; Keegan et al., 2006; Ruscica et al., 2007; Adriaenssens et al., 2008).
We initially demonstrated that CART protein expression in primary breast tumors is associated with synchronous expression in lymph node metastases (Figure 1a), indicating a possible role in tumor progression. To our knowledge, this is the first description of tumor-derived CART expression. CART was not expressed in a panel of six breast cancer cell lines grown under normal conditions (Supplementary Figure 1A). Despite applying a number of approaches that have been used to induce hypothalamic CART (Dominguez and Kuhar, 2004; Dominguez, 2006), including treating breast cancer cells with estradiol, corticosteroids and activating CREB using hypoxia and forskolin, we were unable to induce CART expression in vitro (data not shown). However, CART does appear to stimulate an autocrine/paracine loop, resulting in the amplification of CART expression when expressed ectopically in breast cancer cells (Figures 1c and d), suggesting that the regulation of tumour-derived CART expression differs from hypothalamic CART, however this mechanism has yet to be fully elucidated. The demonstration of an autocrine/paracrine loop may account for the observation that within CART-expressing tumors, all of the tumor cells are positive. We are unsure as to why surrounding stroma does not express CART, however, it is plausible that only the tumor cells express the, as yet unidentified, CART receptor(s) and therefore can transduce the CART signal. The nerve growth factor autocrine loop in breast cancer functions in exactly this manner, where tumor cells express the TrkA receptor whereas normal breast tissue does not and, consequently, nerve growth factor expression is confined to tumor cells (Dolle et al., 2004).
Personalized medicine requires the identification of unambiguous prognostic and predictive biomarkers to inform therapeutic decisions (Brennan et al., 2010). Within this context, the management of node-negative breast cancer is the subject of much debate and two large ongoing clinical trials (TailorX and MINDACT), with particular emphasis on the requirement for adjuvant chemotherapy (Cardoso et al., 2008; Zujewski and Kamin, 2008). The identification of prognostic and predictive biomarkers in this cohort is crucial to avoid aggressive systemic adjuvant chemotherapy which may not be necessary. Here, we demonstrate that CART is an independent poor prognostic factor in lymph node-negative tumors. These findings suggest that CART profiling could facilitate stratification of lymph node-negative breast cancer patients into high- and low-risk categories and allow for the personalization of therapy.
Our observations that CART induces the transcriptional activity of ERα through phosphorylation of S118 via the MAPK pathway and predicts outcome in tamoxifen-treated patients suggests that CART may have a role in modulating the cellular response to tamoxifen. It is well-recognized that ligand-independent activation ER via the MAPK pathway leads to phosphorylation of ERα at S118 (Kato et al., 1995), and recent studies have demonstrated that increased levels of phosphorylated S118 are associated with tamoxifen resistance (Yamashita et al., 2008; Zoubir et al., 2008). Tamoxifen acts as an estrogen antagonist via competitive binding to the AF-2 domain of ERα and the recruitment of co-repressors rather than co-activators (Shang and Brown, 2002). A wealth of evidence supports the role of tamoxifen in the treatment of breast cancer (EBCTG, 2005); however, resistance to tamoxifen is a significant clinical problem and the Oxford meta-analysis reported a relapse rate of 15%, and an 8% incidence of breast cancer-specific mortality within 5 years of the commencement of therapy (EBCTG, 2005).
The introduction of aromatase inhibitors may lead to an improvement in post-menopausal women; however, recent results of the ATAC (Arimidex, Tamoxifen, Alone or in Combination) and the BIG I-98 (comparing letrozole and tamoxifen) both report recurrence rates of ~ 10% in the aromatase inhibitor treatment arms (Howell et al., 2005; Thurlimann et al., 2005), suggesting that resistance to aromatase inhibitors will also become a problem over time. In pre-menopausal women, tamoxifen resistance may be more prevalent; however, it is quite hard to quantify accurately as the majority of pre-menopausal patients receive adjuvant cytotoxic chemotherapy. Ryden et al. reported a recurrence rate of 39.7% at 10 years in the absence of adjuvant chemotherapy (Ryden et al., 2005). An ability to identify patients who will not respond to endocrine therapy before commencing treatment would be extremely beneficial. Our findings demonstrate that CART predicts outcome in tamoxifen-treated patients in three independent breast cancer cohorts and, thus, may potentially identify a group of patients who require more aggressive adjuvant treatment.
In particular, CART appears to predict outcome in older patients and may have a role in post-menopausal endocrine resistance. Increased levels of CART were associated with an older age at diagnosis in cohort I, and the mean age in cohort II was 68. Furthermore, given that CART mediates ligand-independent activation of ERα in a hormone-depleted cell culture system (Figures 2a and b), one may postulate that aromatase inhibitors would do little to prevent the activity of CART in post-menopausal breast cancer. We did not have access to a relevant patient cohort to investigate this hypothesis in the current study.
Taken together, our findings demonstrate CART to be an independent prognostic marker in lymph node-negative breast cancer patients. We have also demonstrated that CART has an important role in ligand-independent activation of ERα and poor response to tamoxifen. CART appears to be a more significant predicitive marker in post-menopausal patients, and mirrors what has been previously observed with leptin (Mantzoros et al., 1999), indeed CART has previously been demonstrated to act downstream of leptin in regulating bone resporption (Elefteriou et al., 2005). Taken together, these findings suggest that CART may be a useful marker in identifying patients at risk of developing resistance to tamoxifen and should thus be offered additional cytotoxic therapy.
Materials and methods
Patients
Three independent breast cancer patient cohorts were used in this study. The clinicopathological characteristics of all cohorts are outlined in Supplementary Table 1. Cohort I consisted of 512 consecutive breast cancer cases diagnosed at the Department of Pathology, Malmö University Hospital, Malmö, Sweden, between 1988 and 1992 and has been described previously (Borgquist et al., 2008). The median age was 65 years (range 27–96) and median follow-up time to first breast cancer event was 128 months (0–207). Complete treatment data were available for 379 (76%) patients, 160 of whom had received adjuvant tamoxifen. A total of 23 patients received adjuvant chemotherapy. In all, 200 patients received no adjuvant systemic treatment. Ethical permission for this study was obtained from the Local Ethics Committee at the Lund University (Dnr 613/02).
Cohort II consisted of 564 pre-menopausal women with primary breast cancer from the South and Southeast regions of Sweden who enrolled in a multi-centre clinical trial between 1984 and 1991 (Ryden et al., 2005). Patients were randomly assigned to either 2 years of adjuvant tamoxifen (n = 276) or a control group (n = 288). The aim of this clinical trial was to examine the effect of tamoxifen on RFS and the study has been described in detail elsewhere, including as part of the Oxford meta-analysis (EBCTCG, 1998, 2005). RFS considered local, regional, distant recurrences and breast cancer-specific death, but not contralateral breast cancer. The inclusion criteria were pre-menopausal patients, or patients <50 years, with stage II (pT2 N0 M0, pT1–2 N1 M0) invasive breast cancer treated by modified mastectomy or breast-conserving surgery with axillary lymph node dissection. Post-operative radiotherapy (50 Gy) was administered after breast-conserving surgery and all lymph node-positive patients received locoregional radiotherapy. Less than 2% of the patients received adjuvant systemic chemotherapy. The median follow-up time for patients without breast cancer events was 13.9 years. TMAs were constructed from 500 patients as described previously (Brennan et al., 2006). The study was approved by the Ethical Committees at Lund and Linköping Universities.
Cohort III consisted of a gene expression data set published by Chanrion et al. containing 155 primary breast tumors obtained from patients who had undergone initial surgery between 1989 and 2001 at the Cancer Research Center of Val d’Aurelle in Montpellier, the Bergonie Institute in Bordeaux, or the Department of Obstetrics and Gynecology of Turin (Chanrion et al., 2008). The median follow-up time for all patients was 5.5 years. The aim of the study was to identify a gene expression signature associated with poor prognosis in tamoxifen-treated patients. All but eight tumors were ER+, and six of the eight ER− tumors were PR+. No patient received neoadjuvant systemic chemotherapy. All patients were treated with adjuvant tamoxifen (20 mg daily) for 5 years. A total of 121 patients also received adjuvant radiotherapy. Recurrence was observed in 52 patients (48 distant metastases and four local recurrences) with median relapse time of 3.09 months. Raw gene expression data and clinical data were downloaded (http://www.ncbi.nlm.nih.gov/geo/; accession number GSE 9893). The log ratio of gene expression values was used without further transformation. Tumor samples were classified as high or low CART expressers based on median array hybridization levels. Supervised hierarchical clustering was performed using Cluster (version 3.0) (http://bonsai.hgc.jp/Bmdehoon/software/cluster/software.htm) and heatmaps were produced using Tree View (Version 1.3.3) (http://jtreeview.sourceforge.net/index.html).
Cell lines and transfections
All cell lines (MDA-MB-231, MCF-7, SKBR3, Hs578T, BT474 and T47D) were obtained from the European Collection of Cell Cultures (Salisbury, Wiltshire, UK) and were maintained as described previously (Brennan et al., 2006). Stable doxycyclin-inducible MCF-7-CART cell lines were generated by cloning full-length human CART from pCMV6-XL5 into pLenti6 (Invitrogen, Carlsbad, CA, USA), generation of lentiviral particles according to the manufacturer’s instructions, infection of target MCF-7 cells and selection against Blasticidin.
Plasmids
Full-length human CART cDNA was purchased in a pre-cloned, expression ready plasmid vector pCMV6-XL5 (CMV-CART; Origene Technologies, Rockville, MD, USA). VP16-ERa was obtained from Addgene Inc. (Cambridge, MA, USA; Chang et al., 1999). VP16-ERalpha-S118A was generated using the Quikchange site-directed mutagenesis kit (Stratagene, La Jolla, CA, USA) according to the manufacturer’s instructions with the following primer–5′-GCAGGAAAGGCGCCAGCTGCGG-3′. The ERE-TATA-Luciferase reporter construct and CMV-Renilla Luciferase construct have been described previously (Zwijsen et al., 1998; Epping et al., 2007).
Dual-luciferase reporter assays
Cells were transiently transfected with an ERE-Luc reporter construct together with a CMV-Renilla luciferase construct (internal control) using Genejuice reagent (Merck, Darmstadt, Germany) according to the manufacturer’s recommendations. ER-negative MDA-MB-231 cells were additionally transfected with wild-type ER or the S118A mutant. The following day, cells were transferred to hormone-stripped/phenol red-free media for 48 h and then stimulated overnight with 17β-estradiol or recombinant CART peptide (42–89; Phoenix Pharmaceuticals Inc., Burlingame, CA, USA). Relative expression of the ERE-Luc reporter normalized to Renilla Luciferase levels was measured using the Dual Luciferase Reporter Assay kit (Promega, Madison, WI, USA) and a Glomax microplate luminometer with dual injector system (Promega). All reporter assays shown represent three independent experiments.
Western blot analysis and antibodies
Western blot analysis was performed as described previously (Brennan et al., 2006). Primary antibodies used included rabbit anti-CART 42–89 (1:5000), (Koylu et al., 1997), anti-phospho-extracellular signal-regulated kinase 1/2 (Thr 202/Tyr 204, Santa Cruz Biotech, Santa Cruz, CA, USA 1:1000), anti-extracellular signal-regulated kinase 1 (Clone C-16, 1:1000, Santa Cruz), anti-ERα (Clone 6F-11, 1:250, Novocastra, Newcastle Upon Tyne, UK), anti-PR (Clone 636, 1:250 Dako, Glostrup, Denmark), anti-phospho-ERα (Ser118; 1:1000, Cell Signaling, Danvers, MA, USA). An anti-β-actin antibody (Clone 8226, Abcam, Cambridge, UK) at a dilution of 1:5000 was used as a loading control.
Quantitative SYBR Green real-time–PCR
Total RNA was isolated from cell lines using Trizol (Invitrogen) and reverse transcribed using SuperScript II Reverse Transcriptase (Invitrogen) according to the manufacturer’s instructions. CART-F (5′-TGGCCAAGTCCCCATGTG-3′) and CART-R (5′-CGATCCTTGCCCCTTTCC-3′) primers were designed using Primer Express software (Applied Biosystems Version 2.0) and used to amplify a CART-specific DNA fragment with SYBR Green PCR Master Mix (Applied Biosystems) using a 7900HT Fast Real-Time–PCR System (Applied Biosystems, Carlsbad, CA, USA). Relative CART expression levels in untreated MCF-7 cells versus MCF-7 cells treated with CART-conditioned medium were calculated using the qBase real-time–PCR relative quantification software (Dolle et al., 2004), with all samples normalized to 18s rRNA. Negative controls included a no template control and a no reverse transcriptase control. All quantitative real-time–PCR reactions were performed in triplicate.
Flow cytometry
Cells were trypsinized and spun down at 1000 × g for 5 min at 4°C. The media was then removed and the cells were resuspended in 1 ml of ice-cold phosphate-buffered saline. Cells were then fixed in 70% (v/v) ethanol and incubated for 30 min on ice. The ethanol was removed and the cells washed again with ice-cold phosphate-buffered saline. Following resuspension in 1 ml of ice-cold phosphate-buffered saline, 40 μl propidium iodide (1 mg/ml) was added to the cells for DNA analysis. Flow cytometry was carried out on a Beckman Coulter Epics XL-MCL (Beckman Coulter, Fullerton, CA, USA). A minimum of 10 000 events was acquired for each experiment. Doublets and debris were excluded from further analysis using manual gating and System II software (Beckman Coulter) was used to calculate the proportion of cells in sub-G1 phase.
TMAs and immunohistochemistry
Breast cancer TMAs were constructed as described previously (Ryden et al., 2003) and the blocks were stored in the Department of Pathology in Malmö University Hospital, Sweden. TMA sections were cut immediately before staining. Sections (4 μm) were dried, de-paraffinized and rehydrated through descending concentrations of ethanol. Heat-mediated antigen retrieval was performed in a citrate buffer (pH 6.0) before being processed in the Ventana Benchmark system (Ventana Medical Systems Inc., Tucson, AZ, USA) using prediluted antibodies to ER (clone 6F11, Novocastra), PR (clone 16, Ventana) and Her2 (clone CB11, Ventana), the Dako Techmate 500 system (Dako) for anti-Ki-67 antibodies (1:200, M7240; Dako) or the Labvision Autostainer 360 (Lab Vision Products, Kalamazoo, MI, USA) for anti-CART antibodies (42–89; 1:5000). 3,3′-diaminobenzidine was used as a chromogenic substrate for all immunohistochemistry experiments. For negative controls, primary antibody was replaced with an immunoglobulin G isotype control.
ER, PR and Ki-67 were scored as positive if the fraction of positive tumor cells was >10%. Her2 staining was evaluated according to a standard protocol and scored as 4 intensities, namely 0–3; these scorings were divided into two groups with normal/weak (0–2) Her2 expression and overexpression (3+).
Image acquisition, management and analysis
The Aperio ScanScope XT Slide Scanner system (Aperio Technologies, Vista, CA, USA) was used to capture whole slide digital images with a × 20 objective. A positive pixel count algorithm (Aperio) was used to develop a quantitative scoring model for cytoplasmic CART expression, as described previously (Brennan et al., 2008).
Statistical analysis
Differences in distribution of clinical data and tumor characteristics between samples with high and low levels of CART expression were evaluated using the χ2 test. Kaplan-Meier analysis and the log-rank test were used to illustrate differences between OS and RFS according to CART protein and mRNA expression. Cox regression proportional hazards models were used to estimate the relationship between RFS and CART protein expression, NHG, age, nodal status, ER status, PR status, Her2, Ki-67 and tumor size. Cox regression proportional hazards models were also used to estimate the relationship between OS and RFS and CART mRNA expression, NHG, age, nodal status and tumor size. The proportional hazards assumption was met for each of the comparisons made. All calculations were performed using SPSS version 11.0 (SPSS Inc., Chicago, IL, USA). P-value <0.05 was considered statistically significant.
Supplementary Material
Supplementary Figure 1. A) Western blot analysis of breast cancer cell lines and rat hypothalamus, demonstrating the lack of CART expression in breast cancer cell lines grown under normal growth conditions. B) Immunohistochemical analysis of MCF-7-CART cells with and without induction of CART by doxycycline, demonstrating CART expression in doxycycline-induced MCF7-CART cells but not in uninduced cells. An IgG isotype control for the MFC7-CART doxycycline-induced cells is also shown. C) Western blot analysis of CART expression in CART-transfected and non-CART transfected MCF-7 cells demonstrating antibody specificity.
Supplementary Figure 2. Diagram depicting the ligand independent activation of ERα by CART through the mitogen activated protein kinase pathway.
Acknowledgments
The UCD Conway Institute is funded by the Program for Third Level Institutions, as administered by the Higher Education Authority of Ireland. Funding is acknowledged from the Health Research Board of Ireland, Enterprise Ireland and the Science Foundation Ireland Strategic Research Cluster award to Molecular Therapeutics for Cancer Ireland (08/SRC/B1410). The work of Dr R Zagozdzon has been supported by a Marie Curie International Reintegration Grant no. 224865 within the 7th European Community Framework Program. Dr MJ Kuhar is funded by RR00165.
Footnotes
Supplementary Information accompanies the paper on the Oncogene website (http://www.nature.com/onc)
Conflict of interest
Drs Rexhepaj, Brennan and Gallagher are the inventors of a pending patent application in relation to the development of novel automated image analysis approaches in histopathology.
References
- Adriaenssens E, Vanhecke E, Saule P, Mougel A, Page A, Romon R, et al. Nerve growth factor is a potential therapeutic target in breast cancer. Cancer Res. 2008;68:346–351. doi: 10.1158/0008-5472.CAN-07-1183. [DOI] [PubMed] [Google Scholar]
- Arora S, Anubhuti Role of neuropeptides in appetite regulation and obesity–a review. Neuropeptides. 2006;40:375–401. doi: 10.1016/j.npep.2006.07.001. [DOI] [PubMed] [Google Scholar]
- Bech P, Winstanley V, Murphy KG, Sam AH, Meeran K, Ghatei MA, et al. Elevated cocaine- and amphetamine-regulated transcript immunoreactivity in the circulation of patients with neuroendocrine malignancy. J Clin Endocrinol Metab. 2008;93:1246–1253. doi: 10.1210/jc.2007-1946. [DOI] [PMC free article] [PubMed] [Google Scholar]
- Borgquist S, Jogi A, Ponten F, Ryden L, Brennan DJ, Jirstrom K. Prognostic impact of tumour-specific HMG-CoA reductase expression in primary breast cancer. Breast Cancer Res. 2008;10:R79. doi: 10.1186/bcr2146. [DOI] [PMC free article] [PubMed] [Google Scholar]
- Brennan D, Jirstrom K, Kronblad A, Millikan R, Landberg G, Duffy M, et al. CA IX is an independent prognostic marker in premenopausal breast cancer patients with one to three positive lymph nodes and a putative marker of radiation resistance. Clin Cancer Res. 2006;12:6421–6431. doi: 10.1158/1078-0432.CCR-06-0480. [DOI] [PubMed] [Google Scholar]
- Brennan DJ, O’Connor DP, Rexhepaj E, Ponten F, Gallagher WM. Antibody-based proteomics: fast-tracking molecular diagnostics in oncology. Nat Rev Cancer. 2010;10:605–617. doi: 10.1038/nrc2902. [DOI] [PubMed] [Google Scholar]
- Brennan DJ, Rexhepaj E, O’ Brien SL, Mc Sherry E, O’Connor DP, Fagan A, et al. Altered cytoplasmic-nuclear ratio of survivin is a prognostic indicator in breast cancer. Clin Cancer Res. 2008;14:2681–2689. doi: 10.1158/1078-0432.CCR-07-1760. [DOI] [PMC free article] [PubMed] [Google Scholar]
- Cardoso F, Van’t Veer L, Rutgers E, Loi S, Mook S, Piccart-Gebhart MJ. Clinical application of the 70-gene profile: the MINDACT trial. J Clin Oncol. 2008;26:729–735. doi: 10.1200/JCO.2007.14.3222. [DOI] [PubMed] [Google Scholar]
- Chang C, Norris JD, Gron H, Paige LA, Hamilton PT, Kenan DJ, et al. Dissection of the LXXLL nuclear receptor-coactivator interaction motif using combinatorial peptide libraries: discovery of peptide antagonists of estrogen receptors alpha and beta. Mol Cell Biol. 1999;19:8226–8239. doi: 10.1128/mcb.19.12.8226. [DOI] [PMC free article] [PubMed] [Google Scholar]
- Chanrion M, Negre V, Fontaine H, Salvetat N, Bibeau F, Mac Grogan G, et al. A gene expression signature that can predict the recurrence of tamoxifen-treated primary breast cancer. Clin Cancer Res. 2008;14:1744–1752. doi: 10.1158/1078-0432.CCR-07-1833. [DOI] [PMC free article] [PubMed] [Google Scholar]
- Cheng J, Zhang C, Shapiro DJ. A functional serine 118 phosphorylation site in estrogen receptor-alpha is required for down-regulation of gene expression by 17beta-estradiol and 4-hydroxytamoxifen. Endocrinology. 2007;148:4634–4641. doi: 10.1210/en.2007-0148. [DOI] [PubMed] [Google Scholar]
- Dolle L, Adriaenssens E, El Yazidi-Belkoura I, Le Bourhis X, Nurcombe V, Hondermarck H. Nerve growth factor receptors and signaling in breast cancer. Curr Cancer Drug Targets. 2004;4:463–470. doi: 10.2174/1568009043332853. [DOI] [PubMed] [Google Scholar]
- Dominguez G. The CART gene: structure and regulation. Peptides. 2006;27:1913–1918. doi: 10.1016/j.peptides.2006.01.025. [DOI] [PubMed] [Google Scholar]
- Dominguez G, Kuhar M. Transcriptional regulation of the CART promoter in CATH a cells. Brain Res Mol Brain Res. 2004;126:22–29. doi: 10.1016/j.molbrainres.2004.02.027. [DOI] [PubMed] [Google Scholar]
- Douglass J, McKinzie AA, Couceyro P. PCR differential display identifies a rat brain mRNA that is transcriptionally regulated by cocaine and amphetamine. J Neurosci. 1995;15:2471–2481. doi: 10.1523/JNEUROSCI.15-03-02471.1995. [DOI] [PMC free article] [PubMed] [Google Scholar]
- EBCTCG. Tamoxifen for early breast cancer: an overview of the randomised trials. Early Breast Cancer Trialists’ Collaborative Group. Lancet. 1998;351:1451–1467. [PubMed] [Google Scholar]
- EBCTCG. Effects of chemotherapy and hormonal therapy for early breast cancer on recurrence and 15-year survival: an overview of the randomised trials. Lancet. 2005;365:1687–1717. doi: 10.1016/S0140-6736(05)66544-0. [DOI] [PubMed] [Google Scholar]
- Elefteriou F, Ahn J, Takeda S, Starbuck M, Yang X, Liu X, et al. Leptin regulation of bone resorption by the sympathetic nervous system and CART. Nature. 2005;434:514–520. doi: 10.1038/nature03398. [DOI] [PubMed] [Google Scholar]
- Epping MT, Wang L, Plumb JA, Lieb M, Gronemeyer H, Brown R, et al. A functional genetic screen identifies retinoic acid signaling as a target of histone deacetylase inhibitors. Proc Natl Acad Sci USA. 2007;104:17777–17782. doi: 10.1073/pnas.0702518104. [DOI] [PMC free article] [PubMed] [Google Scholar]
- Goldhirsch A, Glick J, Gelber R, Coates A, Thürlimann B, Senn H, et al. Meeting highlights: international expert consensus on the primary therapy of early breast cancer 2005. Ann Oncol. 2005;16:1569–1583. doi: 10.1093/annonc/mdi326. [DOI] [PubMed] [Google Scholar]
- Howell A, Cuzick J, Baum M, Buzdar A, Dowsett M, Forbes JF, et al. Results of the ATAC (Arimidex, Tamoxifen, Alone or in Combination) trial after completion of 5 years’ adjuvant treatment for breast cancer. Lancet. 2005;365:60–62. doi: 10.1016/S0140-6736(04)17666-6. [DOI] [PubMed] [Google Scholar]
- Jia J, Chen X, Zhu W, Luo Y, Hua Z, Xu Y. CART protects brain from damage through ERK activation in ischemic stroke. Neuropeptides. 2008;42:653–661. doi: 10.1016/j.npep.2008.05.006. [DOI] [PubMed] [Google Scholar]
- Kato S, Endoh H, Masuhiro Y, Kitamoto T, Uchiyama S, Sasaki H, et al. Activation of the estrogen receptor through phosphorylation by mitogen-activated protein kinase. Science. 1995;270:1491–1494. doi: 10.1126/science.270.5241.1491. [DOI] [PubMed] [Google Scholar]
- Keegan BP, Akerman BL, Pequeux C, North WG. Provasopressin expression by breast cancer cells: implications for growth and novel treatment strategies. Breast Cancer Res Treat. 2006;95:265–277. doi: 10.1007/s10549-005-9024-8. [DOI] [PubMed] [Google Scholar]
- Koylu E, Balkan B, Kuhar M, Pogun S. Cocaine and amphetamine regulated transcript (CART) and the stress response. Peptides. 2006;27:1956–1969. doi: 10.1016/j.peptides.2006.03.032. [DOI] [PubMed] [Google Scholar]
- Koylu EO, Couceyro PR, Lambert PD, Ling NC, DeSouza EB, Kuhar MJ. Immunohistochemical localization of novel CART peptides in rat hypothalamus, pituitary and adrenal gland. J Neuroendocrinol. 1997;9:823–833. doi: 10.1046/j.1365-2826.1997.00651.x. [DOI] [PubMed] [Google Scholar]
- Kristensen P, Judge M, Thim L, Ribel U, Christjansen K, Wulff B, et al. Hypothalamic CART is a new anorectic peptide regulated by leptin. Nature. 1998;393:72–76. doi: 10.1038/29993. [DOI] [PubMed] [Google Scholar]
- Lakatos A, Prinster S, Vicentic A, Hall R, Kuhar M. Cocaine- and amphetamine-regulated transcript (CART) peptide activates the extracellular signal-regulated kinase (ERK) pathway in AtT20 cells via putative G-protein coupled receptors. Neurosci Lett. 2005;384:198–202. doi: 10.1016/j.neulet.2005.04.072. [DOI] [PubMed] [Google Scholar]
- Mantzoros C, Bolhke K, Moschos S, Cramer D. Leptin in relation to carcinoma in situ of the breast: a study of pre-menopausal cases and controls. Int J Cancer. 1999;80:523–526. doi: 10.1002/(sici)1097-0215(19990209)80:4<523::aid-ijc7>3.0.co;2-c. [DOI] [PubMed] [Google Scholar]
- O’Brien SL, Fagan A, Fox EJ, Millikan RC, Culhane AC, Brennan DJ, et al. CENP-F expression is associated with poor prognosis and chromosomal instability in patients with primary breast cancer. Int J Cancer. 2007;120:1434–1443. doi: 10.1002/ijc.22413. [DOI] [PMC free article] [PubMed] [Google Scholar]
- Rogge G, Jones D, Hubert GW, Lin Y, Kuhar MJ. CART peptides: regulators of body weight, reward and other functions. Nat Rev Neurosci. 2008;9:747–758. doi: 10.1038/nrn2493. [DOI] [PMC free article] [PubMed] [Google Scholar]
- Ruscica M, Dozio E, Motta M, Magni P. Role of neuropeptide Y and its receptors in the progression of endocrine-related cancer. Peptides. 2007;28:426–434. doi: 10.1016/j.peptides.2006.08.045. [DOI] [PubMed] [Google Scholar]
- Ryden L, Jonsson P, Chebil G, Dufmats M, Ferno M, Jirstrom K, et al. Two years of adjuvant tamoxifen in premenopausal patients with breast cancer: a randomised, controlled trial with long-term follow-up. Eur J Cancer. 2005;41:256–264. doi: 10.1016/j.ejca.2004.06.030. [DOI] [PubMed] [Google Scholar]
- Ryden L, Linderholm B, Nielsen NH, Emdin S, Jonsson PE, Landberg G. Tumor specific VEGF-A and VEGFR2/KDR protein are co-expressed in breast cancer. Breast Cancer Res Treat. 2003;82:147–154. doi: 10.1023/B:BREA.0000004357.92232.cb. [DOI] [PubMed] [Google Scholar]
- Sen A, Lv L, Bello N, Ireland JJ, Smith GW. Cocaine- and amphetamine-regulated transcript accelerates termination of follicle-stimulating hormone-induced extracellularly regulated kinase 1/2 and Akt activation by regulating the expression and degradation of specific mitogen-activated protein kinase phosphatases in bovine granulosa cells. Mol Endocrinol. 2008;22:2655–2676. doi: 10.1210/me.2008-0077. [DOI] [PMC free article] [PubMed] [Google Scholar]
- Shang Y, Brown M. Molecular determinants for the tissue specificity of SERMs. Science. 2002;295:2465–2468. doi: 10.1126/science.1068537. [DOI] [PubMed] [Google Scholar]
- Taylor AH, Ang VT, Jenkins JS, Silverlight JJ, Coombes RC, Luqmani YA. Interaction of vasopressin and oxytocin with human breast carcinoma cells. Cancer Res. 1990;50:7882–7886. [PubMed] [Google Scholar]
- Thurlimann B, Keshaviah A, Coates AS, Mouridsen H, Mauriac L, Forbes JF, et al. A comparison of letrozole and tamoxifen in postmenopausal women with early breast cancer. N Engl J Med. 2005;353:2747–2757. doi: 10.1056/NEJMoa052258. [DOI] [PubMed] [Google Scholar]
- Van’t Veer LJ, Dai H, van de Vijver MJ, He YD, Hart AA, Mao M, et al. Gene expression profiling predicts clinical outcome of breast cancer. Nature. 2002;415:530–536. doi: 10.1038/415530a. [DOI] [PubMed] [Google Scholar]
- Yamashita H, Nishio M, Toyama T, Sugiura H, Kondo N, Kobayashi S, et al. Low phosphorylation of estrogen receptor alpha (ERalpha) serine 118 and high phosphorylation of ERalpha serine 167 improve survival in ER-positive breast cancer. Endocr Relat Cancer. 2008;15:755–763. doi: 10.1677/ERC-08-0078. [DOI] [PubMed] [Google Scholar]
- Zoubir M, Mathieu MC, Mazouni C, Liedtke C, Corley L, Geha S, et al. Modulation of ER phosphorylation on serine 118 by endocrine therapy: a new surrogate marker for efficacy. Ann Oncol. 2008;19:1402–1406. doi: 10.1093/annonc/mdn151. [DOI] [PubMed] [Google Scholar]
- Zujewski JA, Kamin L. Trial assessing individualized options for treatment for breast cancer: the TAILORx trial. Future Oncol. 2008;4:603–610. doi: 10.2217/14796694.4.5.603. [DOI] [PubMed] [Google Scholar]
- Zwijsen RM, Buckle RS, Hijmans EM, Loomans CJ, Bernards R. Ligand-independent recruitment of steroid receptor coactivators to estrogen receptor by cyclin D1. Genes Dev. 1998;12:3488–3498. doi: 10.1101/gad.12.22.3488. [DOI] [PMC free article] [PubMed] [Google Scholar]
Associated Data
This section collects any data citations, data availability statements, or supplementary materials included in this article.
Supplementary Materials
Supplementary Figure 1. A) Western blot analysis of breast cancer cell lines and rat hypothalamus, demonstrating the lack of CART expression in breast cancer cell lines grown under normal growth conditions. B) Immunohistochemical analysis of MCF-7-CART cells with and without induction of CART by doxycycline, demonstrating CART expression in doxycycline-induced MCF7-CART cells but not in uninduced cells. An IgG isotype control for the MFC7-CART doxycycline-induced cells is also shown. C) Western blot analysis of CART expression in CART-transfected and non-CART transfected MCF-7 cells demonstrating antibody specificity.
Supplementary Figure 2. Diagram depicting the ligand independent activation of ERα by CART through the mitogen activated protein kinase pathway.