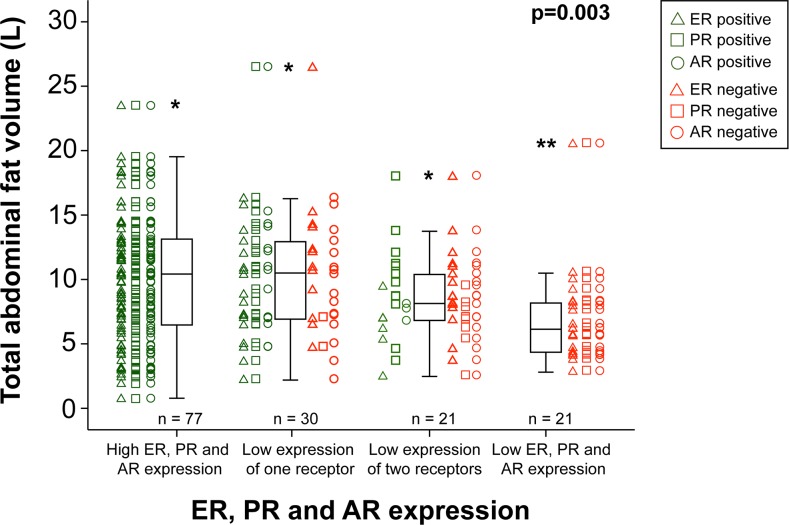
Figure 2. Total abdominal fat volume in relation to hormone receptor status.
Whisker plots displaying the distribution of total abdominal fat volumes (L) for 149 endometrial cancer patients. From left to right: tumors with high immunohistochemical expression of the estrogen receptor (ER), progesterone receptor (PR) and androgen receptor (AR) (n=77), low expression of one of the receptors (n=30), low expression of two of the receptors (n=21) and low expression of all three receptors (n=21). For each case, positive/negative status for ER, PR or AR is indicated by green/red triangles, squares and circles, respectively. * outlier > 1.5 interquartile range, ** outlier > 3 interquartile range. P-value: Jonckheere-Terpstra trend test.

