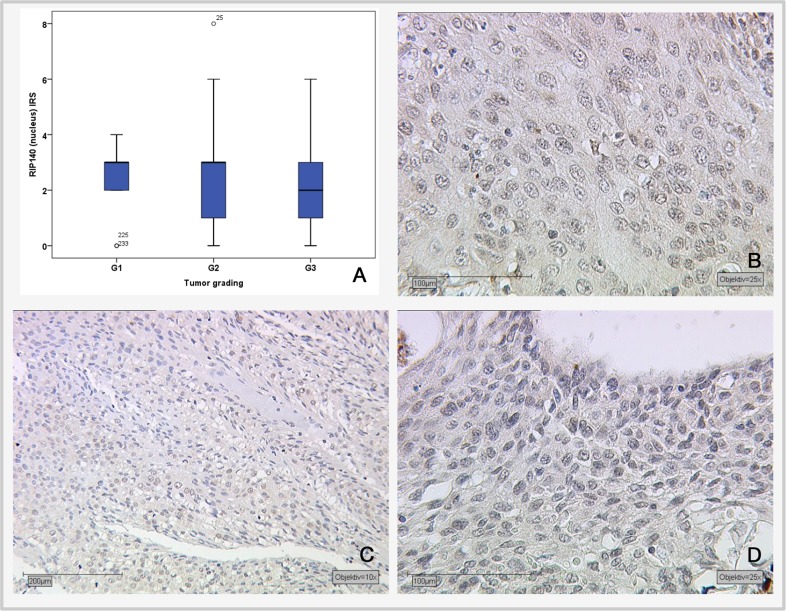
Figure 2. Correlation of nuclear RIP140 expression (IRS) and tumor grading.
(A) Boxplot of RIP140 expression and tumor grading. (B) G1-stage tumors (n=19) with median RIP140 IRS score of 3; magnification x25. (C) G2-stage tumors (n=137) with median RIP140 expression of 3; magnification x10. (D) G3-stage tumors (n=75) with median RIP140 expression of 2; magnification x25.

