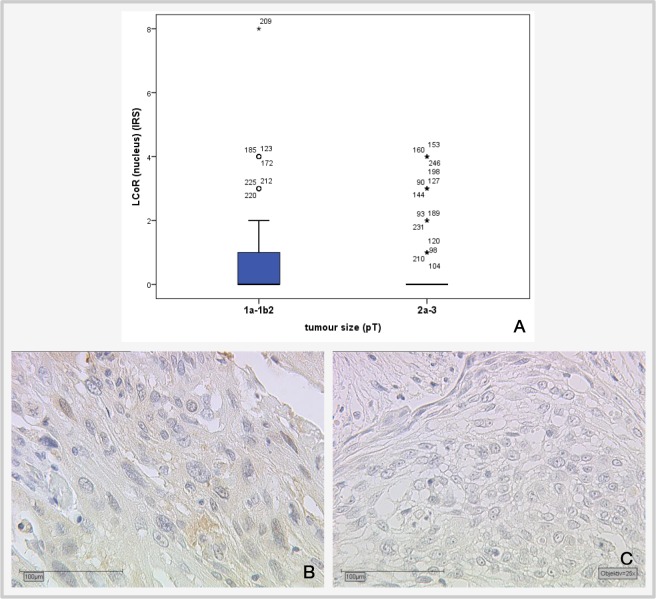
Figure 4. Correlation of cervical tumor size with LCoR IRS staining.
(A) Boxplot of LCoR expression and tumor size showing a significant negative correlation (p=0.039; Spearman's rho: −0.131); (B) median LCoR IRS in pT1a-b2 tumors = 1., magnification x25 (C) Median LCoR IRS in pT2a-3 cervical tumors = 0; magnification x25.

