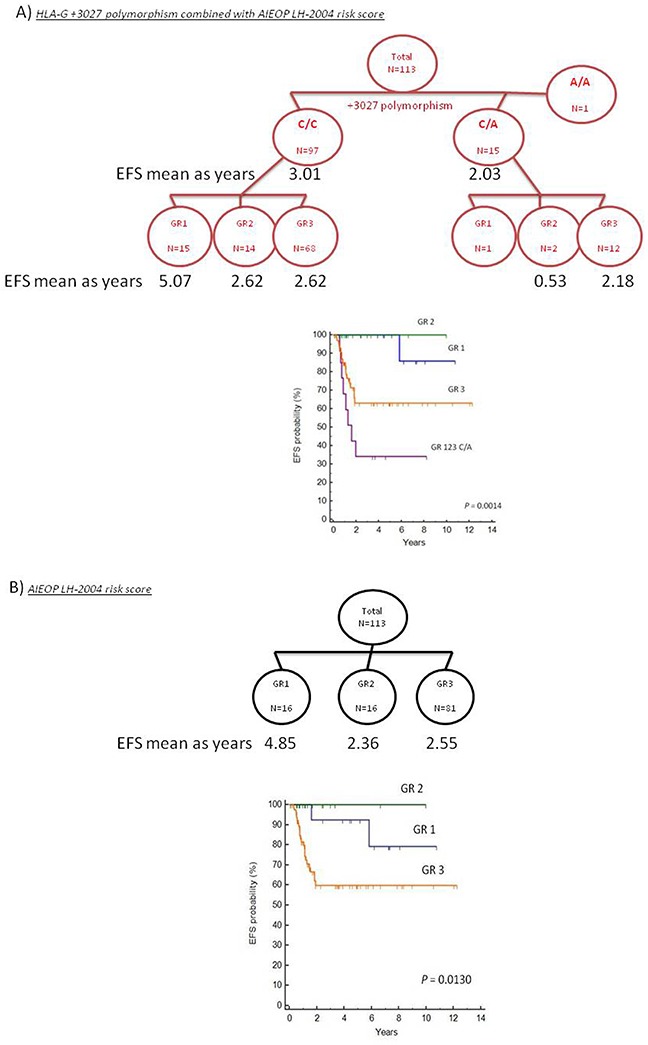
Figure 3. Kaplan Meier survival analysis comparing algorithms based on the HLA-G genotype and AIEOP LH-2004 risk score classification.

(A) Kaplan Meiersurvival curves based on HLA-G +3027 algorithm is shown. Patients were divided into 2 groups based on their HLA-G +3027 genotype (C/C and C/A) and further divided into 3 groups based the AIEOP LH-2004 therapeutic risk score (GR). Since the GR1 and GR2 groups with the +3027 C/A variant included less than 2 patients, GR1, GR2 and GR3 groups with the +3027 C/A variant were merged to form a unique GR123-C/A group. (B) Kaplan Meier survival curves based on the AIEOP LH-2004 risk score for therapeutic response (GR) in pediatric HL patients. Note: Criteria for the AIEOP LH2004 therapeutic group (GR) classification are in the methods section.
