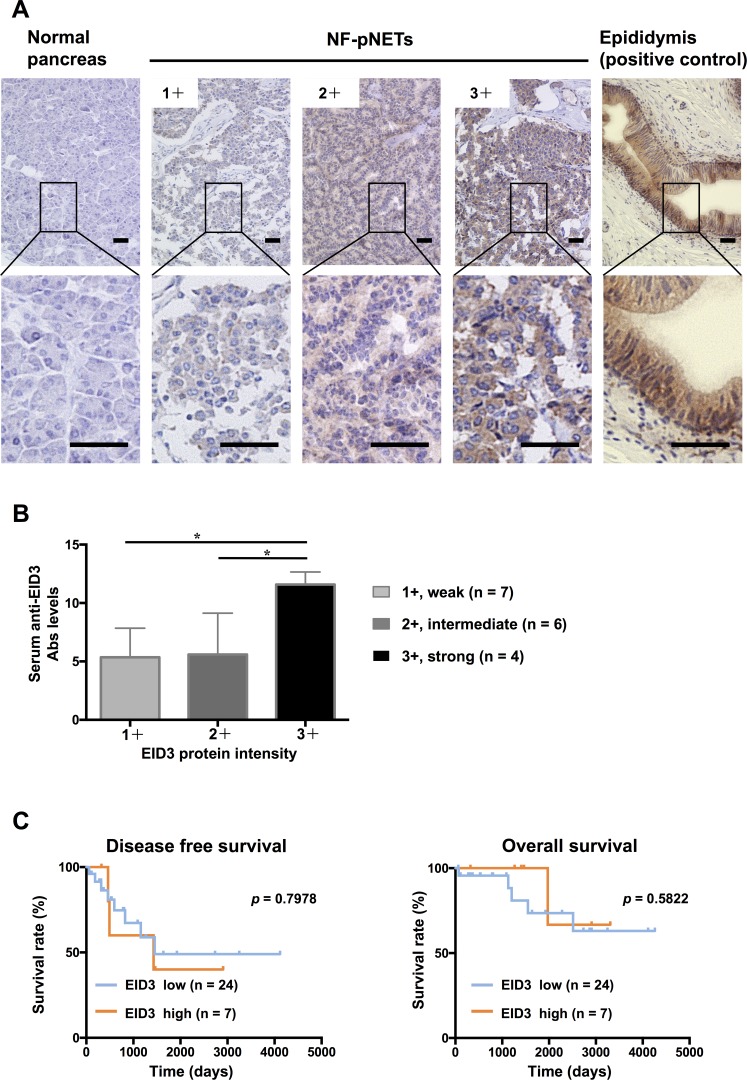
Figure 7. Analysis of EID3 protein expression in NF-pNETs and analysis of correlation between expression and prognosis.
(A) Endogenous EID3 protein expression was detected by immunohistochemical staining in normal pancreatic and NF-pNET tissues. Normal epididymis was stained as the positive control. Strong cytoplasmic expression of the EID3 protein was found in the NF-pNET compared to normal pancreas tissues. Depending on the case, weak (1+), intermediate (2+), or strong (3+) expression was observed compared to the epididymis. (B) Correlation between EID3 protein expression and serum anti-EID3 Ab levels. Serum anti-EID3 Ab levels were significantly higher in the strong (3+) EID3 protein expression group (*p < 0.05). (C) The Kaplan-Meier plots show the relationship between EID3 protein expression and prognosis. The patient group was divided into two groups based on the intensity of EID3 protein expression: low EID3 expression group (1+, 2+) and high EID3 expression group (3+). There was no significant correlation between protein expression and DFS and OS. Scale bar, 50 μm. DFS: disease free survival, OS: overall survival, NF-pNETs: non-functional pancreas neuroendocrine tumors.

