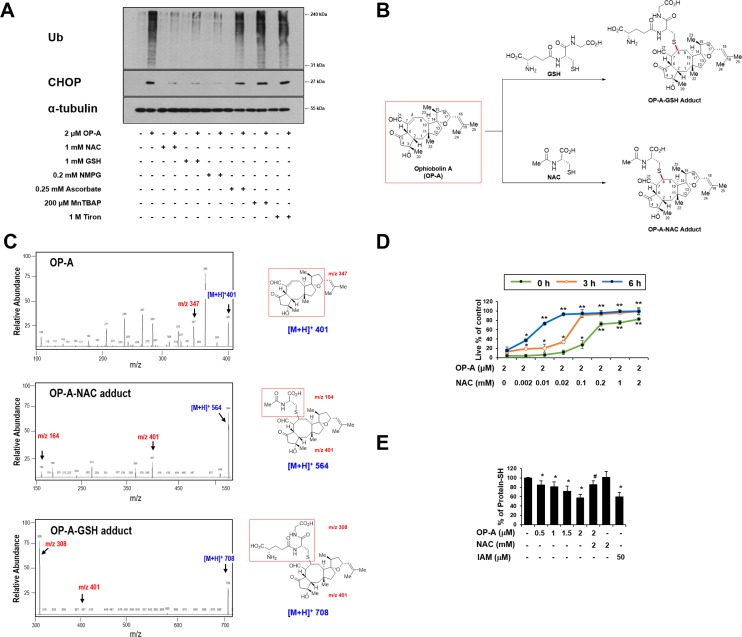
Figure 8. The thiol reactivity of OP-A is critical for its ability to induce paraptosis-like cell death in glioma cells.
(A) T98G cells were pretreated with the indicated concentrations of the respective antioxidant and further treated with 2 µM OP-A for 12 h. Cell extracts were subjected to Western blotting for the indicated proteins. (B) Proposed chemical structures of the OP-A-GSH and OP-A-NAC adducts. (C) Full-scan product ion scan spectra and the expected structures of OP-A, OP-A-NAC, and OP-A-GSH adducts formed upon Michael addition of NAC or GSH. The m/z values of the OP-A-NAC adduct represent NAC at 164, OP-A at 401, and the adduct form at 564. The m/z values of the OP-A-GSH adduct represent GSH at 308, OP-A at 401, and the adduct form at 708. (D) Increasing concentrations of NAC were pre-incubated with 2 µM OP-A in serum-free medium for the indicated time durations at room temperature, and these mixtures were used to treat T98G cells for 24 h. The relative cell viability was measured using calcein-AM and EthD-1. Data represent the means ± SD (n = 7). One-way ANOVA and Bonferroni’s post hoc test. *P < 0.001, **P < 0.0001 vs. OP-A-treated cells. (E) T98G cells were treated with the indicated concentrations of NAC and/or OP-A for 4 h. As a positive control to reduce intracellular protein-SH levels, IAM was used. T98G cells were treated with 50 µM IAM for 4 h. Protein-SH levels were measured using the dibromobimane assay, as described in the Materials and Methods. Data represent the means ± SD. Kruskal-Wallis test was performed followed by Dunn’s test. *P < 0.001 vs. untreated control, #P < 0.001 vs. OP-A treatment.

