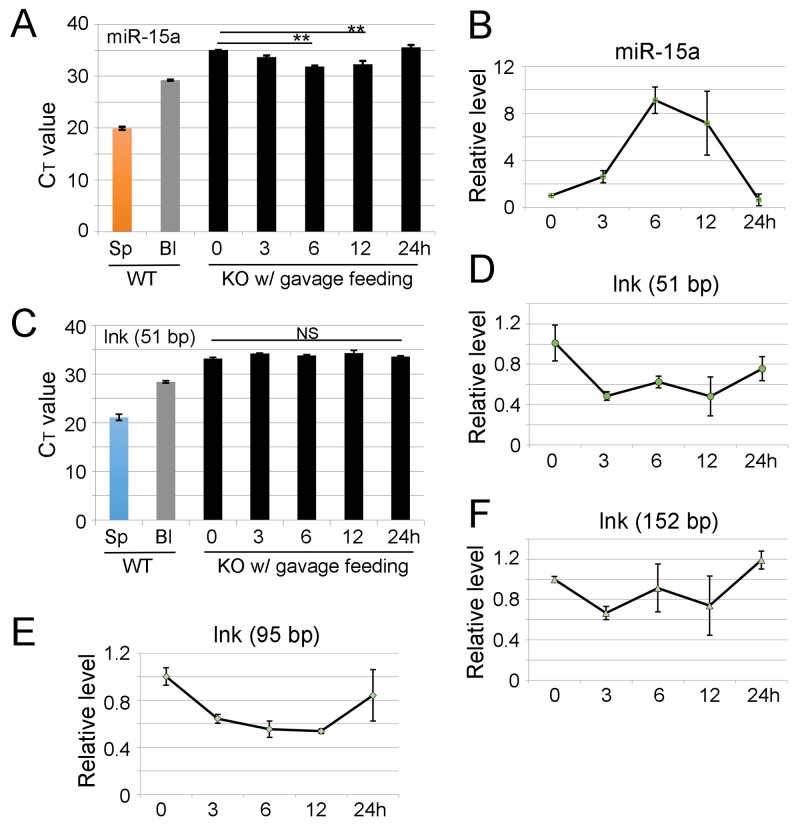
Figure 3. Ingestion of wild type splenocytes slightly increases miR-15a level in miR-15a/16-1 KO blood but fails to increase lnk mRNA in lnk KO mouse blood.
Each miR-15a/16-1 KO mouse was gavage fed with 20 million fresh splenocytes in 200 μl suspension from WT animals. Blood was then drawn from the KO mice at different time points following uptake of the WT splenocytes. miR-15a level in blood was assessed by qRT-PCR. (A) Quantitative analysis of different miR-15a levels in miR-15a/16-1 KO blood, the Y-axis shows CT value. (B) Y-axis shows relative level of miR-15a in miR-15a/16-1 KO blood. snRU6 was the internal control. (C) Quantitative analysis of different lnk mRNA levels in peripheral blood of lnk KO mice after ingestion of same amount of WT splenocytes. The Y-axis shows CT value. (D-F) Y-axis shows relative fold change of lnk mRNA fragments. X-axis shows hours after feeding WT splenocytes. Mouse beta-actin mRNA was used as the loading control. Data is from three independent experiments. Note: there are no fragments longer than 50 bp increased in lnk KO blood after gavage feeding with WT splenocytes and the high CT value may reflect the background noise.

