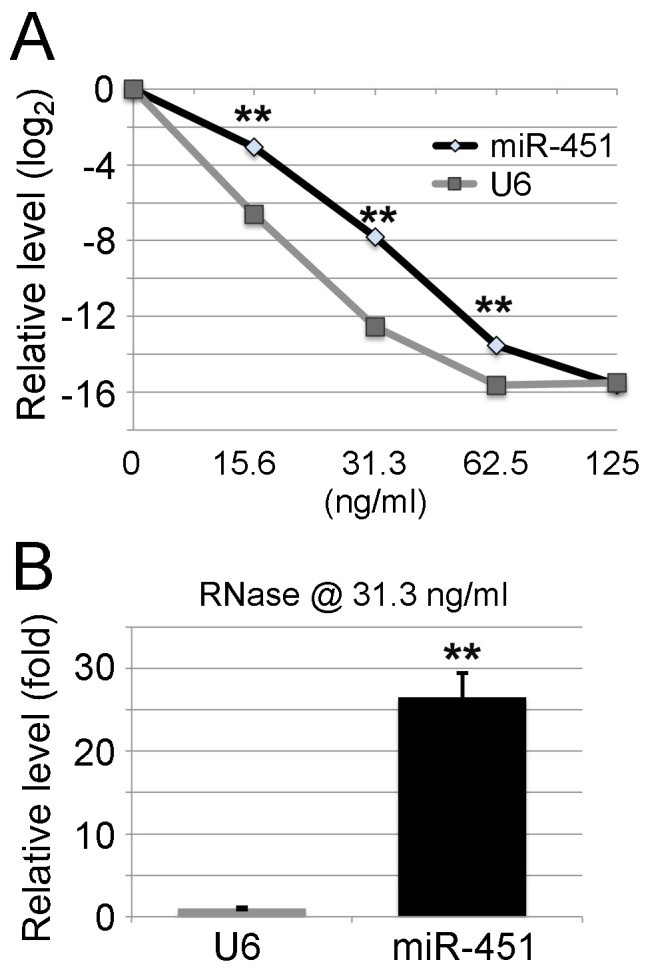
Figure 4. RNase degrades miR-451 efficiently in vitro.

Total RNA from WT blood was treated with RNase A at different concentrations for 30 min at room temperature. (A) miR-451 level after RNase treatment. Relative expression levels are shown on the Y-axis with RNase untreated samples assigned a relative value of 1 (0 on log2 scale). X-axis shows the concentrations of RNase A. As expected, RNase treatment significantly affects the stability of miR-451 in a dose dependent manner. However, miR-451 has a slower degradation rate compared with small nuclear RNA U6 after RNase treatment. Data represents 3 different RNA samples. (B) The fold difference between miR-451 and U6 levels after the treatment with RNase at the concentration of 31.3 ng/ml as shown in (A). Note: miR-451 survives degradation by RNase better than U6.
