Abstract
Purpose
Gliosis‐like retinal alterations, presumed to be activated retinal astrocytes and Müller cells (ARAM), have been reported to occur frequently in patients with glaucoma but rarely in controls. We investigated the association between glaucomatous abnormality and the presence, the extent of retinal region, and the spatial distribution, of hyperreflective retinal alterations on optical coherence tomography (OCT) en‐face images, presumed to be ARAM.
Methods
Findings of hyperreflective structures, presumed to be ARAM, in the central retinal ±24 degrees of OCT en‐face images (acquired with the SPECTRALIS® OCT) were compared between 35 younger controls, 42 older controls and 38 patients with glaucoma. Presumed ARAM was defined as reflective structures on the en‐face images other than retinal vasculature and retinal nerve fibre bundles. Chi‐square tests were used to compare the proportion of younger controls vs older controls with presumed ARAM to investigate the effect of ageing, and the proportion of patients vs age‐similar older controls with presumed ARAM to investigate the effect of disease. We also investigated the effect of glaucoma on the retinal area with presumed ARAM when it was present; we used an analysis of covariance (ancova) to compare the retinal area with hyperreflectivity in patients vs controls, adjusting for the effects of age and axial length.
Results
The mean (S.D.) age of the younger controls, older controls, and patients with glaucoma was 26 (3), 62 (10) and 69 (8) years, respectively. The median (25th quartile, 75th quartile) of the retinal region with the hyperreflective structures, presumed to be ARAM, was zero (0,0), 1 (0,6), and 11 (0,43) degrees square in the younger controls, older controls and patients with glaucoma respectively. The chi‐square test investigating the effect of ageing found χ2(1, N = 77) = 24.8, p < 0.001, and that investigating the effect of disease found χ2(1, N = 80) = 2.3, p = 0.1. The ancova found F(1, 46) = 10.32, P = 0.02.
Conclusions
There was an effect of ageing on the presence of the hyperreflective structures, presumed to be ARAM, on OCT images. Compared to the presence of hyperreflective structures, the extent of retinal region with the hyperreflective structures has a greater potential of being an indicator of glaucomatous degeneration. Further study is needed to investigate the nature of the relation between glaucomatous abnormality and the extent of the retina with the hyperreflective structures, presumed to be ARAM.
Keywords: activated retinal astrocytes and Müller cells, astrocytes, glaucoma, glia, Müller cells, optical coherence tomography
Introduction
Patchy discrete gliosis‐like retinal alterations presumed to be activated retinal astrocytes and Müller cells (ARAM) have been reported to often be found in patients with glaucoma but absent or rare in healthy controls.1, 2 The ability of glial cells to remodel in neural disease processes is well known; however, the mechanism by which this remodelling occurs is not well understood.3, 4 The impact of glial remodelling on neural pathological processes is also still under investigation; nonetheless, recent investigations have reported that glial remodelling plays a strategic role in mechanisms of neural injury, sometimes slowing down the neural degenerative process and other times impacting axonal survival or regeneration.4, 5, 6, 7, 8 For example, given the role of glial cells in modulating neural vascular supply, glial alterations can affect the dynamics of oxygen supply to a neural tissue.9
There is histological evidence that the main retinal macroglia ‐ the astrocytes and Müller cells ‐ undergo some form of remodelling in the presence of neural insults, such as those implicated in glaucomatous degeneration.7, 8, 10, 11 Although it is not clear how this remodelling impacts light interaction with the retinal tissue, Grieshaber et al.2 noticed a change in the backscattered light in the inner retinal layer of subjects with peripheral vascular dysregulation. The characteristics of the structures, and the relation between vascular dysregulation and glial activation, lead to the assumption that the structures were ARAM.12
The ability to visualise these structures opens the opportunity to investigate the relationship between a potential indicator of glial activation and glaucomatous degeneration in vivo, and the potential of using the presumed indicator of glial activation as a biomarker for glaucoma diagnosis. Identifying potential indicators of glaucomatous degeneration is of interest because the disease often presents no symptoms to the patient and can sometimes be missed by clinicians, especially in the early stages of disease.
The finding that presumed ARAM is common in patients with glaucoma but rare in controls has some desirable clinical implications.1, 2 The studies that first reported the potential relation between presumed ARAM and glaucomatous degeneration identified the presumed ARAM on fundus camera images, and it is not clear what the implications of the findings are for optical coherence tomography (OCT) en‐face imaging, a contemporary imaging technology. In OCT en‐face imaging, the presumed ARAM appears as hyperreflective structures13 within the inner 30 μm of the retina.
In this study, we investigated the relation between glaucomatous abnormality and the hyperreflective structures seen on OCT en‐face imaging, presumed to be ARAM. We explored the association between glaucomatous abnormality and the presence, the extent of retinal region and the spatial distribution of the hyperreflective structures.
Methods
Subjects
We examined OCT high density scans acquired from the eyes of controls and from patients with glaucoma enrolled in our lab for an ongoing research project investigating the retinal nerve fibre layer (RNFL) structure in OCT en‐face imaging. The control subjects for the research project were recruited from two separate groups: younger and older control groups. The younger control group (aged 21–35 years) was recruited from students at the Indiana University School of Optometry in Bloomington, Indiana. The older control group (aged 40–85 years) was recruited from subjects who visited the IU Bloomington optometry clinic for eye care services and from older controls who participated in previous studies by our lab. The patients with glaucoma (aged 40–85 years) were recruited from subjects who have been participating in previous research projects by our lab, and new patients were also recruited from among the glaucoma patients receiving eye care at the IU Bloomington optometry clinic.
Inclusion and exclusion criteria
Inclusion criteria included: best corrected visual acuity of at least 6/12, refractive corrections between +6 and −9 dioptre spherical equivalent and cylindrical correction within ±3.0 dioptres, and clear ocular media. Control subjects were required to have had normal results from a comprehensive eye exam (not more than 2 years before the study) that included clinical evaluation of the disc and RNFL. Patients with glaucoma had normal retinal findings with the exception of disc, RNFL, and perimetric abnormalities associated with glaucoma. Perimetric visual results from the Humphrey® Field Analyzer (www.zeiss.com) were considered as showing glaucomatous abnormality when there were reproducible defects at two or more contiguous points with p < 0.01, or three or more contiguous points with p < 0.05, or a 10‐dB difference across the nasal horizontal midline at two or more adjacent points on the total deviation plot (or pattern deviation plot) in the presence of clinical glaucomatous optic neuropathy.14 The exclusion criteria removed subjects with ocular or systemic disease other than glaucoma currently affecting visual function. Eyes with epiretinal membranes were also excluded since epiretinal membranes are a form of retinal nonvascular proliferation.15, 16
Study protocol
Written informed consent was obtained after explaining the nature and purpose of the study to the participant. The subject's visual acuity was checked, then high density images were acquired with the SPECTRALIS® OCT (www.heidelbergengineering.com). The research project for which the data were gathered followed the tenets of the Declaration of Helsinki, and was approved by the Indiana University Institutional Review Board (IRB).
Imaging protocol
Retinal images and circumpapillary retinal nerve fibre layer thickness measures were acquired with the SPECTRALIS® OCT. The circumpapillary retinal nerve fibre layer thickness (cRNFLT) measures were obtained along the circumference of a 3.4 mm diameter circle centred on the optic disc.
A retinal area approximately corresponding to the central ±24 degrees was imaged. Six OCT volumetric images were acquired and then montaged to cover the intended retinal region. High speed imaging mode (11 μm spacing between A‐scans) was used and the spacing between B‐scans was 30 μm. Each B‐scan was averaged over nine frames. The images acquired from each subject were montaged using customized montaging software written in MATLAB (www.mathworks.com).
Defining presumed ARAM
Presumed ARAM was defined to be present when a hyperreflective structure other than a blood vessel or RNFB was present within the retinal nerve fibre layer (Figure 1). Other than the reflections from the blood vessel walls, RNFBs and presumed ARAM, there were also artifactual specular reflections in the retinal inner limiting membrane – retinal nerve fibre bundle (ILM‐RNFB) complex which needed to be distinguished from the reflections from presumed ARAM.
Figure 1.
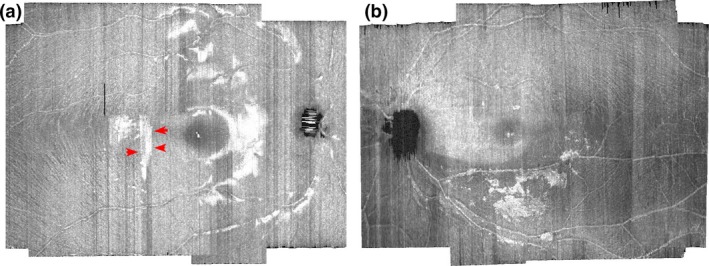
Differentiating presumed activated retinal astrocytes and Müller cells (ARAM) hyperreflectivity from artifactual specular reflections at the inner limiting membrane ‐ retinal nerve fibre layer (ILM‐RNFL) complex. (a) Artifactual specular reflection in a younger control. The arrows in red point to an example of the straight‐line borders of the artifactual specular reflections. The bleached appearance of the specular reflections can also be visualised, helping distinguish between artifactual specular reflectance from putative ARAM reflectance. (b) Hyperreflective structures presumed to be ARAM. The edges and brightness across the reflecting surface vary spatially in a manner that suggests the presence of a structure.
This ILM‐RNFB hyperreflectivity is synonymous with the ʽretinal sheenʼ in ophthalmoscopy, and was usually present in the younger controls. We used the shape and appearance of the reflections to differentiate artifactual ILM‐RNFB specular reflections (Figure 1a) from presumed ARAM hyper‐reflectivity (Figure 1b). Usually the borders of the hyperreflective structures from the presumed ARAM had some form of definable shape, and the brightness of the hyperreflectance appeared to vary spatially across the reflecting region in a manner that suggested the presence of structure. On the other hand, the margins of the ILM‐RNFB specular hyper‐reflections sometimes appeared as straight edges defined by the line of B‐scans (Figure 1a), and the brightness of the ILM‐RNFB specular hyper‐reflection across the reflecting region had a bleached appearance (Figure 1). In instances when a second image of the same eye was available, we confirmed the presence of ARAM on the second image. The reflectivity patterns from presumed ARAM were typically similar in shape and location on the first and second images but were usually dissimilar in shape or location when the reflectivity was due to artifactual ILM‐RNFB specular reflection.
Quantifying presumed ARAM
En‐face slab‐images (Figure 1) were extracted from the OCT volume scans. The en‐face slab images were extracted at 10–14 μm depth from the inner limiting membrane (ILM), approximating halfway through the depth of the hyperreflective structures presumed to be ARAM. For subjects with hyperreflective structures presumed to be ARAM, we quantified the retinal surface region with the hyperreflectivity using a semi‐automated software written in MATLAB. A human observer (BSA) guided the software (which uses spatial filters and contrast thresholding) to quantify the surface area of the hyperreflective regions defined to be ARAM (Figure 2).
Figure 2.
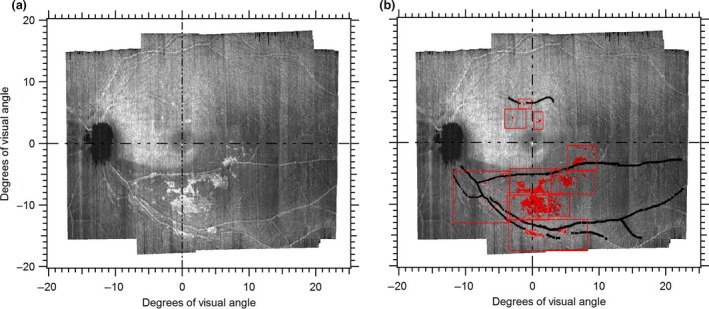
Quantifying presumed activated retinal astrocytes and Müller cells (ARAM) on the en‐face images. (a) En‐face slab image extracted at 10–14 μm showing hyperreflective structures presumed to be ARAM. (b) Output of semi‐automated quantifying tool with regions of presumed ARAM identified in red. The red boxes show how the quantifying tool operated by a human observer first divides the image into sub‐regions to enhance localising the ARAM. The black lines identify regions of the blood vessels so that reflectances from the blood vessel walls are not erroneously quantified as ARAM.
Quantifying the extent of glaucomatous abnormality
The extent of glaucomatous abnormality was quantified based on cRNFLT. We computed the degree of cRNFLT abnormality using a ratio metric we termed ‘depth of defect’ (DD). Mathematically, the depth of defect was computed as
where A is the cRNFLT measure of the region under consideration and B is the mean normal cRNFLT reported by the machine for the region under consideration. Thus, the depth of defect is a measure of the extent of glaucomatous abnormality, adjusted for age, based on the machine normative database.
Analysis
We investigated the effect of ageing on the finding of presumed ARAM, first suggested by Gast et al. (ARVO 2013). We compared two groups: a younger control group aged 20–35 years, and an older control group aged 45–80 years. A chi‐square test was used to compare the proportion of younger controls vs older controls with presumed ARAM.
We investigated the relation between glaucomatous abnormality and presence of the hyperreflective structures presumed to be ARAM. A chi‐square test was used to compare the proportions of patients and older controls having the hyperreflectivity, presumed to be ARAM. An analysis of covariance (ancova) was used to compare the extent of retinal region with the hyperreflectivity presumed to be ARAM in the patients and older controls, compensating for the effects of age and axial length. The goal of this analysis was to investigate the effect of glaucoma on the extent of retinal region with the presumed ARAM, when presumed ARAM was present, and so the analysis was limited only to the older controls and patients with presumed ARAM.
We evaluated the relation between the extent of retinal area with the hyperreflective structures presumed to be ARAM and the extent of glaucomatous abnormality in the patients with glaucoma, using two different analyses. In one analysis, we used a Spearman's rho (rank correlation coefficient) to quantify the relation between the extent of glaucomatous abnormality (defined as the depth of defect of the cRNFLT measure) and the retinal region with the hyperreflective structures, in the subjects with glaucoma. In the second analysis, we used a Mann–Whitney U analysis to compare the extent of glaucomatous abnormality (estimated as depth of defect) between patients with the hyperreflective structures and the patients without the hyperreflective structures. Given that the region imaged by our OCT protocol was mainly temporal to the disc, only the cRNFLT measures in the temporal half of the disc were considered.
Lastly, we also explored the potential of using the distribution of the presumed ARAM across the retinal surface as a predictor of the retinal hemifield with the greatest glaucomatous abnormality. We investigated the consistency between the retinal hemifield with the greatest amount of hyperreflective structures and the cRNFLT hemifield with the greatest depth of defect. The en‐face image was divided into superior and inferior hemifields, along the disc‐fovea line in the retinal region nasal to the fovea, and, along the horizontal midline through the fovea in the region temporal to the fovea. On the cRNFLT measure, we analysed cRNFLT in the superior temporal (ST) and inferior temporal (IT) sectors to determine the retinal hemifield with the greatest glaucomatous abnormality. We used a Cohen's kappa analysis to evaluate the agreement between the retinal hemifield with the greatest extent of presumed ARAM and the retinal hemifield with the greatest cRNFLT depth of defect.
Our study was designed as an exploratory study and so we did not use a Bonferroni adjustment to determine the p‐value at which significance will be defined. We considered that when a test statistic had p < 0.05, the effect was worth investigating by designing a study meant to test that finding.
Results
Table 1 shows some demographic information, clinical findings and retinal area with hyperreflective structures presumed to be activated retinal astrocyte and Müller cells (ARAM).
Table 1.
Demographic information, clinical findings and presumed activated retinal astrocyte and Muller cells (ARAM) findings
| Male/Female | Number | Mean (S.D.) Age (years) | Median enface area with presumed ARAM (25th, 75th quartile) (degree2) | Mean global cRNFLT (μm) | Global cRNFLT (range) (μm) | Mean (S.D.) Axial length (mm) |
|---|---|---|---|---|---|---|
| Patients with glaucoma | ||||||
| Male | 18 | 68 (6) | 11 (0,48) | 64.3 | 48–78 | 24 (1.4) |
| Female | 20 | 70 (9) | 10 (0,35) | 74.9 | 52–96 | 24 (1.2) |
| Total | 38 | 69 (8) | 11 (0,43) | 69.9 | 48–96 | 24 (1.3) |
| Older controls | ||||||
| Male | 20 | 63 (10) | 1 (0,6) | – | – | 24 (1.0) |
| Female | 22 | 60 (9) | 0 (0,3) | – | – | 24 (1.2) |
| Total | 42 | 62 (10) | 1 (0,6) | – | – | 24 (1.1) |
| Younger controls | ||||||
| Male | 16 | 27 (3) | 0 (0,0) | – | – | 24 (1.0) |
| Female | 19 | 25 (2) | 0 (0,0) | – | – | 24 (1.1) |
| Total | 35 | 26 (3) | 0 (0,0) | – | – | 24 (1.0) |
cRNFLT, circumpapillary retinal nerve fibre layer thickness; S.D. means standard deviation. The enface area was quantified in deg. square. An area of zero means ARAM was absent.
The relation between ageing and the hyper‐reflective structures presumed to be ARAM, in the control subjects, is shown in Figure 3. The chi‐squared analysis comparing the proportion of younger controls, and older controls, with the hyper‐reflective structures found χ2(1, N = 77) = 24.8, p < 0.001. Figure 4 shows the extent of the retina with the hyper‐reflective structures in the patients with glaucoma compared to the older controls. The proportion of older controls and patients with presumed ARAM was 55% and 73% respectively. The chi‐squared analysis comparing the proportions of controls and patients having the hyper‐reflective structures found χ2(1, N = 80) = 2.33, p = 0.1. The ancova comparing the retinal region with presumed ARAM in patients and controls found F(1, 46) = 10.32, p = 0.02, with a partial eta squared of 0.18.
Figure 3.
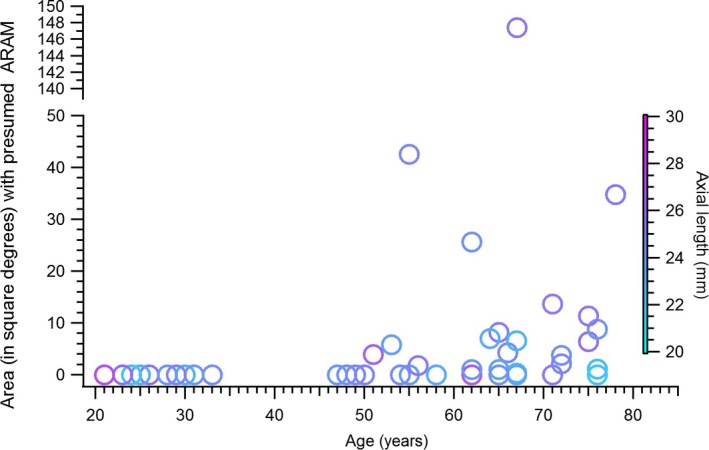
Ageing and the findings of presumed activated retinal astrocytes and Müller cells (ARAM), in controls. Age is plotted on the X‐axis and the extent of retinal area covered by presumed ARAM is plotted on the Y‐axis. An area of zero means presumed ARAM was not present in the subject. The colour of the markers shows the axial lengths of the eyes studied.
Figure 4.
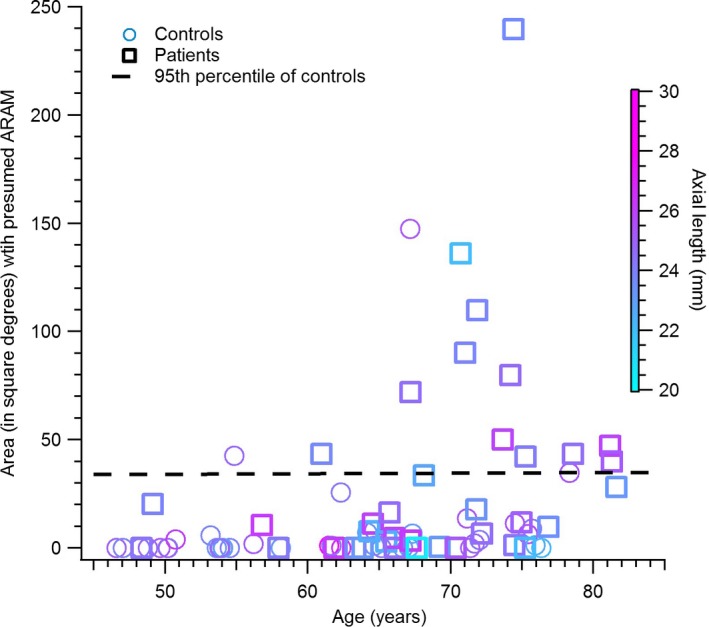
Presumed activated retinal astrocytes and Müller cells (ARAM) in glaucoma patients vs controls. Plot of the extent of retina region with hyperreflective structures, presumed to be ARAM, in the controls vs patients with glaucoma.
Figure 5 is a plot of the retinal area covered by the presumed ARAM in patients against the extent of glaucomatous damage quantified as depth of defect of the cRNFLT. A Spearman's rho assessing the relation between the extent of glaucomatous abnormality and the retinal region with the putative ARAM found r s (38) = 0.1. A Mann–Whitney U analysis comparing the DD in the patients with ARAM to patients without ARAM found a mean rank of 20 and 19 respectively, with U = 134, p = 0.9.
Figure 5.
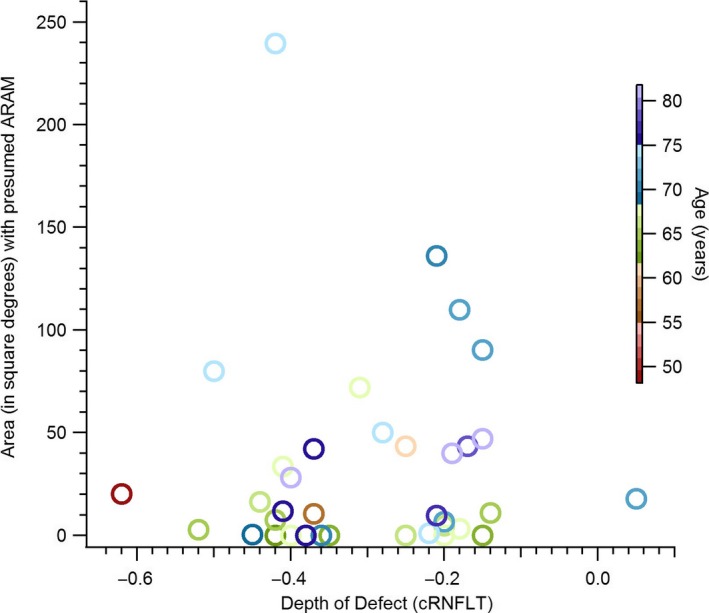
The retinal region with hyperreflective structures, presumed to be activated retinal astrocytes and Müller cells (ARAM) and the extent of glaucomatous circumpapillary retinal nerve fibre layer thickness (cRNFLT) abnormality, in the patients with glaucoma.
The consistency between the retinal hemifield with the greatest amount of ARAM and the retinal hemifield with the greatest amount of cRNFLT abnormality is shown in Figure 6. Cohen's kappa investigating the agreement between the cRNFLT sector with the highest DD and the retinal hemifield with the largest amount of presumed ARAM was k = −0.22, p = 0.24.
Figure 6.
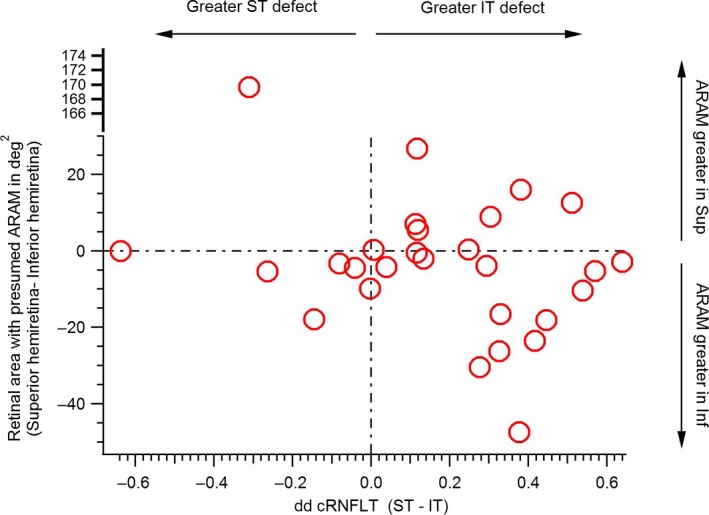
Agreement between hemiretinal area with greatest extent of reflective structures presumed to be activated retinal astrocytes and Müller cells (ARAM), and disc sector with the greatest extent of glaucomatous abnormality. The Y‐axis shows the difference between the area of superior (Sup) hemiretina and inferior (Inf) hemiretina with presumed ARAM. The X‐axis shows the difference between the depth of defect (DD) between the superior temporal (ST) and inferior temporal (IT) circumpapillary retinal nerve fibre layer thickness measures (cRNFLT).
Discussion
We investigated the relation between glaucomatous abnormality and hyperreflective structures seen on OCT en‐face imaging, presumed to be activated retinal astrocytes and Müller cells (ARAM). We found that the presence of the hyperreflective structures in subjects free of eye disease was age dependent, being absent or scarce in younger individuals but common in older individuals. The proportions of patients and age‐similar controls with the hyperreflective structures were similar. When the hyperreflective structures were present, subjects with glaucoma tended to have a greater retinal area with the hyperreflectivity than age‐similar controls, with about 18% of the variance in the extent of retina with the hyperreflective structures explainable by the glaucomatous disease status of a subject. However, the extent of retinal area with the hyper‐reflectivity was not predictive of the degree of glaucomatous abnormality, and its distribution across the retinal hemifields was also not predictive of the retinal hemifield with the greatest extent of glaucomatous cRNFLT abnormality.
Our finding that subjects with glaucoma tended to have a greater retinal region with the hyper‐reflective structures (Figure 4), but the extent of the region was not predictive of the extent of glaucomatous abnormality (Figures 5 and 6) seem contradictory. However, this could reflect a potentially high between‐subject variability in the relation between glaucomatous degeneration and the findings of hyperreflective structures, presumed to be ARAM, on the OCT en‐face images. High between‐subject variability is consistent with some subjects with glaucoma not having the hyperreflective structures at all.
In some patients with glaucoma, the hyperreflective structures were concentrated within regions of the en‐face image that show retinal nerve fibre bundle (RNFB) reflectance abnormality as if to suggest the presumed ARAM was in response to the glaucomatous degeneration (Figures 2 and 7). In some other patients, retinal areas other than those showing RNFB reflectance abnormality also had the hyperreflective structures (Figure 8). It is also the case that, in some patients, the hyperreflective structures were distributed so the retinal hemifield with the greatest cRNFLT abnormality had the greatest extent of retinal area with the presumed ARAM (Figures 7 a and 8 a), while in some others the opposite was true (Figures 7 b and 8 b). Thus from this cross sectional survey, it is still challenging to establish any patterns of how the presence of hyperreflective structures in OCT en‐face imaging in a patient may be related to the glaucomatous abnormality.
Figure 7.
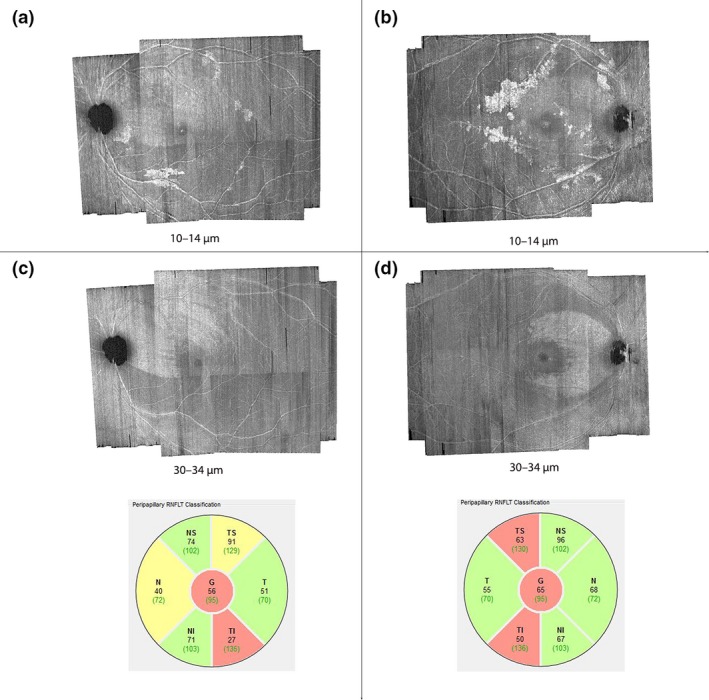
Distribution of hyperreflective structures, presumed to be activated retinal astrocytes and Müller cells (ARAM), in regions of abnormal retinal nerve fibre bundle (RNFB) reflectance. The numbers labelling the figures are the axial depths from the inner limiting membrane at which the en‐face images were generated. (a) and (b) are examples of subjects in whom the distribution of the hyperreflective structures appear to be concentrated in the region of glaucomatous RNFB reflectance abnormality. (c) and (d) show the en‐face images at deeper depths distinctly showing the spatial location of RNFB reflectance abnormalities, and circumpapillary RNFB thickness profiles for the subjects in (a) and (b) respectively.
Figure 8.
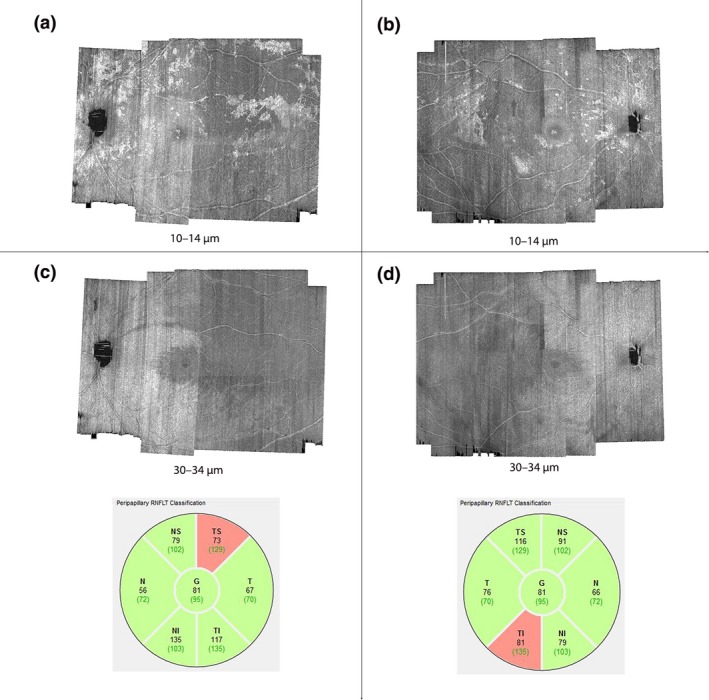
Distribution of the hyperreflective structures, presumed to be activated retinal astrocytes and Müller cells (ARAM). The numbers labelling the figures are the axial depths from the inner limiting membrane (ILM) at which the en‐face images were generated. (a) and (b) are two subjects in whom the distribution of presumed ARAM includes regions that do not appear to have RNFB reflectance abnormality. (c) and (d) are en‐face images extracted at deeper depths, meant to show the spatial locations of the RNFB reflectance abnormalities, and circumpapillary RNFB thickness profiles of the subjects in (a) and (b) respectively.
Our finding that the retinal region with the hyperreflective structures, presumed to be ARAM, in glaucoma patients is greater than in controls (Figure 4 a) potentially explains the difference between proportion of controls with presumed ARAM reported in our study and in previous studies.1, 2 The previous studies identified the presumed ARAM on retinal images acquired with fundus photography, compared to the OCT technology used in our study. Fundus photography uses flood illumination and thus stray light, or scattered light from other retinal regions, has the potential to degrade the contrast of the image. By comparison, OCT imaging scans the illumination beam so that only a small retinal region being imaged is illuminated giving a higher contrast. Furthermore, OCT technology uses coherence techniques to improve the axial sampling of the retina.17 Thus, although fundus imaging may be ideal for identifying other retinal changes, its contrast and axial limitation for viewing the presumed glial alterations may have biased the findings of the previous studies towards detecting only larger regions of presumed ARAM, which we found were more common in patients than controls.
It appears that ageing or some age‐related change such as the normal age‐related retinal nerve fibre thinning or vitreous detachment, has the potential to initiate the stimulus that triggers the development of the hyperreflective structures, presumed to be ARAM.18, 19 The recent finding that patients with glaucoma had more advanced vitreous detachment than controls links our thought that vitreous detachment or some tractional force on the retina triggers the development of presumed ARAM and our finding that the patients with glaucoma had a greater extent of retinal area covered by presumed ARAM.20 Thus, the more advanced vitreous detachment in the patients with glaucoma, than the controls, has the potential to trigger a greater retinal region to develop presumed ARAM in patients with glaucoma than the controls. Although tractional force appears to be a plausible initiator of putative ARAM, as is also thought to be the case in epiretinal retinal membrane nonvascular proliferation,16 vitreous detachment is potentially not the only trigger for putative ARAM formation as there were some subjects with putative ARAM in regions where the vitreous does not appear to be detached (Figure 9). Further study will be needed to investigate the relation between posterior vitreous detachment and the findings of hyperreflective structures presumed to be ARAM.
Figure 9.
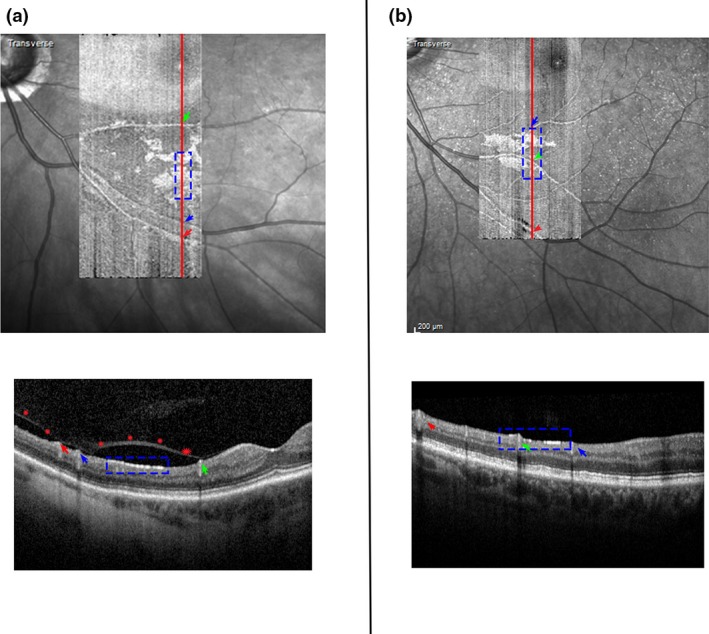
Findings of hyperreflective structures, presumed to be activated retinal astrocytes and Müller cells (ARAM), in regions of posterior vitreous detachment. The images on top are optical coherence tomography (OCT) en‐face images (superimposed on the scanning laser ophthalmoscope images) from two subjects with presumed ARAM. The red lines on the en‐face images identify the position of the B‐scans shown below the respective en‐face images. The arrows identify the blood vessels on the en‐face images with those on the B scan and the blue box identify the regions on the en‐face images with those on the B‐scans. (a) A subject with presumed ARAM in an area of detached vitreous (shown as red stars on the B‐scan). (b) A subject with presumed ARAM but without an observable posterior vitreous detachment.
To enhance our understanding of the potential relation between glaucoma and hyperreflective structures, it will be helpful to understand the cellular basis of these structures. Currently, we do not know of any histological study supporting the claim that these structures are indeed alterations of retinal glial cells. It will also be helpful for future histologic studies investigating glial alterations in glaucoma to also examine the spatial distribution of the glial alterations in relation to the spatial distribution of the glaucomatous abnormality, and any potential relation between the degree of glaucomatous abnormality and the extent of the alterations.
Other properties of the hyperreflective structures, presumed to be ARAM are yet to be fully understood. For instance, it has been suggested that the reflectances of structures change with time. This poses limitations to the inferences that can be drawn from cross‐sectional studies such as ours. Further studies will be needed to understand the temporal properties of the development of the hyperreflective structures, and any potential relations it might have with glaucomatous progression. Another limitation to the findings of our study is the potential of confusing the reflections from the structures presumed to be ARAM, and artifactual reflections from the ILM‐RNFB complex. This challenge is not likely to impact our comparison of the older controls and patients with glaucoma as the specular artifactual reflections were scarce in the older subjects. Its potential effect may have been in investigating the presence of glia in the younger subjects, as the hyperreflectivity from the presumed ARAM may have been masked by the artifactual reflections. However, this is also not likely because we did not find hyperreflections with the characteristics of presumed ARAM in the younger controls who did not have any artifactual ILM‐RNFB specular reflections.
To conclude, there was no significant difference in the proportion of controls and patients with hyperreflective structures, presumed to be ARAM, on OCT en‐face imaging. Compared to the presence of the hyperreflective structures, the extent of retinal region with the hyperreflective structures has a greater potential of being an indicator of glaucomatous abnormality. However, the potential relation between glaucomatous degeneration and the retinal region with the reflective structures appears variable, and it is challenging to reliably predict the extent of glaucomatous abnormality from the amount or distribution of the hyperreflectivity.
Disclosure
The authors Ashimatey and King report no conflicts of interest and have no proprietary interest in any of the materials mentioned in this article. The author Swanson has disclosed the following commercial relationships: Heidelberg Engineering – Consultant; Carl Zeiss Meditec – Consultant.
Acknowledgements
This research was supported by grants from the National Institutes of Health: NIH R01EY024542, 5P30EY019008.
Ashimatey BS, King BJ & Swanson WH. Retinal putative glial alterations: implication for glaucoma care. Ophthalmic Physiol Opt 2018; 38: 56–65. https://doi.org/10.1111/opo.12425
References
- 1. Graf T, Flammer J, Prunte C & Hendrickson P. Gliosis‐like retinal alterations in glaucoma patients. J Glaucoma 1993; 2: 257–259. [PubMed] [Google Scholar]
- 2. Grieshaber MC, Moramarco F, Schoetzau A, Flammer J & Orguel S. Detection of retinal glial cell activation in glaucoma by time domain optical coherence tomography. Klin Monbl Augenheilkd 2012; 229: 314–318. [DOI] [PubMed] [Google Scholar]
- 3. Ogden TE. Nerve fiber layer astrocytes of the primate retina: morphology, distribution, and density. Invest Ophthalmol Vis Sci 1978; 17: 499–510. [PubMed] [Google Scholar]
- 4. Vecino E, Rodriguez FD, Ruzafa N, Pereiro X & Sharma SC. Glia‐neuron interactions in the mammalian retina. Prog Retin Eye Res 2016; 51: 1–40. [DOI] [PubMed] [Google Scholar]
- 5. Pekny M & Pekna M. Astrocyte reactivity and reactive astrogliosis: costs and benefits. Physiol Rev 2014; 94: 1077–1098. [DOI] [PubMed] [Google Scholar]
- 6. Hernandez MR. The optic nerve head in glaucoma: role of astrocytes in tissue remodeling. Prog Retin Eye Res 2000; 19: 297–321. [DOI] [PubMed] [Google Scholar]
- 7. Johnson EC & Morrison JC. Friend or foe? Resolving the impact of glial responses in glaucoma. J Glaucoma 2009; 18: 341–353. [DOI] [PMC free article] [PubMed] [Google Scholar]
- 8. Sun D, Moore S & Jakobs TC. Optic nerve astrocyte reactivity protects function in experimental glaucoma and other nerve injuries. J Exp Med 2017; 214: 1411–1430. [DOI] [PMC free article] [PubMed] [Google Scholar]
- 9. Flammer J & Konieczka K. The discovery of the Flammer syndrome: a historical and personal perspective. EPMA J 2017; 8: 75–97. [DOI] [PMC free article] [PubMed] [Google Scholar]
- 10. Wang L, Cioffi GA, Cull G, Dong J & Fortune B. Immunohistologic evidence for retinal glial cell changes in human glaucoma. Invest Ophthalmol Vis Sci 2002; 43: 1088–1094. [PubMed] [Google Scholar]
- 11. Gallego BI, Salazar JJ, de Hoz R et al IOP induces upregulation of GFAP and MHC‐II and microglia reactivity in mice retina contralateral to experimental glaucoma. J Neuroinflammation 2012; 9: 92. [DOI] [PMC free article] [PubMed] [Google Scholar]
- 12. Grieshaber MC, Orgul S, Schoetzau A & Flammer J. Relationship between retinal glial cell activation in glaucoma and vascular dysregulation. J Glaucoma 2007; 16: 215–219. [DOI] [PubMed] [Google Scholar]
- 13. Scoles D, Higgins BP, Cooper RF et al Microscopic inner retinal hyper‐reflective phenotypes in retinal and neurologic disease. Invest Ophthalmol Vis Sci 2014; 55: 4015–4029. [DOI] [PMC free article] [PubMed] [Google Scholar]
- 14. Swanson WH, Malinovsky VE, Dul MW et al Contrast sensitivity perimetry and clinical measures of glaucomatous damage. Optom Vis Sci 2014; 91: 1302–1311. [DOI] [PMC free article] [PubMed] [Google Scholar]
- 15. Haritoglou C, Schumann RG & Wolf A. Epiretinal gliosis. Ophthalmologe 2014; 111: 485–497. [DOI] [PubMed] [Google Scholar]
- 16. Zhao F, Gandorfer A, Haritoglou C et al Epiretinal cell proliferation in macular pucker and vitreomacular traction syndrome: analysis of flat‐mounted internal limiting membrane specimens. Retina 2013; 33: 77–88. [DOI] [PubMed] [Google Scholar]
- 17. Burns SA, Tumbar R, Elsner AE, Ferguson D & Hammer DX. Large‐field‐of‐view, modular, stabilized, adaptive‐optics‐based scanning laser ophthalmoscope. J Opt Soc Am A Opt Image Sci Vis 2007; 24: 1313–1326. [DOI] [PMC free article] [PubMed] [Google Scholar]
- 18. Lumi X, Hawlina M, Glavac D et al Ageing of the vitreous: from acute onset floaters and flashes to retinal detachment. Ageing Res Rev 2015; 21: 71–77. [DOI] [PubMed] [Google Scholar]
- 19. Patel NB, Lim M, Gajjar A, Evans KB & Harwerth RS. Age‐associated changes in the retinal nerve fiber layer and optic nerve head. Invest Ophthalmol Vis Sci 2014; 55: 5134–5143. [DOI] [PMC free article] [PubMed] [Google Scholar]
- 20. Schwab C, Glatz W, Schmidt B et al Prevalence of posterior vitreous detachment in glaucoma patients and controls. Acta Ophthalmol 2016; 95: 276–280. [DOI] [PubMed] [Google Scholar]


