

Abstract
Cardiovascular disease is a leading cause of death among liver transplant (LT) recipients. With a rising burden of post-transplant metabolic disease, increases in cardiovascular-related morbidity and mortality may reduce life expectancy following liver transplantation. It is unknown if the risk of long-term major cardiovascular events (MCE) differs among LT recipients with varying diabetic states. We performed a retrospective cohort study of LT recipients from 2003 to 2013, to compare the incidence of MCE among patients 1) without diabetes, 2) with pre-transplant diabetes 3) with de novo transient post-transplant diabetes, and 4) with de novo sustained post-transplant diabetes. We analyzed 994 eligible patients (39% normal, 24% pre-transplant diabetes, 16% transient post-transplant diabetes, and 20% sustained post-transplant diabetes). Median follow up was 54.7 months. Overall, 12% of patients experienced a MCE. Adjusting for demographic and clinical variables, sustained post-transplant diabetes was the only state associated with a significantly increased risk of MCE (SHR 1.95, 95% CI 1.20–3.18). Patients with sustained post-transplant diabetes mellitus had a 13% and 27% cumulative incidence of MCE at 5 and 10 years. While pre-transplant diabetes has traditionally been associated with cardiovascular disease, the long-term risk of MCE is greatest in LT recipients with sustained post-transplant diabetes mellitus.
Introduction
Through advances in surgical techniques, organ donation, critical care and immunosuppression, liver transplant (LT) recipients in the United States have expected 1- and 5-year survival rates of greater than 90% and 70%, respectively.(1) Over the last decade however, there has been a plateau in long-term graft-attrition rates and patient survival.(2,3) This plateau parallels a rise in the prevalence of post-transplant metabolic syndrome and cardiovascular disease (CVD), which is now a leading cause of non-graft related death of LT recipients.(4–6) With increasing rates of post-transplant metabolic syndrome, an aging population of transplant recipients, and widespread use of calcineurin inhibitors for the prevention of graft rejection, LT recipients have 2.6 times greater risk of death from CVD compared to an age and sex matched non-transplant population.(4,7) Furthermore, as the proportion of patients undergoing LT for non-alcoholic fatty liver disease (NAFLD) rises, the contribution of CVD to all-cause mortality of LT recipients is anticipated to increase over the next 20 years.(5)
Over the last decade, de novo post-transplant diabetes mellitus (PTDM), encompassing both transient and sustained forms of PTDM, has been increasingly recognized as a complication of solid-organ transplantation.(8,9) Risk factors for PTDM include older age at transplant, male gender, African-American race, Hispanic ethnicity, chronic hepatitis C infection, NAFLD, tacrolimus use, weight gain after LT, and acute graft rejection.(4,8–10) Diabetes mellitus (DM) in the post-transplant setting has previously been identified as an independent predictor of mortality, diminished graft survival, and post-transplant cardiovascular events.(11–13) However, many prior investigations of the prognostic impact of PTDM and risk factors for post-LT CVD did not distinguish de novo PTDM from pre-LT DM persisting after LT or further subdivide PTDM into transient and sustained forms.(12–15) Furthermore, cardiovascular events, such as arrhythmia and congestive heart failure, have often been incorporated in composite outcomes of cardiovascular events, preventing study of the relationship of DM with ischemic type events specifically.
Thus, the differential associations between specifically defined diabetic states and ischemic type post-LT cardiac events have not been previously investigated in a large cohort of LT recipients. In this study, we linked Organ Procurement and Transplantation Network (OPTN)/United Network for Organ Sharing (UNOS) data with data from a large single center LT cohort in order to (1) compare the risk of long-term major cardiovascular events (MCE) among LT recipients with varying diabetic states; and (2) determine the impact of MCE on mortality following LT. We hypothesized that patients with sustained PTDM (s-PTDM) have a significantly greater risk of MCE than patients without diabetes and that MCE is associated with post-LT mortality.
Methods
Data Source
This retrospective cohort study used data from the Penn Data Store (PDS) and the OPTN/UNOS data set. PDS is a clinical data repository maintained within the University of Pennsylvania Health System (UPHS) Data Analytic Center, which supplies clinical, administrative, and pharmacy data through an automated extraction of data elements from multiple patient record systems within the health network. The OPTN/UNOS data set includes donor and recipient transplant related data. This study used data obtained from the PDS and OPTN/UNOS from all patients who underwent LT at the Hospital of the University of Pennsylvania (HUP) from January 1, 2003 through December 31, 2013. These dates were chosen to maximize acquisition of electronic administrative, laboratory, and pharmacy data from the PDS and to ensure at least 18 months of follow up for the last included LT recipient in the cohort.
Study subjects
We assembled a single center cohort of adult (>18 years of age) LT recipients from January 1, 2003 through December 31, 2013. We excluded LT recipients with less than 6 months of post-LT follow up due to the inability to adequately assess their post-transplant DM status. Multi-organ recipients and patients with a solid-organ or hematopoietic stem cell transplant prior to the date of LT were excluded due to their propensity to receive immunosuppressive regimens which differ from the standard regimen used in LT recipients at our institution, as more intensive immunosuppressive regimens and prolonged glucocorticoid exposure may confer an increased risk of PTDM. Patients with a history of MCE prior to cohort entry were excluded. Finally, LT recipients listed as Status 1A were excluded as their risk of post-LT metabolic disease and CVD may differ from those transplanted for chronic liver disease.
Follow Up Period
Patients entered the cohort six months from the date of LT. This was selected as the cohort entry time to reduce diabetes exposure misclassification and eliminate immortal time bias associated with ascertaining diabetes exposure in the first six months following LT. Patients were censored from the analysis on the date of their last inpatient or outpatient counter or on the study end date, September 30, 2015, the last date of use for the International Classification of Diseases, Ninth Revision, Clinical Modification (ICD-9-CM).
Diabetic States and Covariates
Ascertainment of diabetes status was achieved by manual chart review in conjunction with extracted PDS diagnosis codes from inpatient and outpatient encounters as well as laboratory and pharmacy data. DM was diagnosed according to the American Diabetes Association definition (Hemoglobin A1c >6.5%, fasting plasma glucose ≥126 mg/dL, a 2-hour plasma glucose level of ≥200 mg/dL or higher during a 75-g oral glucose tolerance test, a random plasma glucose of 200 mg/dL or higher on two occasions, or requiring medication for the management of hyperglycemia).(16) Using this diagnostic criteria for DM, patients were divided into four DM groups: (1) normal—patients lacking a diagnosis of DM both prior to and following LT, (2) Pre-LT DM—patients with a diagnosis of DM prior to the date of LT, (3) transient-PTDM (t-PTDM)— patients with de novo DM for greater than 30 days but remitting sooner than six months from the date of LT, and (4) s-PTDM—patients with de novo DM for at least six months following LT. For patients in which s-PTDM was diagnosed >6 months following LT, patients were categorized as “normal” until they met criteria for the diagnosis of DM.
Covariate selection was based on partial knowledge of the underlying causal structure associating post-LT metabolic disease to MCE. In addition, we a priori selected covariates associated with DM, MCE, or potential confounders of the association between DM and MCE to be included in the final multivariable regression model.(17) Collected covariates included patient demographics (gender, age at LT, race/ethnicity, body mass index (BMI) at LT, change in BMI following LT, pack-years of cigarettes smoked at time of LT), LT related variables (etiology of liver disease, MELD at LT, deceased vs. living donor, hepatocellular carcinoma (HCC) on explant, year of LT), biopsy proven acute cellular rejection (ACR), diagnosis of hypertension or hyperlipidemia, presence or development of end-stage renal disease (ESRD), and prescription of statin (both time-varying). Change in BMI was defined as the difference between the last recorded post-LT BMI measurement prior to cohort entry and the BMI at LT.
Study Outcomes
The primary outcome was MCE, defined as a composite of cardiac arrest, fatal and non-fatal myocardial infarction, ischemic stroke, and symptomatic peripheral artery disease requiring a revascularization intervention. Ascertainment of each MCE event was achieved by an automated query of PDS data to identify one inpatient or two outpatient encounters with an ICD-9-CM diagnosis code and/or ICD-9-CM procedure codes with high positive predictive value for cardiac arrest, myocardial infarction, ischemic stroke, and symptomatic peripheral vascular disease requiring intervention (see Table S1).(18–22) All MCE identified by the automated query were adjudicated via manual chart review by the primary author (GR). Furthermore, a random sample of 15% of patients without a MCE underwent manual chart review to determine the negative predictive value of the algorithm. The secondary outcome was death. Death was determined through an automated query of PDS data for date deceased, manual chart review, and linkage to UNOS/OPTN data.
Statistical Analyses
Baseline clinical and demographic characteristics were summarized by medians and interquartile ranges (IQR) for continuous variables or count (%) for categorical variables. Comparisons among the DM groups were performed using chi-square and Kruskal-Wallis tests, when appropriate. Cuzick’s non-parametric test for trend across ordered groups was used to test for temporal changes in age at LT, BMI at LT, and MELD score over time.(23) Univariable and multivariable logistic regression models were used to determine demographic and clinical factors associated with development of t-PTDM and s-PTDM among patients without pre-LT DM. Variables with a p<0.20 were included in a multivariable model to test for independent associations with t-PTDM and s-PTDM respectively.
Multivariable competing risk Cox regression models, according to the methods of Fine and Gray (24,25), were used to compare MCE risk among patients by their time-varying diabetic state. MCE was the primary outcome, and death as the competing event. Death was modeled as a competing risk because if the mortality rate in one diabetes exposure group was substantially higher, the calculated risk of MCE may be biased without accounting for death being a competing risk.(25,26) In the multivariable model, we adjusted for a priori selected demographic and clinical characteristics associated with MCE or death that were available in our dataset: age at LT, gender, race, etiology of liver disease, pack-years of cigarettes smoked, hypertension, and hyperlipidemia. In addition, all other covariates were fit in a univariable model and those with a p <0.10 were tested for inclusion in the multivariable model using a change-in-effect criterion. Covariates that resulted in a >10% change of the β-coefficient of at least one DM status after inclusion into the univariable model were considered confounders and added to the final multivariable model.(27,28) The adjusted cumulative incidence of MCE was calculated for each DM group. Using the Wald test, we tested for a priori interactions between DM status and BMI at LT, DM status and change in BMI, and DM and hyperlipidemia, given that the association between DM status and MCE may be differentially impacted by obesity and the presence of hyperlipidemia, two components of the metabolic syndrome.
Univariable and multivariable models were fit using both complete case analysis and following multiple imputation for missing data (BMI at LT 12.7% missing, change in BMI 23.6% missing, MELD 18.6% missing, and pack-years 26.5% missing) using the chained equations approach. Thirty imputed sets were created using the predictive mean matching method (29,30) stratified by year of LT. This semi-parametric matching method uses only observed values to generate a linear prediction model, such that the distribution and range of the data are preserved and plausible imputed values are guaranteed.(31)
In the secondary analysis, we compared time to death of LT recipients who experienced a MCE to those who remained MCE-free. MCE was treated as a time-varying covariate. Univariable Cox proportional hazards models were fit to identify covariates associated with mortality. A multivariable Cox proportional hazards model incorporating all covariates from the multivariable model of the primary analysis was fit to compare adjusted survival among patients prior to and following MCE. Using the Wald test, we tested for an interaction between MCE and DM status, given that the association between MCE and death may be differentially impacted by PTDM. We tested Schoenfeld residuals to determine if the proportional hazards assumption was upheld for the two groups.
Two-sided p values <0.05 were considered statistically significant. Analyses were performed using STATA statistical software, version 14.0 (StataCorp, College Station, TX). The institutional review board at the University of Pennsylvania approved this study.
Results
Cohort characteristics
1304 patients underwent LT between 1/1/2003 and 12/31/2013. 994 eligible patients were analyzed (Figure 1) with a median follow up of 54.7 months (Range 6.1–153.0 months). At cohort entry, 392 (39%) were normal, 243 (24%) had pre-LT DM, and 359 (36%) had developed PTDM. Of patients with PTDM, 55% developed s-PTDM. Following LT, 243/243 patients with pre-LT DM remained diabetic and required glucose lowering therapy for at least six months. Among patients without DM at cohort entry, 28 (3%) patients later developed s-PTDM (Figure 1). Baseline patient demographic and clinical characteristics at cohort entry are displayed in Table 1. Patients with pre-LT DM were older, more likely to have non-alcoholic steatohepatitis (NASH) as the etiology of end-stage liver disease, had lower MELD at LT, and had a greater BMI at LT than patients of other DM groups. The median change in BMI following LT was +0.84 kg/m2 (IQR +0.17 – +1.37) and this was similar across DM groups. Median age at LT steadily increased over time, from 53 (IQR 48.0–59.5) in years 2003–2005 to 59 (IQR 54.1–64.4) in years 2012–2013 (p<0.01). There was no discernable trend in BMI at LT or MELD score over time (p=0.20 and p=0.40 respectively).
Figure 1.
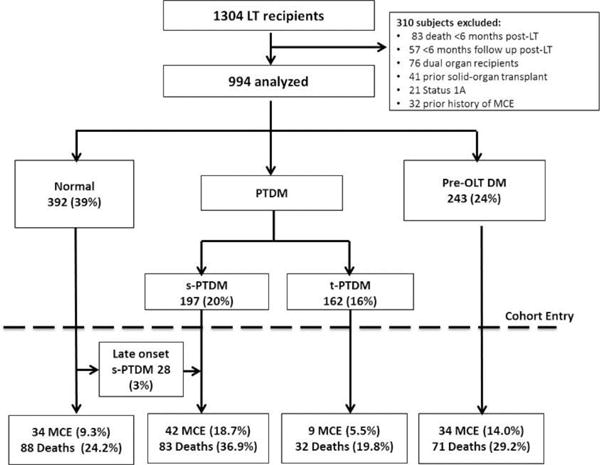
Cohort flow diagram of liver transplant recipients characterized by their diabetes exposure.
Table 1.
Baseline characteristics of 994 liver transplant recipients from January 1, 2003 through December 31, 2015.
| Exposure Groups | ||||||
|---|---|---|---|---|---|---|
| Entire Cohort (n = 994) | No DM (n =392) | Pre-LT DM (n =243) | t-PTDM (n = 162) | s-PTDM (n = 197) | p value | |
| Males, n. (%) | 719 (72) | 291 (74) | 172 (71) | 113 (70) | 143 (73) | 0.67 |
| Age, year (median, IQR) | 55 (49–61) | 54 (48–59) | 58 (52–63) | 56 (50–62) | 56 (49–61) | <0.01 |
| Race | ||||||
| Caucasian - Non-Hispanic | 686 (69) | 289 (73) | 162 (67) | 106 (65) | 129 (65) | 0.31 |
| African American | 164 (17) | 53 (14) | 46 (19) | 26 (16) | 39 (20) | |
| Hispanic | 31 (3) | 8 (2) | 8 (3) | 7 (4) | 8 (4) | |
| Asian and other | 113 (11) | 42 (11) | 27 (11) | 23 (14) | 21 (11) | |
| Etiology of liver disease | ||||||
| Alcohol | 149 (15) | 67 (17) | 26 (11) | 27 (17) | 29 (15) | <0.01 |
| Hepatitis C | 539 (54) | 215 (55) | 129 (53) | 81 (50) | 114 (58) | |
| NASH / Cryptogenic Cirrhosis | 103 (10) | 25 (6) | 53 (22) | 8 (5) | 17 (9) | |
| Autoimmune / Choiestatic | 116 (12) | 50 (13) | 18 (7) | 26 (16) | 22 (11) | |
| Hepatitis B and other | 87 (9) | 35 (9) | 17 (7) | 20 (12) | 15 (8) | |
| MELD score (median, IQR) | 20 (13–27) | 20 (13–26) | 18 (13–25) | 22 (12–31) | 21 (14–31) | 0.04 |
| BMI at transplant (median, IQR) | 27 (24–32) | 27 (24–30) | 28 (25–33) | 27 (24–31) | 28 (24–33) | <0.01 |
| Change in BMI (median, IQR) | +0.84 (+0.17–+1.37) | +0.82 (+0.24–+1.38) | +0.70 (+0.12–+1.32) | +0.92 (+0.21– +1.33) | +0.93 (+0.10– +1.41) | 0.79 |
| Hypertension | 435 (44) | 130 (33) | 150 (62) | 62 (38) | 93 (47) | <0.01 |
| Hyperlipidemia | 140 (14) | 33 (8) | 64 (26) | 14 (9) | 29 (15) | <0.01 |
| Pack-years smoked (median, IQR) | 3 (0–20) | 5 (0–20) | 3 (0–18) | 1 (0–18) | 2 (0–20) | 0.62 |
| End stage renal disease | 138 (14) | 46 (12) | 40 (17) | 18 (11) | 34 (17) | 0.12 |
| Acute Cellular Rejection | 61 (6) | 13 (3) | 14 (6) | 18 (11) | 16 (8) | <0.01 |
pre-LT DM = pre-transplant diabetes mellitus; t-PTDM = transient post-transplant diabetes mellitus; s-PTDM = sustained post-transplant diabetes mellitus; NASH = non-alcoholic steatohepatitis; MELD = Model for End Stage Liver Disease; BMI = body mass index
Predictors of t-PTDM and s-PTDM
A total of 751 patients without a history of DM at the time of LT were analyzed to determine demographic and clinical variables associated with the development of t-PTDM and s-PTDM respectively. Year of LT was the only variable independently associated with t-PTDM (Odds Ratio [OR] 1.35, 95% Confidence Interval [CI] 1.26–1.44, see Table S2). In contrast, African-American race (OR 1.66, 95% CI 1.06–2.58), hepatitis C (OR 1.46, 95% CI 1.00–2.12), NASH (OR 2.14, 95% CI 1.10–4.16), MELD score (OR 1.02, 95% CI 1.00–1.04), ACR (OR 2.08, 95% CI 1.10–3.93), and year of LT (OR 0.91, 95% CI 0.87–0.96) were independently associated with the development of s-PTDM (Table S3).
MCE Risk
Overall, 119 (12%) patients experienced a MCE—10 patients suffered cardiac arrest, 53 experienced a myocardial infarction, 35 had an ischemic stroke, and 21 patients required intervention for symptomatic peripheral artery disease. 131 randomly selected patients without an identified MCE based on the automated algorithm underwent manual chart review; two patients had experienced a MCE (one myocardial infarction and one ischemic stroke) and were treated at hospitals outside our health system. The positive and negative predictive values of the automated algorithm to identify MCE were 99.1% and 98.4% respectively.
Among patients who experienced a MCE, the median time to MCE was 39.4 months following LT (IQR 17.0 to 71.3 months). Patients with s-PTDM had the highest incidence of MCE (18.7%), while those with t-PTDM had the lowest (5.5%) (Figure 1). The incidence of MCE in normal patients and those with pre-LT DM, t-PTDM, and s-PTDM was 14.3, 23.0, 11.5 and 44.4 per 1,000 person-years respectively. In univariable competing risk regression analyses, DM status, race, age at LT, etiology of liver disease, pack-years smoked, hypertension, hyperlipidemia, statin use, end-stage renal disease diagnosis and year of LT were significantly associated with MCE (Table 2). Interactions between DM status and BMI, DM status and change in BMI, and DM status and hyperlipidemia were not significant (p=0.48, p=0.35 and p=0.76 respectively). After testing for confounding of the association between DM status and MCE, year of LT resulted in a greater than 10% change in the β-coefficients of DM status and was added to the final multivariable model in addition to the variables selected a priori.
Table 2.
Univariable competing risk regression assessment of MCE risk
| Variable | SHR | p value | Change in Effect1 |
|---|---|---|---|
| Diabetes Status | <0.01 | N/A | |
| Normal | Ref | – | |
| Pre-LT DM | 1.82 | 0.01 | |
| t-PTDM | 0.89 | 0.75 | |
| s-PTDM | 2.40 | <0.01 | |
| Gender2 | No | ||
| Female | Ref | ||
| Male | 1.40 | 0.12 | |
| Race2 | 0.04 | No | |
| Caucasian | Ref | – | |
| African American | 1.42 | 0.12 | |
| Hispanic | 1.13 | 0.82 | |
| Asian and other | 0.37 | 0.03 | |
| Age at LT2 | 1.06 | <0.01 | Yes |
| HCC | 1.28 | 0.17 | No |
| Etiology of ESLD2 | 0.05 | No | |
| Alcohol | Ref | – | |
| HCV | 0.66 | 0.09 | |
| NASH/Cryptogenic | 1.19 | 0.57 | |
| Autoimmune/Cholestatic | 0.47 | 0.05 | |
| HBV/Other | 0.58 | 0.18 | |
| MELD score at LT | 1.01 | 0.37 | No |
| BMI at LT | 0.99 | 0.65 | No |
| Change in BMI | 0.99 | 0.96 | No |
| LDLT | 0.96 | 0.92 | No |
| Pack years smoked2 | 1.01 | 0.01 | Yes |
| Hypertension2 | 2.31 | <0.01 | Yes |
| Hyperlipidemia2 | 2.98 | <0.01 | Yes |
| Statin Use | 1.78 | 0.04 | No |
| ESRD | 1.78 | <0.01 | No |
| Acute Rejection | 1.18 | 0.58 | No |
| Year of LT | 1.10 | <0.01 | Yes |
Change in effect occurred if there was a >10% change of the β-coefficient of at least one DM status after inclusion of the covariates into the univariable model between DM status and MCE.
Variables selected a priori for inclusion in the final multivariable model
SHR = subdistribution hazard ratio; pre-LT DM = pre-transplant diabetes mellitus; t-PTDM = transient post-transplant diabetes mellitus; s-PTDM = sustained post-transplant diabetes mellitus; HCC = hepatocellular carcinoma; ESLD = end-stage liver disease; HCV = hepatitis C virus; NASH = non-alcoholic steatohepatitis; HBV = hepatitis B virus; MELD = Model for End Stage Liver Disease; BMI = body mass index; LDLT = living donor liver transplant; ESRD = end stage renal disease
In multivariable competing risk regression (Table 3), s-PTDM was the only DM status which was significantly associated with MCE (subdistribution hazard ratio [SHR] 1.95, 95% CI 1.20–3.18). The risk of MCE was greater in patients with s-PTDM than those with pre-LT DM (SHR 1.81, 95% CI 1.14–2.90) and those with t-PTDM (SHR 2.52, 95% CI 1.22–5.23). Age at LT (SHR 1.04, 95% CI 1.02–1.07), hypertension (SHR 1.53, 95% CI 1.03–2.28), and hyperlipidemia (SHR 2.27, 95% CI 1.48–3.47) were also significantly associated with MCE. Pack-years of cigarettes smoked had a non-significant association with MCE (SHR 1.01, 95% CI 1.00–1.02). Analyses using complete case analysis were similar to those using imputation for missing covariates (results not shown). The 60 and 120 month cumulative incidence of MCE in patients with s-PTDM was 13% and 27% compared to 9% and 19% in those with pre-LT DM (Figure 2).
Table 3.
Final multivariable competing risk regression assessment of MCE risk
| Variable | SHR | P-value |
|---|---|---|
| Diabetes Status | <0.01 | |
| Normal | Ref | – |
| Pre-LT DM | 1.07 | 0.79 |
| T-PTDM | 0.77 | 0.51 |
| S-PTDM | 1.95 | <0.01 |
| Race | 0.15 | |
| Caucasian | Ref | – |
| African American | 1.26 | 0.36 |
| Hispanic | 1.09 | 0.87 |
| Asian and other | 0.37 | 0.05 |
| Age at LT | 1.04 | <0.01 |
| Male Gender | 1.38 | 0.17 |
| Etiology of ESLD | 0.28 | |
| Alcohol | Ref | – |
| Hepatitis C | 0.69 | 0.17 |
| NASH/Cryptogenic | 1.01 | 0.97 |
| Autoimmune/Cholestatic | 0.68 | 0.37 |
| Hepatitis B / Other | 1.31 | 0.59 |
| Pack-years | 1.01 | 0.05 |
| Hypertension | 1.53 | 0.04 |
| Hyperlipidemia | 2.27 | <0.01 |
| Year of LT | 1.05 | 0.12 |
pre-LT DM = pre-transplant diabetes mellitus; t-PTDM = transient post-transplant diabetes mellitus; s-PTDM = sustained post-transplant diabetes mellitus; ESLD = end stage liver disease; NASH = non-alcoholic steatohepatitis
Figure 2.
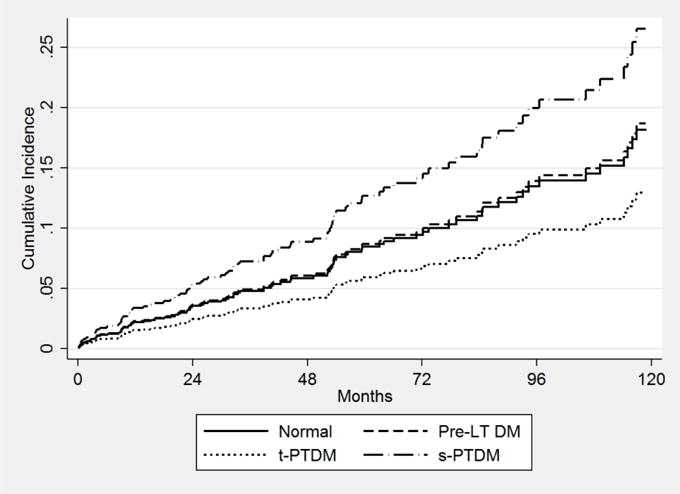
Cumulative incidence of MCE by diabetes status
MCE and Overall Mortality
During study follow up, 274 (27%) patients died, with an incidence rate of 4.6 deaths per 1000 person-years. 42/274 (15%) of deaths occurred following a MCE, with a median time to death following MCE of 0.20 months (95% CI 0.1–14.8 months). 16/42 (38%) deaths were attributed to cardiovascular disease. Cardiovascular related mortality occurred in 1/232 (0.4%) of patients who died without ever experiencing MCE (congestive heart failure). The incidence rate of death in patients who never experienced MCE was 4.1 deaths per 1000 person-years compared to 14.9 deaths per 1000 person-years in those who did experience MCE (unadjusted HR 4.13, 95% CI 2.94–5.79). In univariable analysis, DM status, African-American race, age at LT, pack-years smoked, statin use, end-stage renal disease, and acute cellular rejection (Table S4) were significantly associated with risk of death. Following multivariable Cox regression, MCE was associated with a greater than 3-fold increased risk of death (HR 3.54, 95% CI 2.22–5.63) (Figure 3). DM status did not result in significant effect modification of the association between MCE and death (p=0.17). Pre-LT DM, s-PTDM, hepatitis C, and year of LT were significantly associated with death in the multivariable model (Table S4). These results were similar to those of the multivariable model utilizing complete case analysis. The test of Schoenfeld residuals indicate that the assumption of proportional hazards was not violated (p=0.23).
Figure 3.
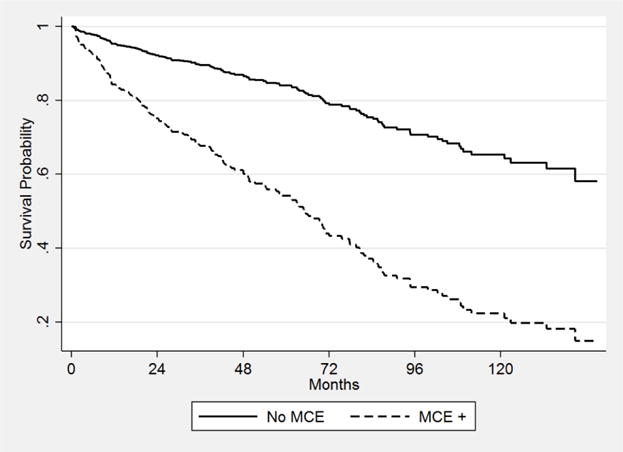
Cox adjusted survival by MCE status*
*Adjusted for age, gender, race, etiology of liver disease, pack-years, hypertension, yperlipidemia, and year of LT.
Discussion
In this cohort study, we compared the incidence of first MCE among LT recipients transplanted with pre-LT DM, t-PTDM, s-PTDM or lack of DM, accounting for all-cause mortality as a competing risk. We observed that s-PTDM was the only diabetic state associated with an increased risk of MCE. In addition, the cumulative incidence of MCE in patients with s-PTDM surpassed that of patients with pre-LT DM throughout follow-up. Furthermore, patients who experienced MCE had a greater than threefold increased risk of death, confirming the significant negative impact of MCE on survival after LT.
As demonstrated in our cohort, PTDM is a common complication following solid organ transplantation. Our findings confirm earlier data suggesting that s-PTDM and pre-LT DM are associated with diminished overall post-LT survival.(11) However, prior associations between PTDM and post-LT CVD have been inconsistent. John et al. compared transplant outcomes of 46 LT recipients with PTDM to 92 controls without PTDM. (14) PTDM patients had a greater incidence of cardiac complications. However, hypertension comprised the majority of cardiac complications in both patients with PTDM (18 of 26 reported cardiac events) and controls (20 of 24 reported cardiac events). In a more recent study, Kuo et. al, reported that pre-LT DM, but not PTDM, was associated with cardiovascular mortality.(15) The comparative risk of MCE was not reported. In this study, diabetes exposure was characterized based on data from the UNOS/OPTN database and s-PTDM could not be distinguished from t-PTDM. As a result, it is likely that the diagnosis of PTDM is less accurately recorded than pre-LT DM in UNOS/OPTN and therefore susceptible to misclassification bias which would be expected to obscure an association between PTDM and cardiovascular mortality.
The observed increased risk of MCE in patients with s-PTDM relative to those with pre-LT DM may be explained by selective screening for clinical and subclinical CVD, which patients with pre-LT DM are more likely to undergo during the pre-LT assessment. However, there may also be a pathophysiologic basis for this observation, as patients with s-PTDM may be expressing a phenotype of accelerated atherosclerosis. Previous research has demonstrated that donor peroxisome proliferator-activated receptor α (PPAR-α) polymorphisms influence recipient susceptibility to glucose and lipid disorders.(32) Such polymorphisms may also influence atherogenesis. Further research is needed to explore the possible relationship between donor PPAR-α polymorphisms, recipient atherosclerosis and risk of post-LT MCE, particularly in patients with s-PTDM; if a strong causal pathway is established, PPARα agonists such as fibrates and dual PPARα/γ agonists may be a means to significantly reduce the risk of MCE in patients with s-PTDM.
This study has several strengths. First, we had long-term follow up of nearly 1000 LT recipients. Second, use of automated data extraction techniques from the health system data warehouse allowed use of granular data elements including inpatient and outpatient encounter diagnoses, procedures codes, laboratory results, and medications prescribed. This facilitated a rigorous characterization of patient diabetes status according to the standard definition of the World Health Organization/American Diabetes Association, reducing the risk of misclassification which commonly occurs when using OPTN/UNOS data and allowing for the discrimination of t-PTDM and s-PTDM. Third, all MCE identified by the automated algorithm were adjudicated by manual chart review, allowing for performance assessment of this automated algorithm in this patient cohort. We confirmed high sensitivity and specificity of the outcome definition. Finally, by using a competing risk model to estimate the comparative risk of MCE, we minimized potential bias introduced by differential rates of death among patients of differing diabetes exposures.(25,26)
The results presented should be interpreted with several limitations in mind. As noted previously, the rate of MCE among patients with pre-LT DM may be lower than that of patients with s-PTDM due to the screening and selection processes for LT excluding those with underlying CVD from transplant candidacy. While this could be considered a form of selection bias, it does not lessen the importance of the findings that patients with s-PTDM have increased risk of CV events relative to patients without DM. Second, some MCE may have been missed, particularly if they occurred outside our health system and were not reported to our center. However, we expect the distribution of missed events is non-differential across diabetic groups and as a result, the reported effect estimate may be biased towards the null hypothesis. Most importantly, there is the possibility of unmeasured confounding related to immunosuppressive drugs. Glucocorticoids and calcineurin inhibitors, both used to prevent and treat graft rejection, are diabetogenic. Moreover, acute rejection has been shown to be associated with mortality.(15,33) While adjusting for incident ACR may account for some differences in immunosuppression dosing, data from both the PDS and OPTN/UNOS lack consistent longitudinal patient data on immunosuppression medications. Nonetheless, we do not think this biases our findings substantially because, being a single center study, single-organ LT recipients are treated with a relatively homogenous immunosuppressive regimen—combination therapy with tacrolimus and prednisone immediately following LT followed by tapering and cessation of prednisone over the ensuring three to six month period. In addition, induction is not used at our center and the decision to add a second immunosuppressive agent, such as mycophenolate mofetil or azathioprine, is individualized on the basis of renal function, prior graft rejection, and presence of immune mediated liver disease. Finally, while there was a moderate amount of missing data for four covariates, the effect estimates obtained from multivariable regression models utilizing multiple imputation did not differ significantly from those utilizing complete case analysis.
In summary, we have demonstrated that LT recipients with s-PTDM should be considered to be at the greatest risk of non-perioperative cardiovascular morbidity following liver transplantation. MCE, including cardiac arrest, myocardial infarction, stroke, and ischemic peripheral vascular disease, are associated with a greater than threefold increased risk of death. These findings indicate that cardiovascular risk stratification and risk reduction strategies should not be restricted to the pre- and early post-operative period and should continue throughout the post-transplant period, particularly in patients with acquired metabolic disease. As the prevalence of post-transplant metabolic disease increases, novel risk stratification tools incorporating post-transplant metabolic disease indicators, such as s-PTDM, are needed to predict the risk of CVD and guide pharmacologic and behavioral prevention strategies.
Supplementary Material
Table S1: ICD-9-CM Diagnostic and procedure codes for ascertainment of major cardiovascular events.
Table S2: Univariable and multivariable logistic regression results for associations with transient PTDM.
Table S3: Univariable and multivariable logistic regression results for associations with sustained PTDM.
Table S4: Univariable and multivariable cox regression results for the association with death.
Acknowledgments
This study was funded by the NIH T32-DK007740-19. This funding agency played no role in the analysis of the data or the preparation of this manuscript.
Abbreviations
- ACR
acute cellular rejection
- BMI
body mass index
- CI
confidence interval
- CVD
cardiovascular disease
- DM
diabetes mellitus
- ESRD
end-stage renal disease
- HR
hazard rate
- HCC
hepatocellular carcinoma
- HUP
Hospital of the University of Pennsylvania
- ICD-9-CM
International Classification of Disease, Ninth Revision, Clinical Modification
- IQR
interquartile ranges
- LT
liver transplant
- MELD
Model for End-Stage Liver Disease
- NAFLD
non-alcoholic fatty liver disease
- NASH
non-alcoholic steatohepatitis
- OPTN/UNOS
Organ Procurement and Transplantation Network / United Network for Organ Sharing
- OR
odds ratio
- PDS
Penn Data Store
- PPAR
peroxisome proliferator-activated receptor
- pre-LT DM
pre-transplant diabetes mellitus
- PTDM
post-transplant diabetes mellitus, SHR, subdistribution hazard ratio
- s-PTDM
sustained post-transplant diabetes mellitus
- t-PTDM
transient post-transplant diabetes mellitus
- UPHS
University of Pennsylvania Health System
Footnotes
Author Contributions
Roccaro: Study concept and design; acquisition of data; analysis and interpretation of data; drafting of manuscript; critical revision of the manuscript for important intellectual content; statistical analysis
Goldberg: Study concept and design; analysis and interpretation of data; critical revision of the manuscript for important intellectual content; study supervision
Hwang: Study concept and design; statistical analysis and interpretation of data; critical revision of the manuscript for important intellectual content
Judy: Data acquisition (PDS)
Thomasson: Data acquisition (OPTN/UNOS)
Kimmel: Study concept and design; critical revision of the manuscript for important intellectual content
Forde: Study concept and design; critical revision of the manuscript for important intellectual content
Lewis: Study concept and design; critical revision of the manuscript for important intellectual content
Yang: Study concept and design; analysis and interpretation of data; drafting of manuscript; critical revision of the manuscript for important intellectual content; study supervision
Disclosure
The authors of this manuscript have conflicts of interest to disclose as described by the American Journal of Transplantation. Dr. Kimmel has consulted for Pfizer, Merck, and Bayer, all unrelated to the contents of this paper. The other authors have no conflicts of interest to disclose.
Supporting Information
Additional Supporting Information may be found in the online version of this article.
References
- 1.Kim WR, Lake JR, Smith JM, Skeans MA, Schladt DP, Edwards EB, et al. OPTN/SRTR 2015 Annual Data Report: Liver. Am J Transplant. 2017 Jan;17(Suppl 1):174–251. doi: 10.1111/ajt.14126. [DOI] [PubMed] [Google Scholar]
- 2.Lodhi SA, Lamb KE, Meier-Kriesche HU. Solid Organ Allograft Survival Improvement in the United States: The Long-Term Does Not Mirror the Dramatic Short-Term Success. American Journal of Transplantation. 2011;11(6):1226–1235. doi: 10.1111/j.1600-6143.2011.03539.x. [DOI] [PubMed] [Google Scholar]
- 3.Daniel KE, Eickhoff J, Lucey MR. Why do patients die after a liver transplantation? Clin Transplant. 2016 Dec;:31. doi: 10.1111/ctr.12906. [DOI] [PubMed] [Google Scholar]
- 4.Luca L, Westbrook R, Tsochatzis EA. Metabolic and cardiovascular complications in the liver transplant recipient. Ann Gastroenterol. 2015 Apr-Jun;28(2):183–192. [PMC free article] [PubMed] [Google Scholar]
- 5.VanWagner LB, Serper M, Kang R, Levitsky J, Hohmann S, Abecassis M, et al. Factors Associated With Major Adverse Cardiovascular Events After Liver Transplantation Among a National Sample. Am J Transplant. 2016 Sep;16(9):2684–2694. doi: 10.1111/ajt.13779. [DOI] [PMC free article] [PubMed] [Google Scholar]
- 6.VanWagner LB, Lapin B, Levitsky J, Wilkins JT, Abecassis MM, Skaro AI, et al. High early cardiovascular mortality after liver transplantation. Liver Transpl. 2014 Nov;20(11):1306–1316. doi: 10.1002/lt.23950. [DOI] [PMC free article] [PubMed] [Google Scholar]
- 7.Johnston SD, Morris JK, Cramb R, Gunson BK, Neuberger J. Cardiovascular morbidity and mortality after orthotopic liver transplantation. Transplantation. 2002 Mar 27;73(6):901–906. doi: 10.1097/00007890-200203270-00012. [DOI] [PubMed] [Google Scholar]
- 8.Honda M, Asonuma K, Hayashida S, Suda H, Ohya Y, Lee KJ, et al. Incidence and risk factors for new-onset diabetes in living-donor liver transplant recipients. Clin Transplant. 2013 May-Jun;27(3):426–435. doi: 10.1111/ctr.12103. [DOI] [PubMed] [Google Scholar]
- 9.Sharif A, Cohney S. Post-transplantation diabetes-state of the art. Lancet Diabetes Endocrinol. 2016 Apr;4(4):337–349. doi: 10.1016/S2213-8587(15)00387-3. [DOI] [PubMed] [Google Scholar]
- 10.Heisel O, Heisel R, Balshaw R, Keown P. New onset diabetes mellitus in patients receiving calcineurin inhibitors: a systematic review and meta-analysis. Am J Transplant. 2004 Apr;4(4):583–595. doi: 10.1046/j.1600-6143.2003.00372.x. [DOI] [PubMed] [Google Scholar]
- 11.Moon JI, Barbeito R, Faradji RN, Gaynor JJ, Tzakis AG. Negative impact of new-onset diabetes mellitus on patient and graft survival after liver transplantation: Long-term follow up. Transplantation. 2006 Dec 27;82(12):1625–1628. doi: 10.1097/01.tp.0000250361.60415.96. [DOI] [PubMed] [Google Scholar]
- 12.Baid S, Cosimi AB, Farrell ML, Schoenfeld DA, Feng S, Chung RT, et al. Posttransplant diabetes mellitus in liver transplant recipients: risk factors, temporal relationship with hepatitis C virus allograft hepatitis, and impact on mortality. Transplantation. 2001 Sep 27;72(6):1066–1072. doi: 10.1097/00007890-200109270-00015. [DOI] [PubMed] [Google Scholar]
- 13.Albeldawi M, Aggarwal A, Madhwal S, Cywinski J, Lopez R, Eghtesad B, et al. Cumulative risk of cardiovascular events after orthotopic liver transplantation. Liver Transpl. 2012 Mar;18(3):370–375. doi: 10.1002/lt.22468. [DOI] [PubMed] [Google Scholar]
- 14.John PR, Thuluvath PJ. Outcome of patients with new-onset diabetes mellitus after liver transplantation compared with those without diabetes mellitus. Liver Transplantation. 2002;8(8):708–713. doi: 10.1053/jlts.2002.34638. [DOI] [PubMed] [Google Scholar]
- 15.Kuo HT, Lum E, Martin P, Bunnapradist S. Effect of diabetes and acute rejection on liver transplant outcomes: An analysis of the organ procurement and transplantation network/united network for organ sharing database. Liver Transpl. 2016 Jun;22(6):796–804. doi: 10.1002/lt.24414. [DOI] [PubMed] [Google Scholar]
- 16.American Diabetes Association. Diagnosis and classification of diabetes mellitus. Diabetes Care. 2010 Jan;33(Suppl 1):S62–9. doi: 10.2337/dc10-S062. [DOI] [PMC free article] [PubMed] [Google Scholar]
- 17.VanderWeele TJ, Shpitser I. A new criterion for confounder selection. Biometrics. 2011 Dec;67(4):1406–1413. doi: 10.1111/j.1541-0420.2011.01619.x. [DOI] [PMC free article] [PubMed] [Google Scholar]
- 18.Petersen LA, Wright S, Normand SL, Daley J. Positive predictive value of the diagnosis of acute myocardial infarction in an administrative database. J Gen Intern Med. 1999 Sep;14(9):555–558. doi: 10.1046/j.1525-1497.1999.10198.x. [DOI] [PMC free article] [PubMed] [Google Scholar]
- 19.Kiyota Y, Schneeweiss S, Glynn RJ, Cannuscio CC, Avorn J, Solomon DH. Accuracy of Medicare claims-based diagnosis of acute myocardial infarction: estimating positive predictive value on the basis of review of hospital records. Am Heart J. 2004 Jul;148(1):99–104. doi: 10.1016/j.ahj.2004.02.013. [DOI] [PubMed] [Google Scholar]
- 20.Olson KL, Wood MD, Delate T, Lash LJ, Rasmussen J, Denham AM, et al. Positive predictive values of ICD-9 codes to identify patients with stroke or TIA. Am J Manag Care. 2014 Feb 1;20(2):e27–34. [PubMed] [Google Scholar]
- 21.De Bruin ML, van Hemel NM, Leufkens HG, Hoes AW. Hospital discharge diagnoses of ventricular arrhythmias and cardiac arrest were useful for epidemiologic research. J Clin Epidemiol. 2005 Dec;58(12):1325–1329. doi: 10.1016/j.jclinepi.2005.04.009. [DOI] [PubMed] [Google Scholar]
- 22.Mell MW, Pettinger M, Proulx-Burns L, Heckbert SR, Allison MA, Criqui MH, et al. Evaluation of Medicare claims data to ascertain peripheral vascular events in the Women’s Health Initiative. J Vasc Surg. 2014 Jul;60(1):98–105. doi: 10.1016/j.jvs.2014.01.056. [DOI] [PubMed] [Google Scholar]
- 23.Cuzick JA. Wilcoxon-type test for trend. Stat Med. 1985 Jan-Mar;4(1):87–90. doi: 10.1002/sim.4780040112. [DOI] [PubMed] [Google Scholar]
- 24.Fine JP, Gray RJ. A Proportional Hazards Model for the Subdistribution of a Competing Risk. Journal of the American Statistical Association. 1999 Jun 01;94(446):496–509. [Google Scholar]
- 25.Jepsen P, Vilstrup H, Andersen PK. The clinical course of cirrhosis: The importance of multistate models and competing risks analysis. Hepatology. 2015 Jul;62(1):292–302. doi: 10.1002/hep.27598. [DOI] [PubMed] [Google Scholar]
- 26.Noordzij M, Leffondre K, van Stralen KJ, Zoccali C, Dekker FW, Jager KJ. When do we need competing risks methods for survival analysis in nephrology? Nephrol Dial Transplant. 2013 Nov;28(11):2670–2677. doi: 10.1093/ndt/gft355. [DOI] [PubMed] [Google Scholar]
- 27.Maldonado G, Greenland S. Simulation study of confounder-selection strategies. Am J Epidemiol. 1993 Dec 1;138(11):923–936. doi: 10.1093/oxfordjournals.aje.a116813. [DOI] [PubMed] [Google Scholar]
- 28.Mickey RM, Greenland S. The impact of confounder selection criteria on effect estimation. Am J Epidemiol. 1989 Jan;129(1):125–137. doi: 10.1093/oxfordjournals.aje.a115101. [DOI] [PubMed] [Google Scholar]
- 29.Raghunathan TE, Lepkowski JM, Van Hoewyk J, Solenberger P. A multivariate technique for multiply imputing missing values using a sequence of regression models. Survey methodology. 2001;27(1):85–96. [Google Scholar]
- 30.Morris TP, White IR, Royston P. Tuning multiple imputation by predictive mean matching and local residual draws. BMC Med Res Methodol. 2014 Jun 5;14 doi: 10.1186/1471-2288-14-75. 75-2288-14-75. [DOI] [PMC free article] [PubMed] [Google Scholar]
- 31.Rodwell L, Lee KJ, Romaniuk H, Carlin JB. Comparison of methods for imputing limited-range variables: a simulation study. BMC Med Res Methodol. 2014 Apr 26;14 doi: 10.1186/1471-2288-14-57. 57-2288-14-57. [DOI] [PMC free article] [PubMed] [Google Scholar]
- 32.Ling Q, Xu X, Wang K, Wang C, Xiang P, Zhang X, et al. Donor PPARalpha Gene Polymorphisms Influence the Susceptibility to Glucose and Lipid Disorders in Liver Transplant Recipients: A Strobe-Compliant Observational Study. Medicine (Baltimore) 2015 Sep;94(35):e1421. doi: 10.1097/MD.0000000000001421. [DOI] [PMC free article] [PubMed] [Google Scholar]
- 33.Levitsky J, Goldberg D, Smith AR, Mansfield SA, Gillespie BW, Merion RM, et al. Acute Rejection Increases Risk of Graft Failure and Death in Recent Liver Transplant Recipients. Clin Gastroenterol Hepatol. 2016 Aug 25; doi: 10.1016/j.cgh.2016.07.035. [DOI] [PMC free article] [PubMed] [Google Scholar]
Associated Data
This section collects any data citations, data availability statements, or supplementary materials included in this article.
Supplementary Materials
Table S1: ICD-9-CM Diagnostic and procedure codes for ascertainment of major cardiovascular events.
Table S2: Univariable and multivariable logistic regression results for associations with transient PTDM.
Table S3: Univariable and multivariable logistic regression results for associations with sustained PTDM.
Table S4: Univariable and multivariable cox regression results for the association with death.