

Abstract
Genome-wide association studies (GWAS) of cancer have identified more than 700 risk loci, of which ~80% of were first discovered in European ancestry populations, ~15% in East Asians, 3% in multiethnic scans, and less than 1% in African and Latin American populations. These percentages closely mirror the distribution of samples included in the discovery phase of cancer GWAS to date (84% European, 11% East Asian, 4% African and 1% Latin American ancestry). GWAS in non-European populations have provided insight into ancestry-specific variation in cancer and have pointed to regions of susceptibility that are of particular importance in certain populations. Uncovering and characterizing cancer risk loci in diverse populations is critical for understanding underlying biological mechanisms and for the future development of genetic risk prediction models in non-European ancestry populations. New GWAS and continued collaborations will be required to eliminate population inequalities in the number of studies, sample sizes, and variant content on GWAS arrays, and to better align genetic research in cancer to the racial/ethnic distribution of the global population.
Keywords: GWAS, cancer, East Asians, African Americans, Latinos
Introduction
Genome-wide association studies (GWAS) have been successful in identifying more than 700 risk loci for cancer. The success of GWAS has been the result of rapid technological advances in highly dense genotyping arrays, with contemporary arrays capturing (indirectly) over 10 million common variants through enhanced resources of publicly available genetic information such as the 1000 Genomes Project; analytic methods for large-scale imputation; large sample collections; and international collaborations and consortia, enabling meta-analyses of GWAS of over tens of thousands of individuals.(1) Despite the large number of individuals included in GWAS, these studies have remained largely centered on individuals of European ancestry. There has been growing recognition of the inadequate representation of diverse racial/ethnic populations in GWAS with concern regarding the translational impact of GWAS findings on populations globally.(2, 3) For instance, a recently developed complex trait coalescent-based simulation framework showed that the prediction accuracy of GWAS-identified polygenetic risk scores was highly dependent on the genetic similarity to the discovery population(3). Extensive genetic diversity exists across populations and a substantial fraction of genetic variants are not being examined in GWAS of non-European ancestry populations.
There are stark differences in the burden of certain cancers across racial/ethnic populations. For instance, African American men have roughly a 67% higher incidence rate of prostate cancer than European American men.(4) Also, Asian/Pacific Islander men and women experience a 70% and 95% higher incidence rate of liver cancer, respectively, than European American men and women.(4) These differences in the burden of cancer across racial/ethnic groups have been attributed to an interplay of genetic, environmental, and social factors. There is growing evidence of population-specific variation that may contribute to racial/ethnic differences in the risk of cancer and cancer-related phenotypes. This is seen with the risk alleles at 8q24 and the higher burden of prostate cancer in African Americans (5, 6) and the missense variant in CREBRF and high prevalence of obesity in Samoans.(7)
Here, we describe the novel findings from GWAS of cancer in non-European ancestry populations that have contributed to our understanding of cancer susceptibility. We also highlight the inequality in the availability of cancer GWAS data for non-European versus European ancestry populations, and discuss the next steps needed to further our understanding of cancer susceptibility across all racial/ethnic populations, and the scientific and public health gains in studying diverse groups.
Materials and Methods
We compiled a list of GWAS-discovered cancer risk loci in populations of non-European ancestry, using several approaches. First, we queried the NHGRI-EBI GWAS Catalog (http://www.ebi.ac.uk/gwas/) for all cancer risk loci. Second, we searched Pubmed for GWAS of each cancer site (using terms ‘GWAS’, ‘genome-wide association study’, and cancer site) and reviewed the published reports. We included reports published through December 15, 2016, as well as summary information from OncoArray-GWAS of the most common cancers in the U19 GAME-ON Consortium.(8) For this review, cancer risk loci were those first discovered though GWAS that included non-European ancestry samples in the discovery stage and met genome-wide statistical significance (p≤5×10⁻⁸). If multiple correlated variants were reported in a region, only the most statistically significant signal was included. In risk regions previously identified from GWAS in European populations, independent signals in non-European ancestry populations were determined through review of the literature (e.g. where investigators reported conditional analyses with the index risk variants and/or by evaluating the correlations between risk variants using data from HapMap or the 1000 Genomes Project). In the cancer site-specific sections below, we describe the scans conducted in non-European ancestry populations as well as the novel cancer risk loci that were discovered. A list of these risk loci as well as minor allele frequencies (minor allele as defined by the global population) are provided in Table 1. We also present discoveries from GWAS that included a multiethnic discovery stage; in most cases the non-European ancestry sample represented a small fraction (<10%) of the overall sample. For each cancer site, we also provide a summary (Figure 1) of the total number of cases included in the discovery stage for four main population groups: African, East Asian, Latin American, and European ancestry. Every attempt was made to include all GWAS in each population, however, due to the large number of GWAS conducted in European ancestry populations, it is possible that some were missed; thus, the number of European ancestry cases is likely to be underestimated compared to the other groups.
Table 1.
Cancer risk loci identified in GWAS in populations of non-European ancestry
| Minor allele frequencya | Discovery findingsb | |||||||||||
|---|---|---|---|---|---|---|---|---|---|---|---|---|
| Site | Chr | SNP ID | Minor Allele | Global | African Ancestry | Latin American Ancestry | East Asian Ancestry | European Ancestry | Discovery Populationb | OR | P-value | Reference |
| Prostate | ||||||||||||
| 1q32.1 | rs1775148 | T | 0.49 | 0.30 | 0.43 | 0.51 | 0.64 | ME | 1.06 | 3.80E-08 | (9) | |
| 3p11.2 | rs2055109 | C | 0.15 | 0.13 | 0.14 | 0.07 | 0.23 | EA | 1.2 | 3.90E-08 | (14) | |
| 5p15.33 | rs12653946 | T | 0.44 | 0.40 | 0.50 | 0.35 | 0.45 | EA | 1.26 | 3.90E-18 | (13) | |
| 6q14.1 | rs9443189 | G | 0.33 | 0.59 | 0.14 | 0.38 | 0.14 | ME | 1.08 | 3.90E-08 | (9) | |
| 6q22.1 | rs339331 | C | 0.32 | 0.24 | 0.26 | 0.40 | 0.31 | EA | 1.22 | 1.60E-12 | (13) | |
| 6q25.3 | rs4646284 | TG | 0.30 | 0.39 | 0.26 | 0.30 | 0.28 | ME | 1.16 | 5.40E-12 | (18) | |
| 8q24.21 | rs111906932 | A | 0.01 | 0.03 | 0.00 | 0.00 | 0.00 | AFR | 1.79 | 1.39E-13 | (5) | |
| 8q24.21 | rs114798100 | G | 0.01 | 0.05 | 0.00 | 0.00 | 0.00 | AFR | 2.31 | 2.38E-40 | (5) | |
| 9q31.2 | rs817826 | C | 0.20 | 0.35 | 0.11 | 0.12 | 0.14 | EA | 1.41 | 5.50E-14 | (15) | |
| 10q26.12 | rs2252004 | A | 0.35 | 0.59 | 0.30 | 0.32 | 0.09 | EA | 1.16 | 2.00E-08 | (14) | |
| 11p15.4 | rs12791447 | G | 0.10 | 0.01 | 0.20 | 0.12 | 0.06 | EA | 1.23 | 3.60E-08 | (16) | |
| 11q12.1 | rs1938781 | G | 0.28 | 0.39 | 0.25 | 0.29 | 0.20 | EA | 1.16 | 1.10E-10 | (14) | |
| 13q22.1 | rs9600079 | T | 0.46 | 0.52 | 0.38 | 0.45 | 0.47 | EA | 1.18 | 2.80E-09 | (13) | |
| 14q23.2 | rs58262369 | T | 0.05 | 0.06 | 0.08 | 0.08 | 0.00 | EA | 1.28 | 6.10E-10 | (16) | |
| 14q23.1 | rs7153648 | C | 0.24 | 0.39 | 0.12 | 0.18 | 0.08 | ME | 1.11 | 2.00E-09 | (9) | |
| 16q22.2 | rs12051443 | A | 0.41 | 0.25 | 0.52 | 0.73 | 0.33 | ME | 1.06 | 3.00E-08 | (9) | |
| 17q21.33 | rs7210100 | A | 0.02 | 0.06 | 0.00 | 0.00 | 0.00 | AFR | 1.51 | 3.40E-13 | (11) | |
| 19q13.42 | rs103294 | T | 0.22 | 0.07 | 0.24 | 0.51 | 0.18 | EA | 1.28 | 5.30E-16 | (15) | |
| 20q13.13 | rs12480328 | C | 0.10 | 0.16 | 0.06 | 0.09 | 0.07 | ME | 1.13 | 4.60E-11 | (9) | |
| 21q22.3 | rs1041449 | G | 0.34 | 0.39 | 0.49 | 0.20 | 0.41 | ME | 1.06 | 2.80E-08 | (9) | |
| 22q11.21 | rs2238776 | A | 0.21 | 0.02 | 0.27 | 0.43 | 0.20 | ME | 1.08 | 1.80E-08 | (9) | |
| Breast | ||||||||||||
| 1p22.3 | rs12118297 | T | 0.23 | 0.22 | 0.13 | 0.27 | 0.20 | EA | 1.1 | 4.50E-08 | (29) | |
| 1q32.1 | rs4951011 | G | 0.20 | 0.05 | 0.33 | 0.31 | 0.15 | EA | 1.09 | 8.80E-09 | (28) | |
| 2q34 | rs13393577 | C | 0.11 | 0.15 | 0.09 | 0.04 | 0.10 | EA | 1.53 | 8.80E-14 | (24) | |
| 3q26.31 | rs13074711 | C | 0.18 | 0.39 | 0.10 | 0.14 | 0.11 | AFR | 1.29 | 1.80E-08 | (31) | |
| 5q14.3 | rs10474352 | T | 0.34 | 0.39 | 0.19 | 0.49 | 0.14 | EA | 1.09 | 1.67E-09 | (28) | |
| 5p15.33 | rs10069690 | T | 0.35 | 0.66 | 0.22 | 0.17 | 0.28 | ME | 1.18 | 1.00E-10 | (32) | |
| 6q14.1 | rs17530068 | C | 0.18 | 0.04 | 0.24 | 0.25 | 0.23 | ME | 1.12 | 1.10E-09 | (35) | |
| 6q25.1 | rs140068132 | G | 0.02 | 0.00 | 0.12 | 0.00 | 0.00 | LA | 1.67 | 9.00E-18 | (34) | |
| 6q25.1 | rs2046210 | A | 0.41 | 0.66 | 0.27 | 0.36 | 0.32 | EA | 1.29 | 2.00E-15 | (26) | |
| 6q25.1 | rs9485372 | A | 0.24 | 0.20 | 0.19 | 0.42 | 0.16 | EA | 1.11 | 3.80E-12 | (27) | |
| 10q21.2 | rs10822013 | T | 0.42 | 0.18 | 0.52 | 0.50 | 0.50 | EA | 1.1 | 5.90E-09 | (144) | |
| 15q26.1 | rs2290203 | A | 0.38 | 0.44 | 0.30 | 0.51 | 0.21 | EA | 1.08 | 4.25E-08 | (28) | |
| 20q11.22 | rs2284378 | T | 0.20 | 0.13 | 0.35 | 0.17 | 0.29 | ME | 1.16 | 1.10E-08 | (35) | |
| 21q22.12 | rs16992204 | C | 0.05 | 0.06 | 0.02 | 0.14 | 0.00 | EA | 1.13 | 4.60E-08 | (29) | |
| 22q13.1 | APOBEC3 deletion | 0.00 | 0.00 | 0.00 | 0.31 | 0.10 | EA | 1.35 | 9.60E-22 | (25), (145) | ||
| Colorectal | ||||||||||||
| 5q23.3 | rs12522693 | A | 0.11 | 0.03 | 0.10 | 0.14 | 0.15 | EA | 1.31 | 2.08E-08 | (47) | |
| 5q31.1 | rs647161 | C | 0.46 | 0.48 | 0.37 | 0.70 | 0.34 | EA | 1.11 | 1.22E–10 | (45) | |
| 6p21.1 | rs4711689 | G | 0.23 | 0.06 | 0.29 | 0.20 | 0.46 | EA | 1.11 | 3.92E-08 | (46) | |
| 8q23.3 | rs2450115 | C | 0.26 | 0.18 | 0.25 | 0.46 | 0.19 | EA | 1.12 | 1.24E-12 | (46) | |
| 8q23.3 | rs6469656 | G | 0.19 | 0.17 | 0.21 | 0.33 | 0.11 | EA | 1.11 | 2.03E-12 | (46) | |
| 10q24.32 | rs4919687 | A | 0.19 | 0.11 | 0.20 | 0.25 | 0.30 | EA | 1.14 | 7.82E-12 | (46) | |
| 10q25.2 | rs12241008 | C | 0.19 | 0.21 | 0.07 | 0.30 | 0.10 | ME | 1.13 | 1.40E-09 | (44) | |
| 10q25.2 | rs11196172 | A | 0.26 | 0.05 | 0.16 | 0.65 | 0.12 | EA | 1.14 | 1.04E–12 | (38) | |
| 10q22.3 | rs704017 | G | 0.45 | 0.56 | 0.38 | 0.28 | 0.56 | EA | 1.1 | 2.07E–8 | (38) | |
| 11q12.2 | rs174537 | T | 0.30 | 0.02 | 0.59 | 0.57 | 0.35 | EA | 1.16 | 9.22E–21 | (38) | |
| 12p13.31 | rs10849432 | C | 0.17 | 0.30 | 0.20 | 0.19 | 0.10 | EA | 1.14 | 5.81E–10 | (38) | |
| 12p13.31 | rs11064437 | T | 0.16 | 0.31 | 0.11 | 0.28 | 0.01 | EA | 1.12 | 4.48E-11 | (46) | |
| 12p13.32 | rs10774214 | T | 0.45 | 0.66 | 0.46 | 0.32 | 0.38 | EA | 1.09 | 3.06E–8 | (45) | |
| 17p13.3 | rs12603526 | C | 0.05 | 0.00 | 0.02 | 0.20 | 0.01 | EA | 1.1 | 3.42E–8 | (38) | |
| 17q12 | rs17836917 | A | 0.05 | 0.01 | 0.07 | 0.11 | 0.02 | EA | 0.75 | 4.55E–8 | (47) | |
| 18q21.1 | rs7229639 | A | 0.13 | 0.21 | 0.11 | 0.13 | 0.10 | EA | 1.22 | 2.93E-11 | (42) | |
| 19q13.2 | rs1800469 | A | 0.37 | 0.22 | 0.46 | 0.55 | 0.31 | EA | 1.09 | 1.17E–8 | (38) | |
| 20p12.3 | rs2423279 | C | 0.36 | 0.39 | 0.29 | 0.33 | 0.27 | EA | 1.1 | 6.64E–9 | (45) | |
| Lung | ||||||||||||
| 3q28 | rs4488809 | C | 0.42 | 0.28 | 0.36 | 0.52 | 0.49 | EA | 1.26 | 7.00E-26 | (58) | |
| 3q28 | rs10937405 | T | 0.32 | 0.27 | 0.29 | 0.31 | 0.43 | EA | 1.31 | 7.26E-12 | (58) | |
| 3q29 | rs2131877 | A | 0.30 | 0.21 | 0.25 | 0.57 | 0.19 | EA | 1.3 | 2.00E-08 | (146) | |
| 5p15.33 | rs465498 | G | 0.36 | 0.59 | 0.31 | 0.19 | 0.44 | EA | 1.33 | 1.20E-20 | (59) | |
| 5p15.33 | rs2736100 | C | 0.48 | 0.47 | 0.43 | 0.41 | 0.50 | EA | 1.27 | 2.91E-11 | (58) | |
| 6p21.32 | rs3817963 | C | 0.26 | 0.17 | 0.33 | 0.23 | 0.28 | EA | 1.18 | 2.70E-10 | (56) | |
| 6p21.32 | rs2395185 | T | 0.29 | 0.19 | 0.41 | 0.31 | 0.32 | EA | 1.17 | 1.00E-08 | (62) | |
| 6q22.1 | rs9387478 | C | 0.36 | 0.10 | 0.56 | 0.50 | 0.50 | EA | 1.18 | 4.00E-10 | (62) | |
| 9p21.3 | rs72658409 | T | 0.13 | 0.19 | 0.05 | 0.08 | 0.07 | EA | 0.77 | 1.41E–10 | (61) | |
| 10q25.2 | rs7086803 | A | 0.26 | 0.64 | 0.16 | 0.29 | 0.03 | EA | 1.28 | 4.00E-18 | (62) | |
| 12q13.13 | rs11610143 | G | 0.22 | 0.04 | 0.52 | 0.28 | 0.21 | EA | 0.89 | 4.96E–9 | (61) | |
| 12q23.1 | rs12296850 | G | 0.14 | 0.11 | 0.07 | 0.26 | 0.06 | EA | 1.28 | 1.19E-10 | (60) | |
| 13q12.12 | rs753955 | G | 0.44 | 0.14 | 0.57 | 0.34 | 0.63 | EA | 1.18 | 2.00E-12 | (59) | |
| 17q24.2 | rs7216064 | A | 0.32 | 0.18 | 0.27 | 0.69 | 0.21 | EA | 1.2 | 7.40E-11 | (56) | |
| 22q12.2 | rs17728461 | G | 0.22 | 0.07 | 0.26 | 0.19 | 0.32 | EA | 1.2 | 1.10E-11 | (59) | |
| 22q12.2 | rs36600 | T | 0.18 | 0.09 | 0.30 | 0.09 | 0.27 | EA | 1.29 | 6.00E-13 | (59) | |
| Ovarian | ||||||||||||
| 9q22.33 | rs1413299 | G | 0.42 | 0.27 | 0.47 | 0.41 | 0.60 | EA | 1.2 | 1.88E–8 | (64) | |
| 10p11.21 | rs1192691 | G | 0.24 | 0.14 | 0.11 | 0.61 | 0.08 | EA | 1.23 | 2.62E–8 | (64) | |
| Cervical | ||||||||||||
| 4q12 | rs13117307 | T | 0.15 | 0.12 | 0.12 | 0.10 | 0.26 | EA | 1.26 | 9.69E-09 | (72) | |
| 17q12 | rs8067378 | G | 0.43 | 0.56 | 0.41 | 0.28 | 0.51 | EA | 1.18 | 2.00E-08 | (72) | |
| Bladder | ||||||||||||
| 5q12.3 | rs2042329 | T | 0.34 | 0.56 | 0.41 | 0.10 | 0.41 | EA | 1.4 | 4.61E-11 | (73) | |
| 15q24.1 | rs11543198 | A | 0.14 | 0.04 | 0.36 | 0.25 | 0.03 | EA | 1.14 | 4.03E–9 | (74) | |
| Hepatocellular | ||||||||||||
| 1p36.22 | rs17401966 | G | 0.23 | 0.06 | 0.32 | 0.29 | 0.31 | EA | 1.64 | 2.00E-18 | (80) | |
| 2q32.3 | rs7574865 | T | 0.26 | 0.12 | 0.36 | 0.35 | 0.23 | EA | 1.21 | 2.00E-10 | (81) | |
| 6p21.32 | rs9275572 | A | 0.34 | 0.40 | 0.31 | 0.25 | 0.40 | EA | 1.3 | 6.00E-09 | (83) | |
| 6p21.32 | rs9275319 | G | 0.15 | 0.11 | 0.29 | 0.13 | 0.16 | EA | 1.49 | 3.00E-17 | (81) | |
| 6p21.32 | rs9272105 | G | 0.48 | 0.42 | 0.47 | 0.53 | 0.45 | EA | 1.28 | 5.00E-22 | (82) | |
| 6p21.33 | rs2596542 | T | 0.42 | 0.54 | 0.52 | 0.27 | 0.40 | EA | 1.39 | 4.00E-13 | (83) | |
| 21q21.3 | rs455804 | A | 0.29 | 0.42 | 0.23 | 0.31 | 0.24 | EA | 1.19 | 5.00E-10 | (82) | |
| Gastric | ||||||||||||
| 1q22 | rs4072037 | C | 0.37 | 0.40 | 0.29 | 0.24 | 0.45 | EA | 1.33 | 4.00E-07 | (85) | |
| 1q22 | rs80142782 | C | 0.03 | 0.00 | 0.00 | 0.13 | 0.00 | EA | 1.61 | 2.00E-19 | (90) | |
| 3q13.31 | rs9841504 | G | 0.19 | 0.33 | 0.18 | 0.15 | 0.07 | EA | 1.32 | 2.00E-09 | (84) | |
| 5p13.1 | rs13361707 | T | 0.36 | 0.36 | 0.25 | 0.55 | 0.29 | EA | 1.41 | 8.00E-29 | (84) | |
| 5q14.3 | rs7712641 | T | 0.45 | 0.67 | 0.45 | 0.46 | 0.36 | EA | 1.19 | 1.00E-11 | (90) | |
| 6p21.1 | rs2294693 | C | 0.29 | 0.34 | 0.26 | 0.27 | 0.18 | EA | 1.14 | 7.00E-08 | (88) | |
| 6p21.1 | rs2494938 | A | 0.48 | 0.56 | 0.38 | 0.27 | 0.52 | EA | 1.18 | 5.00E-09 | (89) | |
| 8q24.3 | rs2976392 | A | 0.41 | 0.37 | 0.51 | 0.34 | 0.45 | EA | 1.62 | 1.11E-09 | (86) | |
| 10q23.33 | rs2274223 | G | 0.30 | 0.38 | 0.21 | 0.24 | 0.34 | EA | 1.31 | 8.40E-09 | (85) | |
| Pancreatic | ||||||||||||
| 5p13.1 | rs2255280 | C | 0.10 | 0.00 | 0.10 | 0.40 | 0.00 | EA | 1.23 | 4.00E-10 | (93) | |
| 10q26.11 | rs12413624 | A | 0.30 | 0.10 | 0.41 | 0.37 | 0.43 | EA | 1.23 | 5.00E-11 | (93) | |
| 21q21.3 | rs372883 | T | 0.43 | 0.37 | 0.46 | 0.54 | 0.49 | EA | 1.27 | 2.00E-13 | (93) | |
| 21q22.3 | rs1547374 | G | 0.36 | 0.36 | 0.34 | 0.46 | 0.31 | EA | 1.27 | 4.00E-13 | (93) | |
| 22q13.32 | rs5768709 | G | 0.31 | 0.31 | 0.25 | 0.23 | 0.39 | EA | 1.25 | 1.00E-10 | (93) | |
| Esophageal | ||||||||||||
| 2q33.1 | rs13016963 | A | 0.36 | 0.42 | 0.51 | 0.31 | 0.38 | EA | 1.29 | 7.63E-10 | (100) | |
| 4q23 | rs1229984 | T | 0.16 | 0.00 | 0.06 | 0.70 | 0.03 | EA | 1.79 | 8.00E-24 | (96) | |
| 5q31.2 | rs7447927 | G | 0.43 | 0.08 | 0.51 | 0.38 | 0.69 | EA | 1.18 | 8.00E-20 | (99) | |
| 5q11.2 | rs10052657 | A | 0.15 | 0.11 | 0.19 | 0.13 | 0.17 | EA | 1.49 | 2.00E-19 | (97) | |
| 6p21.1 | rs10484761 | C | 0.27 | 0.48 | 0.24 | 0.13 | 0.24 | EA | 1.33 | 7.00E-12 | (97) | |
| 10q23.33 | rs2274223 | G | 0.30 | 0.38 | 0.21 | 0.24 | 0.34 | EA | 1.47 | 2.81E-09 | (98) | |
| 10q23.33 | rs3765524 | T | 0.31 | 0.46 | 0.21 | 0.24 | 0.31 | EA | 1.35 | 2.00E-09 | (85) | |
| 12q24.12 | rs671 | A | 0.04 | 0.00 | 0.00 | 0.17 | 0.00 | EA | 1.67 | 3.00E-24 | (96) | |
| 12q24.13 | rs2074356 | A | 0.03 | 0.00 | 0.00 | 0.13 | 0.00 | EA | 1.56 | 2.00E-31 | (97) | |
| 16q12.1 | rs4785204 | T | 0.13 | 0.10 | 0.10 | 0.26 | 0.07 | EA | 1.24 | 2.00E-20 | (99) | |
| 17p13.1 | rs1642764 | T | 0.42 | 0.24 | 0.47 | 0.59 | 0.52 | EA | 1.14 | 3.00E-13 | (99) | |
| 21q22.12 | rs2014300 | A | 0.26 | 0.55 | 0.29 | 0.12 | 0.15 | EA | 1.43 | 8.00E-22 | (97) | |
| 22q12 | rs738722 | T | 0.30 | 0.45 | 0.34 | 0.23 | 0.29 | EA | 1.3 | 1.00E-08 | (85) | |
| Oral and/or Oropharynx | ||||||||||||
| 4q23 | rs1229984 | T | 0.16 | 0.00 | 0.06 | 0.70 | 0.03 | ME | 0.56 | 2.29E-15 | (101) | |
| 6p21.32 | rs3828805 | T | 0.18 | 0.27 | 0.14 | 0.11 | 0.22 | ME | 1.28 | 3.35E-13 | (101) | |
| 10q26.13 | rs201982221d | A | ME | 1.67 | 1.58E-09 | (101) | ||||||
| 11p15.4 | rs1453414 | C | 0.13 | 0.04 | 0.12 | 0.23 | 0.11 | ME | 1.19 | 4.78E-08 | (101) | |
| 2p23.3 | rs6547741 | G | 0.38 | 0.47 | 0.32 | 0.09 | 0.50 | ME | 0.83 | 3.97E-08 | (101) | |
| 5p15.33 | rs10462706 | T | 0.20 | 0.01 | 0.31 | 0.40 | 0.15 | ME | 0.74 | 5.54 E-10 | (101) | |
| 9p21.3 | rs8181047 | A | 0.15 | 0.01 | 0.14 | 0.11 | 0.31 | ME | 1.24 | 3.8 E-9 | (101) | |
| 9q34.12 | rs928674 | G | 0.17 | 0.22 | 0.09 | 0.15 | 0.14 | ME | 1.33 | 2.09E-08 | (101) | |
| Nasopharyngeal | ||||||||||||
| 3p22.2 | rs189897 | A | 0.10 | 0.01 | 0.15 | 0.06 | 0.18 | EA | 3.18 | 6.85E-08 | (105) | |
| 3q26.2 | rs6774494 | A | 0.48 | 0.63 | 0.56 | 0.60 | 0.32 | EA | 0.84 | 1.34E–8 | (103) | |
| 5p15.33 | rs31489 | A | 0.32 | 0.49 | 0.28 | 0.19 | 0.41 | EA | 0.81 | 6.3×0-13 | (108) | |
| 6p22.1 | rs417162 | C | 0.32 | 0.30 | 0.23 | 0.31 | 0.37 | EA | 0.63 | 1.05E-11 | (102) | |
| 9p21.3 | rs1412829 | G | 0.18 | 0.01 | 0.19 | 0.09 | 0.41 | EA | 0.8 | 2.80E-08 | (108) | |
| 13q12.12 | rs9510787 | G | 0.18 | 0.04 | 0.16 | 0.32 | 0.26 | EA | 1.2 | 1.53E–9 | (103) | |
| 16p13.13 | rs6498114 | G | 0.28 | 0.11 | 0.16 | 0.57 | 0.24 | EA | 0.87 | 4.01E-09 | (107) | |
| Laryngeal squamous cell | ||||||||||||
| 6p21.33 | rs2857595 | A | 0.32 | 0.44 | 0.29 | 0.50 | 0.16 | EA | 0.78 | 2.43E–15 | (109) | |
| 11q12.2 | rs174549 | A | 0.28 | 0.02 | 0.57 | 0.55 | 0.30 | EA | 0.73 | 1.00E–20 | (109) | |
| 12q24.21 | rs10492336 | A | 0.17 | 0.03 | 0.16 | 0.20 | 0.32 | EA | 0.71 | 4.48E–14 | (109) | |
| Non-Hodgkins Lymphoma | ||||||||||||
| 3q27.3 | rs6773854 | C | 0.20 | 0.30 | 0.16 | 0.17 | 0.21 | EA | 1.44 | 3.40E-13 | (114) | |
| Acute Lymphoblastic Leukemia | ||||||||||||
| 10p12.2 | rs7088318 | C | 0.41 | 0.66 | 0.25 | 0.39 | 0.40 | ME | 1.42 | 1.10E-11 | (119) | |
| 16q23.1 | rs1121404 | C | 0.47 | 0.53 | 0.59 | 0.31 | 0.55 | EA | 1.38 | 5.30E-10 | (118) | |
| T-cell Lymphoma | ||||||||||||
| 6p21.32 | rs9277378 | G | 0.49 | 0.70 | 0.34 | 0.61 | 0.31 | EA | 1.84 | 4.21E-19 | (115) | |
The minor alleles and frequencies for these alleles were extracted from the 1000 Genomes Project (https://mathgen.stats.ox.ac.uk/impute/1000GP_Phase3.html).
The ORs and P-values presented relate to the discovery population and were extracted from the cited reference.
AFR=African Americans, EA= East Asians, LA= Latin Americans, ME=Multiethnic
rs201982221 is not in 1000 Genomes database; reported A allele frequency in controls = 0.06 (101).
Figure 1.
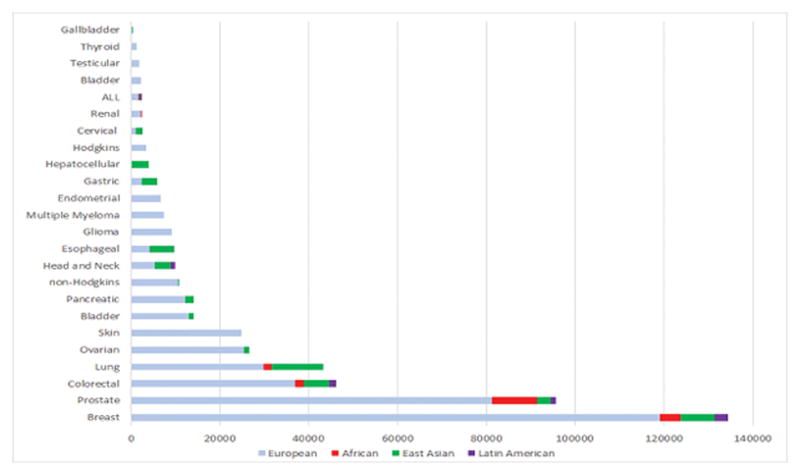
The number of cancer cases included in the discovery stage of GWAS by ancestral population and cancer site. Shown are cancer sites with >100 cancer cases in a discovery stage.
Throughout this review, context for terms that can represent a place, a person or an ancestry will be provided. In the rare instances where it is not specified, it can be assumed that the term is referring to ancestry and not geography. Also, the term ‘ancestry-specific variant’ refers to variants that are extremely rare in other ancestral populations and are largely “population-private.”
Results
Prostate Cancer
As the most common cancer in men, the number and size of prostate cancer GWAS in non-European ancestry populations have been larger than many other cancer sites, with five scans including men of African ancestry, seven scans including men of East Asian ancestry, and three scans including men of Latin American ancestry. Of the more than 170 risk loci identified for prostate cancer(9, 10), the vast majority were initially reported in men of European ancestry, with the largest scan including 81,318 prostate cancer cases and 61,074 controls of European ancestry (OncoArray, personal communication, F. Schumacher). Twenty-one loci were first discovered in GWAS or in meta-analyses that included one or more populations of non-European ancestry. Genetic studies in the African Ancestry Prostate Cancer (AAPC) Consortium (>4,853 prostate cancer cases and 4,678 controls) identified two African-specific variants at 8q24 as well as one at 17q21.33/ZNF365 in a region that a later GWAS in men of European ancestry found evidence of association with a separate variant.(5, 10, 11) The only GWAS in exclusively African men was in a small sample of Ghanaians (474 prostate cancer cases and 458 controls) that reported loci specific for high and low risk prostate cancer that were not replicated in AAPC.(12) GWAS of prostate cancer in Japanese men have discovered six loci at 3p11.2, 5p15.33, 6q22.1, 10q26.12, 11q12.1 and 13q22.1(13, 14), while a GWAS in Chinese men has reported two additional loci at 9q31.2 and 19q13.4.(15) A meta-analysis of GWAS in Japanese and Chinese, which have included these prior studies (3,000 prostate cancer cases and 4,394 controls), has also revealed an additional two risk loci at 11p15.4 and 14q23.2.(16) The only Latino-specific scan (1,043 prostate cancer cases and 1,057 controls) was underpowered to detect novel loci of modest risk.(17) Multiethnic scans that have included many of these populations have also been successful in discovering novel risk loci, with 7 loci (1q32.1, 6q14.1, 14q23.1, 16q22.2, 20q13.13, 21q22.3 and 22q11.21) identified in 43,303 prostate cancer cases and 43,737 controls (~80% EAs) in the Prostate Cancer Association Group to Investigate Cancer Associated Alterations in the Genome (PRACTICAL)/Elucidating Loci Involved in Prostate Cancer Susceptibility (ELLIPSE) Consortium(9) and another locus at 6q25.3 identified in a sample of 7,783 cases and 38,595 controls (80% EAs) in the Kaiser Permanente GWAS.(18) Of the nearly 100,000 prostate cancer cases included in the discovery stage of GWAS, 85% have been of European ancestry, 11% of African ancestry, 3% of East Asian ancestry, and 1% of Latin American ancestry.
Breast Cancer
More than 170 breast cancer risk loci have been identified in GWAS of overall breast cancer, or estrogen receptor-positive (ER+) and ER− disease(19–21), with the most recent scan in the Breast Cancer Association Consortium (BCAC)/Discovery, Biology, and Risk of Inherited Variants in Breast Cancer (DRIVE) Consortium discovering ~40% (n=71) of these loci (OncoArray, personal communication, D. Easton). Fourteen of these loci (9%) were first discovered in GWAS in non-European ancestry populations. GWAS of breast cancer in East Asians (Japanese, Chinese and Koreans) have reported 11 novel loci (22–29), including a common deletion in the APOBEC3 gene(25), with the largest meta-analysis from the Asian Breast Cancer Consortium (7,619 breast cancer cases and 6,286 controls), reporting the two latest discoveries at 1p22.3 and 21q22.12.(29) Two GWAS of breast cancer in women of African ancestry have been conducted in the African American Breast Cancer (AABC Consortium) and the GWAS in Breast Cancer in the African Diaspora (ROOT Consortium).(30, 31) In 2011, a GWAS meta-analysis of ER− breast cancer in AABC and the Triple-Negative Breast Cancer Consortium (TNBCC) in women of European ancestry discovered a variant that is more common in women of African than European ancestry (allele frequency=0.6 vs. 0.3) that is specific for ER− breast cancer and near the TERT gene at 5p15.33.(32) A recent meta-analysis of AABC and ROOT (4,673 cases and 4,774 controls), with replication in the African American AMBER Consortium (33), reported another locus for ER− disease at 3q26.31.(31) In the only scan of Hispanic/Latinas (3,140 breast cancer cases and 8,184 controls), a novel protective variant that originates from Native Americans was identified at 6q25.1(34), near the Estrogen Receptor 1 gene (ESR1) in a region previously discovered in Chinese.(26) This variant is common >5% in Latinos, is low frequency (<1%) in East Asians, and is absent in populations of European and African ancestry. Multiethnic scans that have included many of these populations were also successful in discovering a novel locus at 6q14.1 for overall breast cancer and at 20q11.22 for ER− disease(35), although the latter region has not been replicated in subsequent scans. More than 130,000 breast cancer cases have been included in the discovery stage of GWAS, with 89% of European ancestry, 6% of East Asian ancestry, 3% of African ancestry, and 2% of Latin American ancestry.
Colorectal Cancer
Over 80 risk loci for colorectal cancer have been identified by GWAS with the majority of studies conducted among European ancestry populations.(36–40) In the largest GWAS of colorectal cancer to date, based on an European ancestry discovery set (36,948 cases and 30,864 controls), 11 new loci were identified (OncoArray, personal communication, S. Gruber). Among non-European ancestry populations, there have been several GWAS of colorectal cancer in East Asians (Chinese, Japanese, and Koreans) (38, 41–47) with only one scan of African Americans(44) and another scan of Latinos.(48) In East Asians, risk loci have been discovered at 5q31.1, 10q22.3, 10q25.2, 11q12.2, 12p13.3, 17p13.3, 18q21.1, 19q13.2, and 20p12.3.(38, 42, 44, 45, 47) The largest GWAS of colorectal cancer in East Asians was conducted in the Asia Colorectal Cancer Consortium, with 8,027 colorectal cancer cases and 22,557 controls in the discovery set and 11,044 colorectal cancer cases and 12,047 controls in the replication set that identified four novel risk loci for colorectal cancer (6p21.1, 8q23.3, 10q24.3, and 12p13.3) as well as two new variants in previously identified risk regions (10q25.2 and 20q13.3).(46) In a multiethnic GWAS of colorectal cancer that included a discovery sample of Japanese (2,627 colorectal cancer cases and 3,797 controls) and African American subjects (1,894 colorectal cancer cases and 4,703 controls), a novel risk locus was found at 10q25.(44) For Latin American ancestry populations, there has been one GWAS study of colorectal cancer that included 1,611 colorectal cancer cases and 4,300 controls.(48) In this study, no novel risk loci were found that reached a threshold of genome-wide significance, but suggestive associations (p<10−6) were identified at 1p34.3, 2q23.3, 14q24.2, and 16q12.2. Close to 37,000 colorectal cancer cases have been included in the discovery stage of GWAS, with 80% of European ancestry populations, 4% of African ancestry, 16% of East Asian ancestry, and 4% of Latin American ancestry.
Lung Cancer
Over 40 risk loci for overall lung cancer and/or lung cancer histologic cell-types have been identified with the first GWAS in populations of European ancestry.(49–54) To date, the largest scan was conducted in a study of 29,266 lung cancer cases and 56,450 controls of European ancestry, which identified 10 novel loci (OncoArray, personal communication, C. Amos). Among GWAS or GWAS meta-analysis of lung cancer in non-European ancestry groups, one was conducted in African Americans and seven were conducted in East Asians (Chinese, Japanese, and Koreans). In the only African American GWAS (1,737 lung cancer cases and 3,602 controls), one loci at 15q25.1, that encodes for the alpha-nicotinic acetylcholine receptor (CHRNA3-CHRNB4-CHRNA5) (rs2036527) and one at 5p15.33, that encodes for telomerase reverse transcriptase (TERT)rs2853677)(55), confirmed these discoveries from previous GWAS of European and East Asian ancestry populations.(49, 51, 56) No novel loci were identified in this GWAS of African Americans.(55) In East Asians, variants in the 15q25.1 CHRNA3-CHRNB4-CHRNA5 region were not associated with lung cancer at a genome-wide significance level. However, variant rs2736100 at 5p15.33 TERT, which was previously found to be a suggestive association in European ancestry populations (correlated with rs2853677 in East Asians; p>10−7)(57), reached genome-wide significance in a Japanese study with 1,026 adenocarcinoma cases.(58) An additional novel independent signal at 5p15.33 TERT, rs465498, has also been identified for overall lung cancer in East Asian populations.(59) In addition, GWAS in East Asians with discovery sample sizes ranges from 621 to 6,877 for overall lung cancer or lung cancer subtypes had identified 14 novel risk loci at 11 regions, including, five risk loci at 6q22.1, 6p21.32 (rs2395185), 9p21.3, 10q25.2 and 12q13.13 among non-smokers. (56, 58–62). Over 43,000 lung cancer cases have been included in the discovery stage of GWAS, with 69% of European ancestry populations, 4% of African ancestry, 27% of East Asian ancestry; and no Latin American populations have been studied.
Ovarian Cancer
GWAS of ovarian cancer have identified 39 risk loci, with the largest scan including 25,509 ovarian cancer cases and 40,941 controls of European ancestry (OncoArray, personal communication, P. Pharoah). All GWAS have been conducted in women of European ancestry(63) with the exception of a three-stage scan in Chinese women (1,044 ovarian cancer cases and 1,172 controls), which revealed a novel risk locus in an intron of the gene COL15A1 gene at 9q22.33 and a second locus upstream of the gene ANKRD30A at 10p11.21.(64)
Endometrial Cancer
GWAS of endometrial cancer have been conducted primarily in women of European ancestry (65, 66), (67, 68), with the exception of a small GWAS in Chinese women (832 endometrial cancer cases and 2,682 controls), which did not yield a novel discovery.(69) Endometrial cancer GWAS have revealed eight risk loci, with the largest GWAS meta-analysis including 6,542 endometrial cancer cases of European ancestry.(67)
Cervical Cancer
Five cervical cancer risk loci have been identified in three GWAS of cervical cancer (70–72), two of which were conducted in East Asian women (71, 72). In the only scan in women of European ancestry, with a discovery set of 1,034 cervical cancer cases and 3,948 controls, three independent loci at the major histocompatibility complex (MHC) region on 6p21.3 were identified.(70) In a Japanese scan that included a limited discovery sample of 226 cervical cancer cases and 186 Japanese controls, no genome-wide significant loci were identified.(71) In a Chinese scan that included a discovery set of 1,364 cervical cases and 3,028 controls, risk loci at 4q12 and 17q12 were identified and the 6p21.3 risk region was confirmed.(70, 72)
Bladder Cancer
GWAS of bladder cancer have identified 13 risk loci in nine studies of European ancestry populations and two risk loci in two GWAS of East Asians.(73, 74) The largest study conducted in men and women of European ancestry included a discovery set of 6,911 cases and 11,818 controls. In a Japanese study, with a discovery set of 431 bladder cancer cases and 5,581 controls, a novel risk variant at 15q25 risk locus was identified.(74) The largest study conducted in men and women of European ancestry included a discovery set of 6,911 bladder cancer cases and 11,818 controls. In a Japanese study, with a discovery set of 431 bladder cancer cases and 5,581 controls, a novel risk variant at the 15q25 risk locus was identified.(74) In a Chinese study, with a discovery set of 599 bladder cancer cases and 4,645 controls, a novel risk variant at 5q12.3 was reported that did not replicate in European ancestry populations.(73)
Renal Cell Carcinoma
There have been six risk loci identified for renal cell carcinoma, all of which were identified in GWAS in European ancestry populations.(75–78) In the only GWAS conducted in a non-European ancestry population, of 225 African American renal cell carcinoma cases and 375 controls, a signal was detected at 12p11.23, 77 kb from a previously reported European-ancestry renal cell carcinoma marker; however, the association did not reach genome-wide significance (p = 1.2 × 10⁻⁷).(77)
Hepatocellular carcinoma
Seven hepatocellular carcinoma (HCC) risk loci have been identified, all of which were found in East Asian populations, where the incidences rates are the highest globally. Major risk factors for HCC include hepatitis B or C infections and exposure to dietary aflatoxin B1, which are prevalent in East Asian countries such as China, Japan, and Korea. The first GWAS in Korean men and women included a discovery set of 180 HCC cases and 271 controls, and did not detect an association at a genome-wide significance level.(79) The second study, in 348 Chinese HBV-related HCC cases and 359 Chinese controls reported a novel risk locus at 1p36.22.(80) In two following studies, with increased sample sizes of over 1000 HCC cases, four additional loci at 2q32.3, 6p21.32/HLA-DQ (two variants) and 21q21.3 were discovered.(81, 82) Approximately 80% of HCC cases in China have a prior history of HBV infection and the largest HBV-HCC GWAS has been conducted among Chinese, with 1,538 HBV-related HCC cases.(82) In the only GWAS of HCV-HCC, conducted in Japanese, the investigators found two novel risk loci at 6p21.32 and 6p21.33.(83)
Gastric Adenocarcinoma
Approximately 40% of all gastric adenocarcinoma cases occur in East Asia, primarily in China. Of the seven GWAS of gastric adenocarcinoma, six were conducted in populations of East Asian ancestry. To date, eleven risk loci have been reported, with nine discovered in East Asian men and women [1q22 (two variants), 3q13.31, 5p13.1, 5q14.3, 6p21.1 (two variants), 8q24.3 and 10q23.33] (84–86), with discovery GWAS sample sizes, ranging from 188 to 2,350 gastric adenocarcinoma cases. In the only European ancestry GWAS, one risk loci and one risk haplotype were identified in a discovery sample of 2,500 male and female Icelandic gastric cancer cases (~90% of these cases are adenocarcinoma) and 205,652 controls.(87) More recent GWAS in East Asians have characterized the genetic associations by sublocations: cardia gastric adenocarcinoma, which occurs in the top few centimeters of the stomach, or non-cardia adenocarcinoma, which occurs elsewhere in the stomach. Sublocation analyses suggests that the variants identified at 1q22, 5p13.1, 5q14.3, and 6p21.10 may be specifically associated with non-cardia gastric adenocarcinoma, although further work by sublocations is required to confirm these findings.(88–90)
Pancreatic Cancer
There have been 21 pancreatic cancer risk loci identified(91), with five discovered in GWAS in non-European ancestry populations(92, 93). To date, the majority of pancreatic cancer susceptibility loci have been identified from PanScan. The largest pancreatic scan includes the collaboration between PanScan and the Pancreatic Cancer Cohort Consortium (PanC4), which examined 7,638 pancreatic cancer cases and 7,364 controls of which >92% were of European ancestry.(94) Only two GWAS of pancreatic cancer have been conducted in non-European ancestry samples in their discovery sets: Japanese (991 cases and 5,209 controls)(92) and Chinese (981 cases and 1,991 controls) men and women.(93) The study in Japanese men and women failed to detect genome-wide significant associations, whereas the study among Chinese men and women identified five novel loci at 5p13.1, 10q26, 21q21.3, 21q22.3, and 22q13.32. This study also found a suggestive association at 2p13.3, which was later confirmed as a risk susceptibility locus in the mostly European PanScan-PanC4.(94)
Esophageal Cancer
To date, the 16 susceptibility loci for esophageal cancer have been reported from seven GWAS of esophageal cancer, which includes two scans in populations of European ancestry(95) and five scans in East Asians (Japanese and Chinese).(85, 96–100) The five GWAS of esophageal squamous cell carcinoma (ESCC) in East Asians had discovery sample sizes ranging from 182 to 5,337 ESCC cases and reported the discovery of 13 of the 16 risk loci at 2q33.1, 4q23, 5q11, 5q31.2, 6p21.1, 10q23.33 (2 variants), 12q24.12, 12q24.13, 16q12.1, 17p13.1, 21q22.12, and 22q12. Variants at 12q24.12 (rs671) and 12q24.13 (rs2074356), which are in or near the ALDH2 gene, have been reported to have a potential multiplicative interaction with alcohol drinking (96, 97), a major risk factor for esophageal cancer. ALDH2 encodes for one of the enzymes responsible for the metabolism of alcohol. The ALDH2 rs671 A allele, which is common in East Asian populations (30–50% frequency) and almost nonexistent in European ancestry populations, has been associated with a reduction in the enzyme’s ability to metabolize acetaldehyde, the primary metabolite of alcohol and an established carcinogen.
Head and Neck Cancers
Oral and Oropharynx
There has been one GWAS of oral and pharynx cancer (oral, oropharynx, hypopharynx and overlapping cancers) that was conducted in a multiethnic population of 6,034 cases, of which 986 of the cases were from Latin America.(101) This study identified four loci at 4q23, 6p21.32, 10q26.13, and 11p15.4 for combined oral and oropharynx cancers. The variants at 4q23 and 6p21.32 were also found associated at a genome-wide association level with the sublocation of oropharyngeal cancer. For the sublocation oral cancer, 2p23.3, 5p15.33, 9p21.3 and 9q34.12 were identified as risk loci.
Nasopharyngeal Cancer
To date GWAS of nasopharyngeal cancer have been conducted exclusively in East Asian populations and have identified seven nasopharyngeal cancer risk loci. For the six GWAS of nasopharyngeal cancer in East Asian populations, the discovery samples ranged from 111 to 1,583 nasopharyngeal cancer cases among southern Chinese, Malaysian Chinese, and Taiwanese. (102–107) In these GWAS, nasopharyngeal risk loci were found at the major histocompatibility complex at 6p22.1 and loci at 3p22.2, 3q26.2, 13q12.12, and 16p13.13. In spite of the small discovery sample for two of the GWAS studies, with less than 300 nasopharyngeal cancer cases, these studies were able to detect large effects for variants in HLA-A at 6p22.1, with odds ratios ranging from 1.86–2.57.(104, 106) The risk variant in this HLA region is common in Chinese populations. In a recent meta-analysis of four GWAS of nasopharyngeal cancer that included 2,152 Chinese nasopharyngeal cancer cases and 3,740 controls, a novel risk variant was identified within the CLPTM1L/TERT region at 5p15.33, and a suggestive association at 9p21.3 from an early study(103) was confirmed, reaching a GWAS significance threshold in this larger study.(108)
Laryngeal Cancer
To date, there has been only one GWAS of laryngeal cancer, which was conducted among Chinese men and women, with a discovery set of 993 laryngeal squamous cell carcinoma and 1,995 controls and three replication sets that included 2,398 cases and 2,804 controls. In this study, three risk loci were found at 6p21.33, 11q12.2, and 12q24.21.(109) No GWAS of laryngeal cancer has been reported in other populations.
Hematological Malignancies
The risk loci for hematological malignancies, identified primarily from scans in men and women of European ancestry, include 41 for Non-Hodgkin lymphoma (NHL, all subtypes), eight for Hodgkin lymphoma(110, 111), 17 for multiple myeloma(112) and nine for childhood acute lymphoblastic leukemia (ALL)(113)]. The number and size of GWAS in non-European ancestry populations have been extremely limited. For NHL, only a single small GWAS in Chinese (253 NHL cases and 1,438 controls) has been conducted, which reported a risk locus at 3q27.3/BCL6/LPP.(114) No GWAS have been reported for Hodgkin lymphoma or multiple myeloma in non-European ancestry populations. A GWAS of extranodal natural killer T-cell lymphoma conducted in Chinese (189 cases and 957 controls) revealed a locus at 6p21.32/HLA-DPB1, which encodes the β1 subunit of HLA-DP that is involved in extracellular antigen presentation to CD4-positive T-cell lymphocytes.(115) Two small GWAS (<210 cases) of ALL and chronic myeloid leukemia (CML) have been conducted in Koreans(116, 117), but neither reported a novel risk locus. More recently, a three-stage scan of ALL in Chinese (stage 1: 272 cases, 1045 controls; total: 1184 cases, 3219) reported a novel locus at 16q23.1/WWOX.(118) African Americans (89 cases) and Hispanics (305 cases) have also been included in a multiethnic GWAS of childhood ALL (1,605 cases), which reported a novel susceptibility locus at BM1-PIP4K2A on 10p12.2.(119)
Gallbladder Cancer
The only GWAS of gallbladder cancer was conducted in a Japanese study with 41 gall bladder cancer cases and 866 controls in the discovery set and 30 gall bladder cancer cases and 898 controls in the replication.(120) A suggestive association at 18q21.3 loci and gall bladder cancer risk was reported (p= 7.5×10⁻⁸). No GWAS of gallbladder cancer has been reported among European populations or among populations of Amerindian ancestry which have the highest incidence(121).
Glioma
GWAS of glioma have centered on populations of European ancestry that have identified over a dozen risk loci for glioma.(122–126) The largest study included four European ancestry populations that yielded a total pooled sample of 4147 glioma cases and 7435 controls.(126) Glioma is a rare cancer with a higher incidence among Non-Hispanic Whites than other minority populations(127).
Skin – cutaneous melanoma, squamous cell carcinoma and basal cell carcinoma
All GWAS for the three common skin cancers have been conducted in European ancestry populations with 13 risk loci identified for melanoma(128), 11 for squamous cell carcinoma(129), and 35 loci for basal cell carcinoma.(130) Skin cancers are common in populations of European ancestry and the primary risk factor is ultraviolet (UV) exposure and greater propensity to sunburn from UV exposure.
Thyroid Cancer
GWAS of thyroid cancer have focused solely on European ancestry populations and have identified five risk loci at 9p22.33, 14q13.3, 2q35, 8p12, and 14q13.3.(131–133), The incidence of thyroid cancer is highest in Non-Hispanic Whites followed by Asian/Pacific Islanders.(4)
Discussion
Genome-wide association studies in populations of non-European ancestry have already begun to make important contributions towards understanding cancer mechanisms and genetic susceptibility to cancer. Of the > 700 cancer risk loci revealed through GWAS, 82% of these loci were discovered in European ancestry populations, 14% in East Asians, 3% in multiethnic populations, and less than 1% discovered in African and Latino populations. As raised by Popejoy et al.(2) and others(3, 134), the under-representation of non-European ancestry populations in genetic studies may create a major translational gap in utilizing genetic information for preventing and treating diseases such as cancer across populations. The identification of genetic markers of cancer susceptibility in different racial/ethnic populations has the potential for widespread applicability and significance, leading to better defining the spectrum of allelic variation underlying population risk and disease heritability. Moreover, these identified cancer susceptibility markers may provide insight into novel biological pathways and environmental factors that are important in the etiology of cancer, and aid in the development of risk models that account for allelic heterogeneity between populations and preventive strategies that target individuals at high risk. It is predicted that information from genome-wide investigations of common and rare variation will, over the coming years, play a significant role in shaping personalized preventive and therapeutic medicine.
For the cancer sites examined in this review, 20 sites included European ancestry samples in the discovery stage, 14 included samples of East Asian ancestry, 5 included samples of Latin American ancestry, and 5 included samples of African ancestry (Figure 1). Three cancer sites have been investigated in only GWAS of East Asians (gallbladder, nasopharynx and hepatic), while seven cancer sites were limited to GWAS of only European ancestry samples (thyroid, testicular, bladder, NHL, endometrium, multiple myeloma, brain/glioma, and skin/melanoma). For scans conducted in multiple populations, the size of GWAS in non-European ancestry populations has been substantially smaller than in European ancestry populations. This difference is most apparent for Latin American and African ancestry populations, while studies in East Asian populations have been considerably larger for sites with elevated incidence rates in this population such as nasopharyngeal, hepatocellular, gastric, esophageal, and cervical cancers. We estimate that 84% of the samples included in the discovery stages were of European ancestry, whereas only 11% were East Asian ancestry, 4% were African ancestry, and 1% were Latin American ancestry (Figure 2). The emphasis on studying European ancestry populations has been partly a matter of convenience and partly a matter of choice. The early investments in establishing epidemiological studies of cancer in the U.S. and Europe focused on European ancestry populations. It was also assumed that homogeneity in ancestry be a prerequisite to improve statistical power of GWAS. Thus, when genotyping technology advanced for large-scale genotyping in the mid 2000’s, samples of European ancestry were prioritized.
Figure 2.
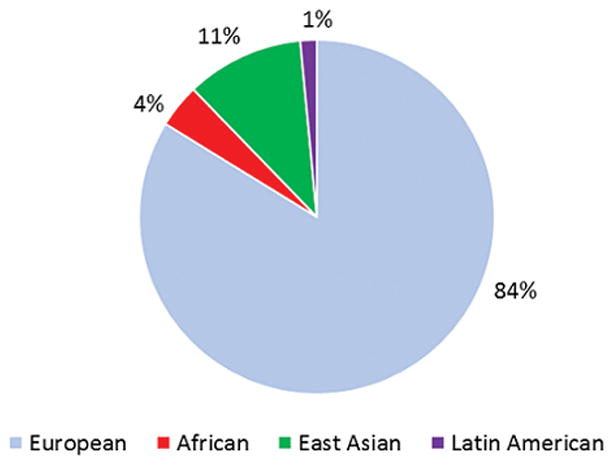
The distribution of cancer cases in the discovery stage of GWAS of cancer by ancestral population (overall n ~478,000)
Several important discoveries have been made in GWAS of cancer in non-European ancestry populations. For example, in a GWAS of breast cancer among Latinas, a risk variant at 6q25.1 near ESR1 was discovered that is specific to women with Indigenous American ancestry, representing a novel signal from previous variants in this region reported for East Asians and Europeans.(34) GWAS of nasopharyngeal and hepatocellular cancer in East Asians revealed the significant role of the HLA region for these two cancer sites.(81, 82, 102–104) A GWAS of lung cancer in non-smoking East Asian women identified three novel loci at 10q25.2/VTI1A, 16p22.1/DCBLD and 6p21.32/HLA-DRA (61, 62). Approximately, 50% of lung cancers in East Asian women are non-smokers (as opposed to 90% of lung cancer cases in European ancestral populations).(135) The 8q24 region is well-known for harboring risk loci for many cancers including those that are only found in populations of African ancestry.(5)
Despite the many discoveries from the limited number of GWAS in non-European ancestry populations, the majority of these scans were conducted using SNP arrays that were not optimized for capturing common variation (directly or indirectly) in non-European ancestry populations. Likewise, only 20–30% of the discovery stages performed imputation to 1000 Genomes, which is the current gold standard for imputation. However, studies have shown that the imputation quality in non-European ancestral populations is lower than other populations (3, 136, 137). This is a result of both the European ancestral-centric array content and the available imputation reference panels. Next generation arrays are currently being designed for studying genetic variation in ancestrally diverse populations with content derived from whole-exome and whole-genome sequencing. These arrays, such as the Illumina Multi-ethnic Genotyping Array (MEGA) array(138) and the Infinium Global Multi-Ethnic Array aim to provide a more comprehensive assessment of common and rare variation in non-European ancestry populations for discovery and fine-mapping.(138) Over the next few years, large-scale whole-genome sequencing efforts to capture genetic diversity in populations divergent from those of European ancestry, such as Latin American, Polynesian, East/South Asian, Middle Eastern and continental African populations, will improve the size and representativeness of imputation reference panels as well as power of genotyping arrays for GWAS in these populations.
There are several strengths of conducting GWAS of cancer in non-European ancestry populations. Foremost, is the ultimate goal of identifying risk alleles that will translate into medical advances to improve cancer risk prediction in all populations as well as further our understanding of the biology of disease. As some risk alleles differ in frequency and occurrence by ancestral population, no single population is sufficient to uncover all of the underlying genetic markers of disease. The inclusion of environment exposures may also strengthen GWAS associations (via interaction) and aid in the detection of risk alleles in exposed populations in geographical regions or within defined racial/ethnic groups. GWAS of cancer in non-European ancestry populations may also help to elucidate potential unmeasured or not yet identified environmental risk factors for which race/ethnicity may serve as a temporary proxy. Variation in the burden of cancers and environmental risk factors across population groups also drives the rationale and ability to assemble large numbers of cancer cases required for risk locus discovery, as noted for the higher prevalence of EBV and nasopharyngeal cancer, HCV and HCC, and H.pylori and gastric adenocarcinomas in East Asian populations (80–83, 88–90, 102–107).
A major challenge in conducting GWAS in non-European ancestry populations is sample size. Concerted consortia-type efforts have been needed to achieve pooled sample sizes of ~1,000–10,000 cases in individual non-European ancestry groups, with studies in East Asians reaching ~30,000 cases for common sites (Table 2). Such studies may also leverage ‘reusing’ existing GWAS data (for ‘controls’) to enhance statistical power.(139) However, for cancers with known environmental risk factors that influence genetic associations, using controls geographically different from cases may decrease the effectiveness of this approach. Moreover, despite the scans with larger East Asian sample sizes, improvements in data sharing would help to refine the precision of risk estimates and correct for false positive. (99) One of the largest cancer GWAS in a non-European ancestry population conducted by African Ancestry Prostate Cancer Consortium (Table 2), has pooled GWAS data from 30 studies globally, established over the past 20 years, to achieve a GWAS discovery sample of 10,000 African ancestry prostate cancer cases and 10,000 controls. This scan, for a cancer that is nearly twice as common in men of African than European ancestry, is ~10% of the size of GWAS in men of European ancestry (which includes almost 100,000 cases). Progress in studying the genetic basis of cancer in non-European ancestry populations will require substantial investments in patient enrollment and sample collection, which will likely take years (if not decades) to reach the GWAS sample sizes of European ancestry populations observed today. The critical importance of large sample sizes is reinforced from recent discoveries in European ancestry groups of risk loci for cancer subtypes, such as estrogen receptor negative breast cancer(19), ovarian cancer subtypes (e.g. mucinous tumors)(140) and non-Hodgkin lymphoma subtypes.(141) The shift towards studying rare and population-specific variation with modest effects will also demand larger study sizes. Continued expansion of consortium efforts will be needed particularly for less common cancer sites in diverse racial/ethnic groups.
Table 2.
Cancer GWAS consortia in non-European ancestry populations.
| Consortium/Study (Acronym) | Ancestry | Sizea | Reference |
|---|---|---|---|
| Female Lung Cancer Consortium in Asia (FLCCA) | East Asian | 12,700 | (61) |
| Esophageal Squamous Carcinoma in Chinese | East Asian | 15,000 | (99) |
| Asian Colorectal Cancer Consortium (ACCC) | East Asian | 28,000 | (38) |
| Asian Breast Cancer Consortium (ABCC) | East Asian | 30,000 | (28) |
| African American (Ovarian) Cancer Epidemiology Study | African | 500 | (147) |
| African American Multiple Myeloma Study (AAMMS) | African | 1,500 | (148) |
| African Ancestry Prostate Cancer Consortium (AAPC) | African | 10,500 | (5) |
| Hispanic Colorectal Cancer Study (HCCS) | Latin American | 2,000 | (48) |
Approximate number of cases.
Tumor and organ-specific tissue resources, such as the Tumor Cancer Genome Atlas (TCGA)(142) and Genotype-Tissue Expression (GTEx)(143), are being utilized to study the biological function at GWAS risk regions through the characterization of chromatin marks, which signify regulatory sequence and gene expression profiles (i.e. eQTLs) to identify target genes. The vast majority of specimens in these resources are from individuals of European ancestry, which limits progress in understanding mechanism for GWAS risk regions discovered in (and perhaps limited to) populations of non-European ancestry. Future resource building efforts in non-European ancestry populations will need to consider the collection of a wider range of biospecimens beyond germline DNA.
While striking differences in the number and size of GWAS conducted in non-European versus European ancestry populations are roughly proportional to the ancestral population sizes within most countries that have funded the discovery work, they certainly do not align with ancestral population sizes globally. Prioritizing cancer genomics research in non-European ancestry populations will improve our understanding of cancer biology and risk susceptibility and, more importantly, broaden the impact of genomic medicine on human health.
Acknowledgments
Financial Support:
The authors and this work was supported by the following grants: U01 HG007397 (S.L. Park, I. Cheng, C.A. Haiman), U01 CA164973 (S.L. Park, I. Cheng, C.A. Haiman), U19 CA148537 (C.A. Haiman), R01 CA165862 (C.A. Haiman) and R01 CA165038 (C.A. Haiman).
References
- 1.Rosenberg NA, Huang L, Jewett EM, Szpiech ZA, Jankovic I, Boehnke M. Genome-wide association studies in diverse populations. Nat Rev Genet. 2010;11:356–66. doi: 10.1038/nrg2760. [DOI] [PMC free article] [PubMed] [Google Scholar]
- 2.Popejoy AB, Fullerton SM. Genomics is failing on diversity. Nature. 2016;538:161–4. doi: 10.1038/538161a. [DOI] [PMC free article] [PubMed] [Google Scholar]
- 3.Martin AR, Gignoux CR, Walters RK, Wojcik GL, Neale BM, Gravel S, et al. Human Demographic History Impacts Genetic Risk Prediction across Diverse Populations. The American Journal of Human Genetics. doi: 10.1016/j.ajhg.2017.03.004. [DOI] [PMC free article] [PubMed] [Google Scholar]
- 4.Howlader N, Noone A, Krapcho M, Neyman N, Aminou R, WW, et al. [September 1, 2015];SEER Cancer Statistics Review, 1975–2013. 2016 Apr; Available from: http://seer.cancer.gov/csr/1975_2013, based on November 2015 SEER data submission, posted to the SEER web site.
- 5.Han Y, Rand KA, Hazelett DJ, Ingles SA, Kittles RA, Strom SS, et al. Prostate Cancer Susceptibility in Men of African Ancestry at 8q24. J Natl Cancer Inst. 2016:108. doi: 10.1093/jnci/djv431. [DOI] [PMC free article] [PubMed] [Google Scholar]
- 6.Haiman CA, Patterson N, Freedman ML, Myers SR, Pike MC, Waliszewska A, et al. Multiple regions within 8q24 independently affect risk for prostate cancer. Nat Genet. 2007;39:638–44. doi: 10.1038/ng2015. [DOI] [PMC free article] [PubMed] [Google Scholar]
- 7.Minster RL, Hawley NL, Su CT, Sun G, Kershaw EE, Cheng H, et al. A thrifty variant in CREBRF strongly influences body mass index in Samoans. Nat Genet. 2016;48:1049–54. doi: 10.1038/ng.3620. [DOI] [PMC free article] [PubMed] [Google Scholar]
- 8.Amos CI, Dennis J, Wang Z, Byun J, Schumacher FR, Gayther SA, et al. The OncoArray Consortium: A Network for Understanding the Genetic Architecture of Common Cancers. Cancer Epidemiol Biomarkers Prev. 2017;26:126–35. doi: 10.1158/1055-9965.EPI-16-0106. [DOI] [PMC free article] [PubMed] [Google Scholar]
- 9.Al Olama AA, Kote-Jarai Z, Berndt SI, Conti DV, Schumacher F, Han Y, et al. A meta-analysis of 87,040 individuals identifies 23 new susceptibility loci for prostate cancer. Nat Genet. 2014;46:1103–9. doi: 10.1038/ng.3094. [DOI] [PMC free article] [PubMed] [Google Scholar]
- 10.Eeles RA, Olama AA, Benlloch S, Saunders EJ, Leongamornlert DA, Tymrakiewicz M, et al. Identification of 23 new prostate cancer susceptibility loci using the iCOGS custom genotyping array. Nat Genet. 2013;45:385–91. 91e1–2. doi: 10.1038/ng.2560. [DOI] [PMC free article] [PubMed] [Google Scholar]
- 11.Haiman CA, Chen GK, Blot WJ, Strom SS, Berndt SI, Kittles RA, et al. Genome-wide association study of prostate cancer in men of African ancestry identifies a susceptibility locus at 17q21. Nat Genet. 2011;43:570–3. doi: 10.1038/ng.839. [DOI] [PMC free article] [PubMed] [Google Scholar]
- 12.Cook MB, Wang Z, Yeboah ED, Tettey Y, Biritwum RB, Adjei AA, et al. A genome-wide association study of prostate cancer in West African men. Hum Genet. 2014;133:509–21. doi: 10.1007/s00439-013-1387-z. [DOI] [PMC free article] [PubMed] [Google Scholar]
- 13.Takata R, Akamatsu S, Kubo M, Takahashi A, Hosono N, Kawaguchi T, et al. Genome-wide association study identifies five new susceptibility loci for prostate cancer in the Japanese population. Nat Genet. 2010;42:751–4. doi: 10.1038/ng.635. [DOI] [PubMed] [Google Scholar]
- 14.Akamatsu S, Takata R, Haiman CA, Takahashi A, Inoue T, Kubo M, et al. Common variants at 11q12, 10q26 and 3p11.2 are associated with prostate cancer susceptibility in Japanese. Nat Genet. 2012;44:426–9. S1. doi: 10.1038/ng.1104. [DOI] [PubMed] [Google Scholar]
- 15.Xu J, Mo Z, Ye D, Wang M, Liu F, Jin G, et al. Genome-wide association study in Chinese men identifies two new prostate cancer risk loci at 9q31.2 and 19q13.4. Nat Genet. 2012;44:1231–5. doi: 10.1038/ng.2424. [DOI] [PMC free article] [PubMed] [Google Scholar]
- 16.Wang M, Takahashi A, Liu F, Ye D, Ding Q, Qin C, et al. Large-scale association analysis in Asians identifies new susceptibility loci for prostate cancer. Nat Commun. 2015;6:8469. doi: 10.1038/ncomms9469. [DOI] [PMC free article] [PubMed] [Google Scholar]
- 17.Cheng I, Chen GK, Nakagawa H, He J, Wan P, Laurie CC, et al. Evaluating genetic risk for prostate cancer among Japanese and Latinos. Cancer Epidemiol Biomarkers Prev. 2012;21:2048–58. doi: 10.1158/1055-9965.EPI-12-0598. [DOI] [PMC free article] [PubMed] [Google Scholar]
- 18.Hoffmann TJ, Van Den Eeden SK, Sakoda LC, Jorgenson E, Habel LA, Graff RE, et al. A large multiethnic genome-wide association study of prostate cancer identifies novel risk variants and substantial ethnic differences. Cancer Discov. 2015;5:878–91. doi: 10.1158/2159-8290.CD-15-0315. [DOI] [PMC free article] [PubMed] [Google Scholar]
- 19.Garcia-Closas M, Couch FJ, Lindstrom S, Michailidou K, Schmidt MK, Brook MN, et al. Genome-wide association studies identify four ER negative-specific breast cancer risk loci. Nat Genet. 2013;45:392–8. 8e1–2. doi: 10.1038/ng.2561. [DOI] [PMC free article] [PubMed] [Google Scholar]
- 20.Michailidou K, Beesley J, Lindstrom S, Canisius S, Dennis J, Lush MJ, et al. Genome-wide association analysis of more than 120,000 individuals identifies 15 new susceptibility loci for breast cancer. Nat Genet. 2015;47:373–80. doi: 10.1038/ng.3242. [DOI] [PMC free article] [PubMed] [Google Scholar]
- 21.Michailidou K, Hall P, Gonzalez-Neira A, Ghoussaini M, Dennis J, Milne RL, et al. Large-scale genotyping identifies 41 new loci associated with breast cancer risk. Nat Genet. 2013;45:353–61. 61e1–2. doi: 10.1038/ng.2563. [DOI] [PMC free article] [PubMed] [Google Scholar]
- 22.Low SK, Takahashi A, Ashikawa K, Inazawa J, Miki Y, Kubo M, et al. Genome-wide association study of breast cancer in the Japanese population. PLoS One. 2013;8:e76463. doi: 10.1371/journal.pone.0076463. [DOI] [PMC free article] [PubMed] [Google Scholar]
- 23.Elgazzar S, Zembutsu H, Takahashi A, Kubo M, Aki F, Hirata K, et al. A genome-wide association study identifies a genetic variant in the SIAH2 locus associated with hormonal receptor-positive breast cancer in Japanese. J Hum Genet. 2012;57:766–71. doi: 10.1038/jhg.2012.108. [DOI] [PubMed] [Google Scholar]
- 24.Kim HC, Lee JY, Sung H, Choi JY, Park SK, Lee KM, et al. A genome-wide association study identifies a breast cancer risk variant in ERBB4 at 2q34: results from the Seoul Breast Cancer Study. Breast Cancer Res. 2012;14:R56. doi: 10.1186/bcr3158. [DOI] [PMC free article] [PubMed] [Google Scholar]
- 25.Long J, Delahanty RJ, Li G, Gao YT, Lu W, Cai Q, et al. A common deletion in the APOBEC3 genes and breast cancer risk. J Natl Cancer Inst. 2013;105:573–9. doi: 10.1093/jnci/djt018. [DOI] [PMC free article] [PubMed] [Google Scholar]
- 26.Zheng W, Long J, Gao YT, Li C, Zheng Y, Xiang YB, et al. Genome-wide association study identifies a new breast cancer susceptibility locus at 6q25.1. Nat Genet. 2009;41:324–8. doi: 10.1038/ng.318. [DOI] [PMC free article] [PubMed] [Google Scholar]
- 27.Long J, Cai Q, Sung H, Shi J, Zhang B, Choi JY, et al. Genome-wide association study in east Asians identifies novel susceptibility loci for breast cancer. PLoS Genet. 2012;8:e1002532. doi: 10.1371/journal.pgen.1002532. [DOI] [PMC free article] [PubMed] [Google Scholar]
- 28.Cai Q, Zhang B, Sung H, Low SK, Kweon SS, Lu W, et al. Genome-wide association analysis in East Asians identifies breast cancer susceptibility loci at 1q32.1, 5q14.3 and 15q26.1. Nat Genet. 2014;46:886–90. doi: 10.1038/ng.3041. [DOI] [PMC free article] [PubMed] [Google Scholar]
- 29.Han MR, Long J, Choi JY, Low SK, Kweon SS, Zheng Y, et al. Genome-wide association study in East Asians identifies two novel breast cancer susceptibility loci. Hum Mol Genet. 2016;25:3361–71. doi: 10.1093/hmg/ddw164. [DOI] [PMC free article] [PubMed] [Google Scholar]
- 30.Chen F, Chen GK, Stram DO, Millikan RC, Ambrosone CB, John EM, et al. A genome-wide association study of breast cancer in women of African ancestry. Hum Genet. 2013;132:39–48. doi: 10.1007/s00439-012-1214-y. [DOI] [PMC free article] [PubMed] [Google Scholar]
- 31.Huo D, Feng Y, Haddad S, Zheng Y, Yao S, Han YJ, et al. Genome-wide association studies in women of African ancestry identified 3q26.21 as a novel susceptibility locus for oestrogen receptor negative breast cancer. Hum Mol Genet. 2016 doi: 10.1093/hmg/ddw305. [DOI] [PMC free article] [PubMed] [Google Scholar]
- 32.Haiman CA, Chen GK, Vachon CM, Canzian F, Dunning A, Millikan RC, et al. A common variant at the TERT-CLPTM1L locus is associated with estrogen receptor-negative breast cancer. Nat Genet. 2011;43:1210–4. doi: 10.1038/ng.985. [DOI] [PMC free article] [PubMed] [Google Scholar]
- 33.Palmer JR, Ambrosone CB, Olshan AF. A collaborative study of the etiology of breast cancer subtypes in African American women: the AMBER consortium. Cancer Causes & Control. 2014;25:309–19. doi: 10.1007/s10552-013-0332-8. [DOI] [PMC free article] [PubMed] [Google Scholar]
- 34.Fejerman L, Ahmadiyeh N, Hu D, Huntsman S, Beckman KB, Caswell JL, et al. Genome-wide association study of breast cancer in Latinas identifies novel protective variants on 6q25. Nat Commun. 2014;5:5260. doi: 10.1038/ncomms6260. [DOI] [PMC free article] [PubMed] [Google Scholar]
- 35.Siddiq A, Couch FJ, Chen GK, Lindstrom S, Eccles D, Millikan RC, et al. A meta-analysis of genome-wide association studies of breast cancer identifies two novel susceptibility loci at 6q14 and 20q11. Hum Mol Genet. 2012;21:5373–84. doi: 10.1093/hmg/dds381. [DOI] [PMC free article] [PubMed] [Google Scholar]
- 36.Tomlinson IP, Webb E, Carvajal-Carmona L, Broderick P, Howarth K, Pittman AM, et al. A genome-wide association study identifies colorectal cancer susceptibility loci on chromosomes 10p14 and 8q23.3. Nat Genet. 2008;40:623–30. doi: 10.1038/ng.111. [DOI] [PubMed] [Google Scholar]
- 37.Schumacher FR, Schmit SL, Jiao S, Edlund CK, Wang H, Zhang B, et al. Corrigendum: genome-wide association study of colorectal cancer identifies six new susceptibility loci. Nat Commun. 2015;6:8739. doi: 10.1038/ncomms9739. [DOI] [PubMed] [Google Scholar]
- 38.Zhang B, Jia WH, Matsuda K, Kweon SS, Matsuo K, Xiang YB, et al. Large-scale genetic study in East Asians identifies six new loci associated with colorectal cancer risk. Nat Genet. 2014;46:533–42. doi: 10.1038/ng.2985. [DOI] [PMC free article] [PubMed] [Google Scholar]
- 39.Whiffin N, Hosking FJ, Farrington SM, Palles C, Dobbins SE, Zgaga L, et al. Identification of susceptibility loci for colorectal cancer in a genome-wide meta-analysis. Hum Mol Genet. 2014;23:4729–37. doi: 10.1093/hmg/ddu177. [DOI] [PMC free article] [PubMed] [Google Scholar]
- 40.Peters U, Jiao S, Schumacher FR, Hutter CM, Aragaki AK, Baron JA, et al. Identification of Genetic Susceptibility Loci for Colorectal Tumors in a Genome-Wide Meta-analysis. Gastroenterology. 2013;144:799–807. e24. doi: 10.1053/j.gastro.2012.12.020. [DOI] [PMC free article] [PubMed] [Google Scholar]
- 41.Hong SN, Park C, Kim JI, Kim DH, Kim HC, Chang DK, et al. Colorectal cancer-susceptibility single-nucleotide polymorphisms in Korean population. J Gastroenterol Hepatol. 2015;30:849–57. doi: 10.1111/jgh.12331. [DOI] [PubMed] [Google Scholar]
- 42.Zhang B, Jia WH, Matsuo K, Shin A, Xiang YB, Matsuda K, et al. Genome-wide association study identifies a new SMAD7 risk variant associated with colorectal cancer risk in East Asians. Int J Cancer. 2014;135:948–55. doi: 10.1002/ijc.28733. [DOI] [PMC free article] [PubMed] [Google Scholar]
- 43.Cui R, Okada Y, Jang SG, Ku JL, Park JG, Kamatani Y, et al. Common variant in 6q26–q27 is associated with distal colon cancer in an Asian population. Gut. 2011;60:799–805. doi: 10.1136/gut.2010.215947. [DOI] [PMC free article] [PubMed] [Google Scholar]
- 44.Wang H, Burnett T, Kono S, Haiman CA, Iwasaki M, Wilkens LR, et al. Trans-ethnic genome-wide association study of colorectal cancer identifies a new susceptibility locus in VTI1A. Nat Commun. 2014;5:4613. doi: 10.1038/ncomms5613. [DOI] [PMC free article] [PubMed] [Google Scholar]
- 45.Jia WH, Zhang B, Matsuo K, Shin A, Xiang YB, Jee SH, et al. Genome-wide association analyses in East Asians identify new susceptibility loci for colorectal cancer. Nat Genet. 2013;45:191–6. doi: 10.1038/ng.2505. [DOI] [PMC free article] [PubMed] [Google Scholar]
- 46.Zeng C, Matsuda K, Jia WH, Chang J, Kweon SS, Xiang YB, et al. Identification of Susceptibility Loci and Genes for Colorectal Cancer Risk. Gastroenterology. 2016;150:1633–45. doi: 10.1053/j.gastro.2016.02.076. [DOI] [PMC free article] [PubMed] [Google Scholar]
- 47.Jiang K, Sun Y, Wang C, Ji J, Li Y, Ye Y, et al. Genome-wide association study identifies two new susceptibility loci for colorectal cancer at 5q23.3 and 17q12 in Han Chinese. Oncotarget. 2015;6:40327–36. doi: 10.18632/oncotarget.5530. [DOI] [PMC free article] [PubMed] [Google Scholar]
- 48.Schmit SL, Schumacher FR, Edlund CK, Conti DV, Ihenacho U, Wan P, et al. Genome-wide association study of colorectal cancer in Hispanics. Carcinogenesis. 2016;37:547–56. doi: 10.1093/carcin/bgw046. [DOI] [PMC free article] [PubMed] [Google Scholar]
- 49.Amos CI, Wu X, Broderick P, Gorlov IP, Gu J, Eisen T, et al. Genome-wide association scan of tag SNPs identifies a susceptibility locus for lung cancer at 15q25.1. Nat Genet. 2008;40:616–22. doi: 10.1038/ng.109. [DOI] [PMC free article] [PubMed] [Google Scholar]
- 50.Liu P, Vikis HG, Wang D, Lu Y, Wang Y, Schwartz AG, et al. Familial aggregation of common sequence variants on 15q24–25.1 in lung cancer. J Natl Cancer Inst. 2008;100:1326–30. doi: 10.1093/jnci/djn268. [DOI] [PMC free article] [PubMed] [Google Scholar]
- 51.Wang Y, Broderick P, Webb E, Wu X, Vijayakrishnan J, Matakidou A, et al. Common 5p15.33 and 6p21.33 variants influence lung cancer risk. Nat Genet. 2008;40:1407–9. doi: 10.1038/ng.273. [DOI] [PMC free article] [PubMed] [Google Scholar]
- 52.McKay JD, Hung RJ, Gaborieau V, Boffetta P, Chabrier A, Byrnes G, et al. Lung cancer susceptibility locus at 5p15.33. Nat Genet. 2008;40:1404–6. doi: 10.1038/ng.254. [DOI] [PMC free article] [PubMed] [Google Scholar]
- 53.Broderick P, Wang Y, Vijayakrishnan J, Matakidou A, Spitz MR, Eisen T, et al. Deciphering the impact of common genetic variation on lung cancer risk: a genome-wide association study. Cancer Res. 2009;69:6633–41. doi: 10.1158/0008-5472.CAN-09-0680. [DOI] [PMC free article] [PubMed] [Google Scholar]
- 54.Wang Y, McKay JD, Rafnar T, Wang Z, Timofeeva MN, Broderick P, et al. Rare variants of large effect in BRCA2 and CHEK2 affect risk of lung cancer. Nat Genet. 2014;46:736–41. doi: 10.1038/ng.3002. [DOI] [PMC free article] [PubMed] [Google Scholar]
- 55.Zanetti KA, Wang Z, Aldrich M, Amos CI, Blot WJ, Bowman ED, et al. Genome-wide association study confirms lung cancer susceptibility loci on chromosomes 5p15 and 15q25 in an African-American population. Lung Cancer. 2016;98:33–42. doi: 10.1016/j.lungcan.2016.05.008. [DOI] [PMC free article] [PubMed] [Google Scholar]
- 56.Shiraishi K, Kunitoh H, Daigo Y, Takahashi A, Goto K, Sakamoto H, et al. A genome-wide association study identifies two new susceptibility loci for lung adenocarcinoma in the Japanese population. Nat Genet. 2012;44:900–3. doi: 10.1038/ng.2353. [DOI] [PubMed] [Google Scholar]
- 57.Landi MT, Chatterjee N, Yu K, Goldin LR, Goldstein AM, Rotunno M, et al. A genome-wide association study of lung cancer identifies a region of chromosome 5p15 associated with risk for adenocarcinoma. Am J Hum Genet. 2009;85:679–91. doi: 10.1016/j.ajhg.2009.09.012. [DOI] [PMC free article] [PubMed] [Google Scholar]
- 58.Miki D, Kubo M, Takahashi A, Yoon KA, Kim J, Lee GK, et al. Variation in TP63 is associated with lung adenocarcinoma susceptibility in Japanese and Korean populations. Nat Genet. 2010;42:893–6. doi: 10.1038/ng.667. [DOI] [PubMed] [Google Scholar]
- 59.Hu Z, Wu C, Shi Y, Guo H, Zhao X, Yin Z, et al. A genome-wide association study identifies two new lung cancer susceptibility loci at 13q12.12 and 22q12.2 in Han Chinese. Nat Genet. 2011;43:792–6. doi: 10.1038/ng.875. [DOI] [PubMed] [Google Scholar]
- 60.Dong J, Jin G, Wu C, Guo H, Zhou B, Lv J, et al. Genome-wide association study identifies a novel susceptibility locus at 12q23.1 for lung squamous cell carcinoma in han chinese. PLoS Genet. 2013;9:e1003190. doi: 10.1371/journal.pgen.1003190. [DOI] [PMC free article] [PubMed] [Google Scholar]
- 61.Wang Z, Seow WJ, Shiraishi K, Hsiung CA, Matsuo K, Liu J, et al. Meta-analysis of genome-wide association studies identifies multiple lung cancer susceptibility loci in never-smoking Asian women. Hum Mol Genet. 2016;25:620–9. doi: 10.1093/hmg/ddv494. [DOI] [PMC free article] [PubMed] [Google Scholar]
- 62.Lan Q, Hsiung CA, Matsuo K, Hong YC, Seow A, Wang Z, et al. Genome-wide association analysis identifies new lung cancer susceptibility loci in never-smoking women in Asia. Nat Genet. 2012;44:1330–5. doi: 10.1038/ng.2456. [DOI] [PMC free article] [PubMed] [Google Scholar]
- 63.Pharoah PD, Tsai YY, Ramus SJ, Phelan CM, Goode EL, Lawrenson K, et al. GWAS meta-analysis and replication identifies three new susceptibility loci for ovarian cancer. Nat Genet. 2013;45:362–70. 70e1–2. doi: 10.1038/ng.2564. [DOI] [PMC free article] [PubMed] [Google Scholar]
- 64.Chen K, Ma H, Li L, Zang R, Wang C, Song F, et al. Genome-wide association study identifies new susceptibility loci for epithelial ovarian cancer in Han Chinese women. Nat Commun. 2014;5:4682. doi: 10.1038/ncomms5682. [DOI] [PubMed] [Google Scholar]
- 65.De Vivo I, Prescott J, Setiawan VW, Olson SH, Wentzensen N, et al. Australian National Endometrial Cancer Study G. Genome-wide association study of endometrial cancer in E2C2. Hum Genet. 2014;133:211–24. doi: 10.1007/s00439-013-1369-1. [DOI] [PMC free article] [PubMed] [Google Scholar]
- 66.Chen MM, O’Mara TA, Thompson DJ, Painter JN, Attia J, et al. Australian National Endometrial Cancer Study G. GWAS meta-analysis of 16 852 women identifies new susceptibility locus for endometrial cancer. Hum Mol Genet. 2016;25:2612–20. doi: 10.1093/hmg/ddw092. [DOI] [PMC free article] [PubMed] [Google Scholar]
- 67.Cheng TH, Thompson DJ, O’Mara TA, Painter JN, Glubb DM, Flach S, et al. Five endometrial cancer risk loci identified through genome-wide association analysis. Nat Genet. 2016;48:667–74. doi: 10.1038/ng.3562. [DOI] [PMC free article] [PubMed] [Google Scholar]
- 68.Spurdle AB, Thompson DJ, Ahmed S, Ferguson K, Healey CS, O’Mara T, et al. Genome-wide association study identifies a common variant associated with risk of endometrial cancer. Nat Genet. 2011;43:451–4. doi: 10.1038/ng.812. [DOI] [PMC free article] [PubMed] [Google Scholar]
- 69.Long J, Zheng W, Xiang YB, Lose F, Thompson D, Tomlinson I, et al. Genome-wide association study identifies a possible susceptibility locus for endometrial cancer. Cancer Epidemiol Biomarkers Prev. 2012;21:980–7. doi: 10.1158/1055-9965.EPI-11-1160. [DOI] [PMC free article] [PubMed] [Google Scholar]
- 70.Chen D, Juko-Pecirep I, Hammer J, Ivansson E, Enroth S, Gustavsson I, et al. Genome-wide association study of susceptibility loci for cervical cancer. J Natl Cancer Inst. 2013;105:624–33. doi: 10.1093/jnci/djt051. [DOI] [PubMed] [Google Scholar]
- 71.Miura K, Mishima H, Kinoshita A, Hayashida C, Abe S, Tokunaga K, et al. Genome-wide association study of HPV-associated cervical cancer in Japanese women. J Med Virol. 2014;86:1153–8. doi: 10.1002/jmv.23943. [DOI] [PubMed] [Google Scholar]
- 72.Shi Y, Li L, Hu Z, Li S, Wang S, Liu J, et al. A genome-wide association study identifies two new cervical cancer susceptibility loci at 4q12 and 17q12. Nat Genet. 2013;45:918–22. doi: 10.1038/ng.2687. [DOI] [PubMed] [Google Scholar]
- 73.Wang M, Li Z, Chu H, Lv Q, Ye D, Ding Q, et al. Genome-Wide Association Study of Bladder Cancer in a Chinese Cohort Reveals a New Susceptibility Locus at 5q12.3. Cancer Res. 2016;76:3277–84. doi: 10.1158/0008-5472.CAN-15-2564. [DOI] [PubMed] [Google Scholar]
- 74.Matsuda K, Takahashi A, Middlebrooks CD, Obara W, Nasu Y, Inoue K, et al. Genome-wide association study identified SNP on 15q24 associated with bladder cancer risk in Japanese population. Hum Mol Genet. 2015;24:1177–84. doi: 10.1093/hmg/ddu512. [DOI] [PMC free article] [PubMed] [Google Scholar]
- 75.Henrion M, Frampton M, Scelo G, Purdue M, Ye Y, Broderick P, et al. Common variation at 2q22.3 (ZEB2) influences the risk of renal cancer. Hum Mol Genet. 2013;22:825–31. doi: 10.1093/hmg/dds489. [DOI] [PMC free article] [PubMed] [Google Scholar]
- 76.Henrion MY, Purdue MP, Scelo G, Broderick P, Frampton M, Ritchie A, et al. Common variation at 1q24.1 (ALDH9A1) is a potential risk factor for renal cancer. PLoS One. 2015;10:e0122589. doi: 10.1371/journal.pone.0122589. [DOI] [PMC free article] [PubMed] [Google Scholar]
- 77.Purdue MP, Ye Y, Wang Z, Colt JS, Schwartz KL, Davis FG, et al. A genome-wide association study of renal cell carcinoma among African Americans. Cancer Epidemiol Biomarkers Prev. 2014;23:209–14. doi: 10.1158/1055-9965.EPI-13-0818. [DOI] [PMC free article] [PubMed] [Google Scholar]
- 78.Wu X, Scelo G, Purdue MP, Rothman N, Johansson M, Ye Y, et al. A genome-wide association study identifies a novel susceptibility locus for renal cell carcinoma on 12p11.23. Human Molecular Genetics. 2011;21:456–62. doi: 10.1093/hmg/ddr479. [DOI] [PMC free article] [PubMed] [Google Scholar]
- 79.Clifford RJ, Zhang J, Meerzaman DM, Lyu MS, Hu Y, Cultraro CM, et al. Genetic variations at loci involved in the immune response are risk factors for hepatocellular carcinoma. Hepatology. 2010;52:2034–43. doi: 10.1002/hep.23943. [DOI] [PMC free article] [PubMed] [Google Scholar]
- 80.Zhang H, Zhai Y, Hu Z, Wu C, Qian J, Jia W, et al. Genome-wide association study identifies 1p36.22 as a new susceptibility locus for hepatocellular carcinoma in chronic hepatitis B virus carriers. Nat Genet. 2010;42:755–8. doi: 10.1038/ng.638. [DOI] [PubMed] [Google Scholar]
- 81.Jiang DK, Sun J, Cao G, Liu Y, Lin D, Gao YZ, et al. Genetic variants in STAT4 and HLA-DQ genes confer risk of hepatitis B virus-related hepatocellular carcinoma. Nat Genet. 2013;45:72–5. doi: 10.1038/ng.2483. [DOI] [PMC free article] [PubMed] [Google Scholar]
- 82.Li S, Qian J, Yang Y, Zhao W, Dai J, Bei JX, et al. GWAS identifies novel susceptibility loci on 6p21.32 and 21q21.3 for hepatocellular carcinoma in chronic hepatitis B virus carriers. PLoS Genet. 2012;8:e1002791. doi: 10.1371/journal.pgen.1002791. [DOI] [PMC free article] [PubMed] [Google Scholar]
- 83.Kumar V, Kato N, Urabe Y, Takahashi A, Muroyama R, Hosono N, et al. Genome-wide association study identifies a susceptibility locus for HCV-induced hepatocellular carcinoma. Nat Genet. 2011;43:455–8. doi: 10.1038/ng.809. [DOI] [PubMed] [Google Scholar]
- 84.Shi Y, Hu Z, Wu C, Dai J, Li H, Dong J, et al. A genome-wide association study identifies new susceptibility loci for non-cardia gastric cancer at 3q13.31 and 5p13.1. Nat Genet. 2011;43:1215–8. doi: 10.1038/ng.978. [DOI] [PubMed] [Google Scholar]
- 85.Abnet CC, Freedman ND, Hu N, Wang Z, Yu K, Shu XO, et al. A shared susceptibility locus in PLCE1 at 10q23 for gastric adenocarcinoma and esophageal squamous cell carcinoma. Nat Genet. 2010;42:764–7. doi: 10.1038/ng.649. [DOI] [PMC free article] [PubMed] [Google Scholar]
- 86.Sakamoto H, Yoshimura K, Saeki N, Katai H, Shimoda T, et al. Study Group of Millennium Genome Project for C. Genetic variation in PSCA is associated with susceptibility to diffuse-type gastric cancer. Nat Genet. 2008;40:730–40. doi: 10.1038/ng.152. [DOI] [PubMed] [Google Scholar]
- 87.Helgason H, Rafnar T, Olafsdottir HS, Jonasson JG, Sigurdsson A, Stacey SN, et al. Loss-of-function variants in ATM confer risk of gastric cancer. Nat Genet. 2015;47:906–10. doi: 10.1038/ng.3342. [DOI] [PubMed] [Google Scholar]
- 88.Hu N, Wang Z, Song X, Wei L, Kim BS, Freedman ND, et al. Genome-wide association study of gastric adenocarcinoma in Asia: a comparison of associations between cardia and non-cardia tumours. Gut. 2016;65:1611–8. doi: 10.1136/gutjnl-2015-309340. [DOI] [PMC free article] [PubMed] [Google Scholar]
- 89.Jin G, Ma H, Wu C, Dai J, Zhang R, Shi Y, et al. Genetic variants at 6p21.1 and 7p15.3 are associated with risk of multiple cancers in Han Chinese. Am J Hum Genet. 2012;91:928–34. doi: 10.1016/j.ajhg.2012.09.009. [DOI] [PMC free article] [PubMed] [Google Scholar]
- 90.Wang Z, Dai J, Hu N, Miao X, Abnet CC, Yang M, et al. Identification of new susceptibility loci for gastric non-cardia adenocarcinoma: pooled results from two Chinese genome-wide association studies. Gut. 2015 doi: 10.1136/gutjnl-2015-310612. [DOI] [PMC free article] [PubMed] [Google Scholar]
- 91.Zhang M, Wang Z, Obazee O, Jia J, Childs EJ, Hoskins J, et al. Three new pancreatic cancer susceptibility signals identified on chromosomes 1q32.1, 5p15.33 and 8q24.21. Oncotarget. 2016;7:66328–43. doi: 10.18632/oncotarget.11041. [DOI] [PMC free article] [PubMed] [Google Scholar]
- 92.Low SK, Kuchiba A, Zembutsu H, Saito A, Takahashi A, Kubo M, et al. Genome-wide association study of pancreatic cancer in Japanese population. PLoS One. 2010;5:e11824. doi: 10.1371/journal.pone.0011824. [DOI] [PMC free article] [PubMed] [Google Scholar]
- 93.Wu C, Miao X, Huang L, Che X, Jiang G, Yu D, et al. Genome-wide association study identifies five loci associated with susceptibility to pancreatic cancer in Chinese populations. Nat Genet. 2011;44:62–6. doi: 10.1038/ng.1020. [DOI] [PubMed] [Google Scholar]
- 94.Childs EJ, Mocci E, Campa D, Bracci PM, Gallinger S, Goggins M, et al. Common variation at 2p13.3, 3q29, 7p13 and 17q25.1 associated with susceptibility to pancreatic cancer. Nat Genet. 2015;47:911–6. doi: 10.1038/ng.3341. [DOI] [PMC free article] [PubMed] [Google Scholar]
- 95.Levine DM, Ek WE, Zhang R, Liu X, Onstad L, Sather C, et al. A genome-wide association study identifies new susceptibility loci for esophageal adenocarcinoma and Barrett’s esophagus. Nat Genet. 2013;45:1487–93. doi: 10.1038/ng.2796. [DOI] [PMC free article] [PubMed] [Google Scholar]
- 96.Cui R, Kamatani Y, Takahashi A, Usami M, Hosono N, Kawaguchi T, et al. Functional variants in ADH1B and ALDH2 coupled with alcohol and smoking synergistically enhance esophageal cancer risk. Gastroenterology. 2009;137:1768–75. doi: 10.1053/j.gastro.2009.07.070. [DOI] [PubMed] [Google Scholar]
- 97.Wu C, Hu Z, He Z, Jia W, Wang F, Zhou Y, et al. Genome-wide association study identifies three new susceptibility loci for esophageal squamous-cell carcinoma in Chinese populations. Nat Genet. 2011;43:679–84. doi: 10.1038/ng.849. [DOI] [PubMed] [Google Scholar]
- 98.Wang LD, Zhou FY, Li XM, Sun LD, Song X, Jin Y, et al. Genome-wide association study of esophageal squamous cell carcinoma in Chinese subjects identifies susceptibility loci at PLCE1 and C20orf54. Nat Genet. 2010;42:759–63. doi: 10.1038/ng.648. [DOI] [PubMed] [Google Scholar]
- 99.Wu C, Wang Z, Song X, Feng XS, Abnet CC, He J, et al. Joint analysis of three genome-wide association studies of esophageal squamous cell carcinoma in Chinese populations. Nat Genet. 2014;46:1001–6. doi: 10.1038/ng.3064. [DOI] [PMC free article] [PubMed] [Google Scholar]
- 100.Abnet CC, Wang Z, Song X, Hu N, Zhou FY, Freedman ND, et al. Genotypic variants at 2q33 and risk of esophageal squamous cell carcinoma in China: a meta-analysis of genome-wide association studies. Hum Mol Genet. 2012;21:2132–41. doi: 10.1093/hmg/dds029. [DOI] [PMC free article] [PubMed] [Google Scholar]
- 101.Lesseur C, Diergaarde B, Olshan AF, Wunsch-Filho V, Ness AR, Liu G, et al. Genome-wide association analyses identify new susceptibility loci for oral cavity and pharyngeal cancer. Nat Genet. 2016;48:1544–50. doi: 10.1038/ng.3685. [DOI] [PMC free article] [PubMed] [Google Scholar]
- 102.Tang M, Lautenberger JA, Gao X, Sezgin E, Hendrickson SL, Troyer JL, et al. The principal genetic determinants for nasopharyngeal carcinoma in China involve the HLA class I antigen recognition groove. PLoS Genet. 2012;8:e1003103. doi: 10.1371/journal.pgen.1003103. [DOI] [PMC free article] [PubMed] [Google Scholar]
- 103.Bei JX, Li Y, Jia WH, Feng BJ, Zhou G, Chen LZ, et al. A genome-wide association study of nasopharyngeal carcinoma identifies three new susceptibility loci. Nat Genet. 2010;42:599–603. doi: 10.1038/ng.601. [DOI] [PubMed] [Google Scholar]
- 104.Tse KP, Su WH, Chang KP, Tsang NM, Yu CJ, Tang P, et al. Genome-wide association study reveals multiple nasopharyngeal carcinoma-associated loci within the HLA region at chromosome 6p21.3. Am J Hum Genet. 2009;85:194–203. doi: 10.1016/j.ajhg.2009.07.007. [DOI] [PMC free article] [PubMed] [Google Scholar]
- 105.Ng CC, Yew PY, Puah SM, Krishnan G, Yap LF, Teo SH, et al. A genome-wide association study identifies ITGA9 conferring risk of nasopharyngeal carcinoma. J Hum Genet. 2009;54:392–7. doi: 10.1038/jhg.2009.49. [DOI] [PubMed] [Google Scholar]
- 106.Chin YM, Mushiroda T, Takahashi A, Kubo M, Krishnan G, Yap LF, et al. HLA-A SNPs and amino acid variants are associated with nasopharyngeal carcinoma in Malaysian Chinese. Int J Cancer. 2015;136:678–87. doi: 10.1002/ijc.29035. [DOI] [PubMed] [Google Scholar]
- 107.Cui Q, Feng QS, Mo HY, Sun J, Xia YF, Zhang H, et al. An extended genome-wide association study identifies novel susceptibility loci for nasopharyngeal carcinoma. Hum Mol Genet. 2016;25:3626–34. doi: 10.1093/hmg/ddw200. [DOI] [PubMed] [Google Scholar]
- 108.Bei JX, Su WH, Ng CC, Yu K, Chin YM, Lou PJ, et al. A GWAS Meta-analysis and Replication Study Identifies a Novel Locus within CLPTM1L/TERT Associated with Nasopharyngeal Carcinoma in Individuals of Chinese Ancestry. Cancer Epidemiol Biomarkers Prev. 2016;25:188–92. doi: 10.1158/1055-9965.EPI-15-0144. [DOI] [PMC free article] [PubMed] [Google Scholar]
- 109.Wei Q, Yu D, Liu M, Wang M, Zhao M, Liu M, et al. Genome-wide association study identifies three susceptibility loci for laryngeal squamous cell carcinoma in the Chinese population. Nat Genet. 2014;46:1110–4. doi: 10.1038/ng.3090. [DOI] [PubMed] [Google Scholar]
- 110.Frampton M, da Silva Filho MI, Broderick P, Thomsen H, Forsti A, Vijayakrishnan J, et al. Variation at 3p24.1 and 6q23.3 influences the risk of Hodgkin’s lymphoma. Nat Commun. 2013;4:2549. doi: 10.1038/ncomms3549. [DOI] [PMC free article] [PubMed] [Google Scholar]
- 111.Cozen W, Timofeeva MN, Li D, Diepstra A, Hazelett D, Delahaye-Sourdeix M, et al. A meta-analysis of Hodgkin lymphoma reveals 19p13.3 TCF3 as a novel susceptibility locus. Nat Commun. 2014;5:3856. doi: 10.1038/ncomms4856. [DOI] [PMC free article] [PubMed] [Google Scholar]
- 112.Mitchell JS, Li N, Weinhold N, Forsti A, Ali M, van Duin M, et al. Genome-wide association study identifies multiple susceptibility loci for multiple myeloma. Nat Commun. 2016;7:12050. doi: 10.1038/ncomms12050. [DOI] [PMC free article] [PubMed] [Google Scholar]
- 113.Vijayakrishnan J, Kumar R, Henrion MY, Moorman AV, Rachakonda PS, Hosen I, et al. A genome-wide association study identifies risk loci for childhood acute lymphoblastic leukemia at 10q26.13 and 12q23.1. Leukemia. 2016 doi: 10.1038/leu.2016.271. [DOI] [PMC free article] [PubMed] [Google Scholar]
- 114.Tan DE, Foo JN, Bei JX, Chang J, Peng R, Zheng X, et al. Genome-wide association study of B cell non-Hodgkin lymphoma identifies 3q27 as a susceptibility locus in the Chinese population. Nat Genet. 2013;45:804–7. doi: 10.1038/ng.2666. [DOI] [PubMed] [Google Scholar]
- 115.Li Z, Xia Y, Feng LN, Chen JR, Li HM, Cui J, et al. Genetic risk of extranodal natural killer T-cell lymphoma: a genome-wide association study. Lancet Oncol. 2016;17:1240–7. doi: 10.1016/S1470-2045(16)30148-6. [DOI] [PMC free article] [PubMed] [Google Scholar]
- 116.Kim DH, Lee ST, Won HH, Kim S, Kim MJ, Kim HJ, et al. A genome-wide association study identifies novel loci associated with susceptibility to chronic myeloid leukemia. Blood. 2011;117:6906–11. doi: 10.1182/blood-2011-01-329797. [DOI] [PubMed] [Google Scholar]
- 117.Han S, Lee KM, Park SK, Lee JE, Ahn HS, Shin HY, et al. Genome-wide association study of childhood acute lymphoblastic leukemia in Korea. Leuk Res. 2010;34:1271–4. doi: 10.1016/j.leukres.2010.02.001. [DOI] [PubMed] [Google Scholar]
- 118.Shi Y, Du M, Fang Y, Tong N, Zhai X, Sheng X, et al. Identification of a novel susceptibility locus at 16q23.1 associated with childhood acute lymphoblastic leukemia in Han Chinese. Hum Mol Genet. 2016;25:2873–80. doi: 10.1093/hmg/ddw112. [DOI] [PubMed] [Google Scholar]
- 119.Xu H, Yang W, Perez-Andreu V, Devidas M, Fan Y, Cheng C, et al. Novel susceptibility variants at 10p12.31-12.2 for childhood acute lymphoblastic leukemia in ethnically diverse populations. J Natl Cancer Inst. 2013;105:733–42. doi: 10.1093/jnci/djt042. [DOI] [PMC free article] [PubMed] [Google Scholar]
- 120.Cha PC, Zembutsu H, Takahashi A, Kubo M, Kamatani N, Nakamura Y. A genome-wide association study identifies SNP in DCC is associated with gallbladder cancer in the Japanese population. J Hum Genet. 2012;57:235–7. doi: 10.1038/jhg.2012.9. [DOI] [PubMed] [Google Scholar]
- 121.Henley SJ, Weir HK, Jim MA, Watson M, Richardson LC. Gallbladder Cancer Incidence and Mortality, United States 1999–2011. Cancer Epidemiology Biomarkers & Prevention. 2015;24:1319–26. doi: 10.1158/1055-9965.EPI-15-0199. [DOI] [PubMed] [Google Scholar]
- 122.Wrensch M, Jenkins RB, Chang JS, Yeh RF, Xiao Y, Decker PA, et al. Variants in the CDKN2B and RTEL1 regions are associated with high-grade glioma susceptibility. Nat Genet. 2009;41:905–8. doi: 10.1038/ng.408. [DOI] [PMC free article] [PubMed] [Google Scholar]
- 123.Kinnersley B, Labussiere M, Holroyd A, Di Stefano AL, Broderick P, Vijayakrishnan J, et al. Genome-wide association study identifies multiple susceptibility loci for glioma. Nat Commun. 2015;6:8559. doi: 10.1038/ncomms9559. [DOI] [PMC free article] [PubMed] [Google Scholar]
- 124.Walsh KM, Codd V, Smirnov IV, Rice T, Decker PA, Hansen HM, et al. Variants near TERT and TERC influencing telomere length are associated with high-grade glioma risk. Nat Genet. 2014;46:731–5. doi: 10.1038/ng.3004. [DOI] [PMC free article] [PubMed] [Google Scholar]
- 125.Shete S, Hosking FJ, Robertson LB, Dobbins SE, Sanson M, Malmer B, et al. Genome-wide association study identifies five susceptibility loci for glioma. Nat Genet. 2009;41:899–904. doi: 10.1038/ng.407. [DOI] [PMC free article] [PubMed] [Google Scholar]
- 126.Sanson M, Hosking FJ, Shete S, Zelenika D, Dobbins SE, Ma Y, et al. Chromosome 7p11.2 (EGFR) variation influences glioma risk. Hum Mol Genet. 2011;20:2897–904. doi: 10.1093/hmg/ddr192. [DOI] [PMC free article] [PubMed] [Google Scholar]
- 127.Dubrow R, Darefsky AS. Demographic variation in incidence of adult glioma by subtype, United States, 1992–2007. BMC cancer. 2011;11:325. doi: 10.1186/1471-2407-11-325. [DOI] [PMC free article] [PubMed] [Google Scholar]
- 128.Law MH, Bishop DT, Lee JE, Brossard M, Martin NG, Moses EK, et al. Genome-wide meta-analysis identifies five new susceptibility loci for cutaneous malignant melanoma. Nat Genet. 2015;47:987–95. doi: 10.1038/ng.3373. [DOI] [PMC free article] [PubMed] [Google Scholar]
- 129.Chahal HS, Lin Y, Ransohoff KJ, Hinds DA, Wu W, Dai HJ, et al. Genome-wide association study identifies novel susceptibility loci for cutaneous squamous cell carcinoma. Nat Commun. 2016;7:12048. doi: 10.1038/ncomms12048. [DOI] [PMC free article] [PubMed] [Google Scholar]
- 130.Chahal HS, Wu W, Ransohoff KJ, Yang L, Hedlin H, Desai M, et al. Genome-wide association study identifies 14 novel risk alleles associated with basal cell carcinoma. Nat Commun. 2016;7:12510. doi: 10.1038/ncomms12510. [DOI] [PMC free article] [PubMed] [Google Scholar]
- 131.Gudmundsson J, Sulem P, Gudbjartsson DF, Jonasson JG, Sigurdsson A, Bergthorsson JT, et al. Common variants on 9q22.33 and 14q13.3 predispose to thyroid cancer in European populations. Nat Genet. 2009;41:460–4. doi: 10.1038/ng.339. [DOI] [PMC free article] [PubMed] [Google Scholar]
- 132.Gudmundsson J, Sulem P, Gudbjartsson DF, Jonasson JG, Masson G, He H, et al. Discovery of common variants associated with low TSH levels and thyroid cancer risk. Nat Genet. 2012;44:319–22. doi: 10.1038/ng.1046. [DOI] [PMC free article] [PubMed] [Google Scholar]
- 133.Kohler A, Chen B, Gemignani F, Elisei R, Romei C, Figlioli G, et al. Genome-wide association study on differentiated thyroid cancer. J Clin Endocrinol Metab. 2013;98:E1674–81. doi: 10.1210/jc.2013-1941. [DOI] [PubMed] [Google Scholar]
- 134.Bustamante CD, Burchard EG, De la Vega FM. Genomics for the world. Nature. 2011;475:163–5. doi: 10.1038/475163a. [DOI] [PMC free article] [PubMed] [Google Scholar]
- 135.Parkin DM, Bray F, Ferlay J, Pisani P. Global Cancer Statistics, 2002. CA: A Cancer Journal for Clinicians. 2005;55:74–108. doi: 10.3322/canjclin.55.2.74. [DOI] [PubMed] [Google Scholar]
- 136.Wood AR, Perry JRB, Tanaka T, Hernandez DG, Zheng H-F, Melzer D, et al. Imputation of Variants from the 1000 Genomes Project Modestly Improves Known Associations and Can Identify Low-frequency Variant - Phenotype Associations Undetected by HapMap Based Imputation. PLOS ONE. 2013;8:e64343. doi: 10.1371/journal.pone.0064343. [DOI] [PMC free article] [PubMed] [Google Scholar]
- 137.Hancock DB, Levy JL, Gaddis NC, Bierut LJ, Saccone NL, Page GP, et al. Assessment of Genotype Imputation Performance Using 1000 Genomes in African American Studies. PLOS ONE. 2012;7:e50610. doi: 10.1371/journal.pone.0050610. [DOI] [PMC free article] [PubMed] [Google Scholar]
- 138.Bien SA, Wojcik GL, Zubair N, Gignoux CR, Martin AR, Kocarnik JM, et al. Strategies for Enriching Variant Coverage in Candidate Disease Loci on a Multiethnic Genotyping Array. PLoS One. 2016;11:e0167758. doi: 10.1371/journal.pone.0167758. [DOI] [PMC free article] [PubMed] [Google Scholar]
- 139.Chen GK, Millikan RC, John EM, Ambrosone CB, Bernstein L, Zheng W, et al. The potential for enhancing the power of genetic association studies in African Americans through the reuse of existing genotype data. PLoS Genet. 2010;6:e1001096. doi: 10.1371/journal.pgen.1001096. [DOI] [PMC free article] [PubMed] [Google Scholar]
- 140.Kelemen LE, Lawrenson K, Tyrer J, Li Q, Lee JM, Seo JH, et al. Genome-wide significant risk associations for mucinous ovarian carcinoma. Nat Genet. 2015;47:888–97. doi: 10.1038/ng.3336. [DOI] [PMC free article] [PubMed] [Google Scholar]
- 141.Conde L, Halperin E, Akers NK, Brown KM, Smedby KE, Rothman N, et al. Genome-wide association study of follicular lymphoma identifies a risk locus at 6p21.32. Nat Genet. 2010;42:661–4. doi: 10.1038/ng.626. [DOI] [PMC free article] [PubMed] [Google Scholar]
- 142.Li Q, Stram A, Chen C, Kar S, Gayther S, Pharoah P, et al. Expression QTL-based analyses reveal candidate causal genes and loci across five tumor types. Hum Mol Genet. 2014;23:5294–302. doi: 10.1093/hmg/ddu228. [DOI] [PMC free article] [PubMed] [Google Scholar]
- 143.Consortium GT. The Genotype-Tissue Expression (GTEx) project. Nat Genet. 2013;45:580–5. doi: 10.1038/ng.2653. [DOI] [PMC free article] [PubMed] [Google Scholar]
- 144.Cai Q, Long J, Lu W, Qu S, Wen W, Kang D, et al. Genome-wide association study identifies breast cancer risk variant at 10q21.2: results from the Asia Breast Cancer Consortium. Human Molecular Genetics. 2011;20:4991–9. doi: 10.1093/hmg/ddr405. [DOI] [PMC free article] [PubMed] [Google Scholar]
- 145.Xuan D, Li G, Cai Q, Deming-Halverson S, Shrubsole MJ, Shu X-O, et al. APOBEC3 deletion polymorphism is associated with breast cancer risk among women of European ancestry. Carcinogenesis. 2013;34:2240–3. doi: 10.1093/carcin/bgt185. [DOI] [PMC free article] [PubMed] [Google Scholar]
- 146.Yoon K-A, Park JH, Han J, Park S, Lee GK, Han J-Y, et al. A genome-wide association study reveals susceptibility variants for non-small cell lung cancer in the Korean population. Human Molecular Genetics. 2010;19:4948–54. doi: 10.1093/hmg/ddq421. [DOI] [PubMed] [Google Scholar]
- 147.Qin B, Moorman PG, Alberg AJ, Barnholtz-Sloan JS, Bondy M, Cote ML, et al. Dairy, calcium, vitamin D and ovarian cancer risk in African-American women. Br J Cancer. 2016;115:1122–30. doi: 10.1038/bjc.2016.289. [DOI] [PMC free article] [PubMed] [Google Scholar]
- 148.Rand KA, Song C, Dean E, Serie DJ, Curtin K, Sheng X, et al. A Meta-analysis of Multiple Myeloma Risk Regions in African and European Ancestry Populations Identifies Putatively Functional Loci. Cancer Epidemiology Biomarkers & Prevention. 2016;25:1609–18. doi: 10.1158/1055-9965.EPI-15-1193. [DOI] [PMC free article] [PubMed] [Google Scholar]