Abstract
Background and Purpose
Protein tyrosine phosphatase 1B (PTP1B) negatively regulates insulin signalling by tyrosine dephosphorylation of the insulin receptor. It is a highly validated target for type 2 diabetes therapeutics. Here, the anti‐diabetic effects of HPN were evaluated in the diabetic BKS db mice.
Experimental Approach
The mode of inhibition of PTP1B by HPN was determined according to the Lineweaver–Burk plot. A surface plasmon resonance assay and molecular docking were used to study the interaction between HPN and PTP1B. C2C12 skeletal muscle cells were used to investigate the cell permeability of HPN and the effect of HPN on insulin signalling pathways. Long‐term effects of HPN on glycaemic control were investigated in diabetic BKS db mice. Glycogen contents in liver and muscle were determined. Furthermore, changes in the number of beta cells were evaluated by Gomori staining.
Key Results
HPN was identified as a specific PTP1B inhibitor. HPN directly interacted with PTP1B by binding to the catalytic domain through hydrogen bonds in a competitive mode. Approximately 56.98% of HPN entered into the cultured C2C12 myotubes. HPN ameliorated the impaired insulin signalling in palmitate‐treated C2C12 myocytes. Notably, oral administration of HPN significantly protected mice from hyperglycaemia, dyslipidemia and hyperinsulinaemia. HPN also enhanced the storage of glycogen in liver and muscle. Moreover, HPN obviously improved the beta cell numbers of the pancreatic islets.
Conclusion and Implications
Our results indicate that HPN is a specific PTP1B inhibitor, with anti‐diabetic properties and good cell permeability and oral availability.
Abbreviations
- BKS db
BKS.Cg‐Dock7m+/+Leprdb/J
- BKS
C57BLKS/J
- GHb
glycosylated haemoglobin
- GSA
glycosylated serum albumin
- InsR
insulin receptor
- IRS
insulin receptor substrate
- PA
palmitic acid
- PTP1B
protein tyrosine phosphatase 1B
- PTPs
protein tyrosine phosphatases
- SPR
surface plasmon resonance
- T2DM
type 2 diabetes mellitus
- TC
total cholesterol
- TG
triglyceride
Introduction
Type 2 diabetes mellitus (T2DM) has become an epidemic. The diabetic population is estimated to reach upwards of 552 million by 2030 (Olokoba et al., 2012). T2DM accounts for about 90% of all diabetic cases, which is characterized by insulin resistance and beta cell dysfunction (Goldstein, 2002). Current therapies cannot meet all needs of T2DM treatment and are often ineffective. Hence, there is an urgent need for safer and more effective therapeutic agents.
Target‐based drug discovery has become the dominant strategy in the modern pharmaceutical industry (Samsdodd, 2005). Protein tyrosine phosphatase 1B (PTP1B) is a highly validated target for T2DM therapeutics for the following reasons. Firstly, biochemical and cellular studies have shown that PTP1B is a negative regulator of insulin signalling by catalysing the dephosphorylation of tyrosine residues in the insulin receptor (InsR) subunit and insulin receptor substrate (IRS) (Ahmad et al., 1995; Seely et al., 1996; Chen et al., 1997; Byon et al., 1998). Secondly, PTP1B‐null mice are healthy and fertile with enhanced insulin sensitivity. On a high‐fat diet, PTP1B‐null mice were resistant to weight gain (Elchebly et al., 1999; Klaman et al., 2000). A set of studies in tissue‐specific PTP1B‐knockdown mice have also demonstrated that PTP1B has a major role in modulating insulin sensitivity, glucose homeostasis and lipid metabolism (Haj et al., 2005; Delibegovic et al., 2007, 2009; Grant et al., 2013; Owen et al., 2013). Third, PTP1B‐targeting anti‐sense oligonucleotides (Rondinone et al., 2002; Zinker et al., 2002) and small molecule inhibitors (Fukuda et al., 2010; Ding et al., 2014; Zhang et al., 2016b) have been shown to have potent anti‐diabetic and anti‐obesity effects both in vivo and in vitro. Unfortunately, although numerous synthesized and natural PTP1B inhibitors have been reported, no compounds have as yet entered the global pharmaceutical market. Only ISIS‐PTP1BRx has entered phase 2 clinical trials (Mittermayer et al., 2016). The major obstacle is the discovery of PTP1B‐specific, cell permeable and orally bioavailable inhibitors (Combs, 2010).
HPN is a synthetic bromophenol analogue of BPN, which is isolated from the marine red alga Rhodomela confervoides. The structures of these two compounds are shown in Figure 1. Preliminary findings showed that HPN had a hypoglycaemic effect (Shi et al., 2013). Here, we further improved the experimental protocol to more specifically monitor the dynamic changes of the anti‐diabetic properties of HPN in mice with a BKS background. In the present study, we showed that HPN is a specific PTP1B inhibitor, and can act as a cell permeable and orally active anti‐diabetic compound. We demonstrated that HPN has the potential to induce long‐term glycaemic control and lipid‐lowering effects in diabetic BKS db mice. We also found that HPN enhanced the glycogen content of muscle and liver and increased the number of beta cells. Moreover, the molecular mechanisms of HPN were further clarified in C2C12 myocytes.
Figure 1.
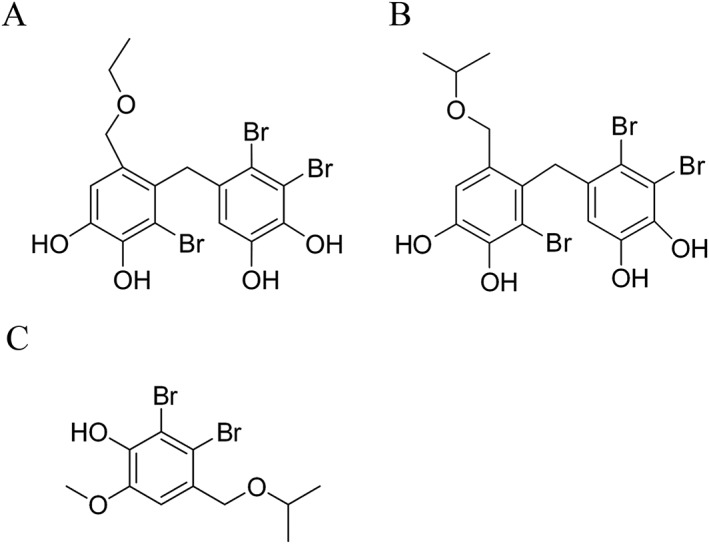
Chemical structures of BPN (A), HPN (B) and an internal standard (C).
Methods
Recombinant hPTP1B1–321 plasmid construction
The expression plasmid that encodes human PTP1B1–321 with an N‐terminal six‐histidine tag was constructed according to the following method. Briefly, 800 ng of human total RNA was reverse transcribed to cDNA using M‐MLV transcriptase and oligo (dT) primers. cDNA was subsequently subjected to the second step PCR with the following primers: 5′‐GTAGGATCCATGGAGATGGAAAAGGAGTTCG‐3′ and 5′‐ATAGTTTAGCGGCCGCCTAATTGTGTGGCTCCAGG‐3′. Then the PCR products were digested with BamHI and NotI and cloned to the pET28‐a(+) vector. The sequence of the recombinant plasmid was verified by Sanger sequencing.
Recombinant hPTP1B1–321 purification
The expression plasmid pET28‐a(+)‐hPTP1B1–321 was transformed into Rosetta (DE3) competent cells and cultured at 37°C to OD600 = 0.8–1. Then 0.5 M IPTG was added to induce protein expression at 18°C overnight. Cells were broken by sonication in buffer A (50 mM Tris–HCl, pH 8, 500 mM NaCl). Cell lysis was loaded onto a HisTrap HP column and eluted with linear gradient buffer A with imidazole from 25 to 400 mM. Fractions containing protein were diluted in 25 mM HEPES‐K (pH 7.6) to a salt concentration of 125 mM and loaded onto a HiTrap Heparin column. The protein content was eluted with a linear gradient buffer containing KCl from 125 mM to 1 M. Fractions containing protein were collected and concentrated by a centrifugal filter unit.
Determination of mode of inhibition of PTP1B
The reagent 4‐nitrophenyl phosphate disodium salt (p‐NPP) was used as a substrate to measure PTP1B activity. HPN was pre‐incubated with the recombinant hPTP1B1–321 at room temperature for 5 min. Then the assay was performed in a final volume of 100 μL containing 10 mM Tris–Hcl (pH 7.5), 25 mM NaCl, 1 mM EDTA in a 96‐well plate at 37°C for 10 min. The amount of p‐nitrophenol was determined by reading the absorbance at 405 nm in a microplate reader (Tecan, Mannedorf, Switzerland). The 1/[S] and 1/[V] values were obtained from the substrate concentration and initial reaction rate in the presence of 0.5, 1, 2, 4 and 8 μM HPN and were plotted on the x‐axis and y‐axis respectively. The inhibitory mode was determined from the intersection characteristics of the approximate lines obtained.
Surface plasmon resonance (SPR) and enzyme immobilization
SPR experiments were carried out using a Biacore T200 SPR spectrometer from GE Healthcare Life Sciences. Human PTP1B1–321 (final concentration 50 μg·mL−1) was dissolved in 10 mM sodium acetate buffer (pH 4.56) and immobilized to a CM5 chip using an amine coupling method. Briefly, using a flow rate of 10 μL·min−1, the surface of flow cell was activated for 7 min using a 1:1 mixture of 0.2 M N‐ethyl‐N′‐(dimethylaminopropyl)‐carbodiimide (EDC) and 0.05 M N‐hydroxysuccinimide (NHS), and subsequently, hPTP1B1–321 was injected over the surface for 7 min using a Time and Flow method [final immobilization level: 11 364 response units (RU)]. Excess reactive esters on the sensor chip surface were blocked with 1 M ethanolamine (pH 8.5) for 7 min. The flow cell used for reference was activated and blocked as described above but remained uncoupled. Binding was expressed as relative unit (RU), which is defined as the response obtained from the flow cell containing the immobilized receptor minus the response obtained from the reference flow cell.
Molecular docking
Docking studies were performed based on the method described previously (Zhang et al., 2016a) by using SYBYL‐X 2.0 software and the crystal structure of PTP1B(1QXK). The HPN molecular structures were drawn using the standard parameters of SYBYL‐X, then their geometric conformations were energy minimized employing the Tripos force field for 1000 steps, and Gasteiger‐Huckel charges were calculated. Protein receptor was prepared by removing the ligand and all water molecules. The active‐site radius was set equal to 5 Å. The compound HPN was docked into the PTP1B model using SYBYL‐X 2.0 with the standard default settings.
Oxygen‐free radical scavenging assay
The antioxidant activity of HPN was assessed by the ability of HPN to scavenge 2,2‐diphenyl‐1‐picrylhydrazyl (DPPH) free radicals. Different concentrations of HPN were allowed to react with DPPH for 30 min at room temperature. DPPH‐free radical scavenging activity was monitored by measuring the decline in absorbance at 519 nm.
Cell treatment and Western blotting
C2C12 cells were purchased from COBIOER BIOSCIENCES (Nanjing, Jiangsu, China). Cells were cultured in DMEM supplemented with 10% FBS, 100 U·mL−1 penicillin and 100 μg·mL−1 streptomycin. Briefly, 4 × 10⁵ C2C12 cells were seeded in a six‐well cell plate. When cells reached confluence, 2% horse serum (HS) was added to induce myotube differentiation for 4 days.
Then C2C12 myotubes were treated with 0.75 mM palmitic acid (PA) (conjugated with fatty acid‐free BSA) for 16 h in the presence or absence of HPN followed by 5 min of insulin (100 nM) treatment. Then the cells were lysed with ice‐cold RIPA buffer (Solaibo, Beijing, China) containing freshly added PMSF. Protein concentration was determined using the BCA Protein Assay Kit. Cell lysates were separated by SDS‐PAGE and transferred onto a PVDF membrane (Millipore, Billerica, MA, USA). The membranes were blocked with 5% non‐fat milk in 1× Tris‐buffered saline containing 0.05% Tween 20 (TBST) for 1 h at room temperature and were then incubated overnight at 4°C with a primary antibody. The following day, the membranes were washed with TBST, three times, and were probed with a secondary antibody. The bands were detected using Pierce™ ECL Western Blotting Substrate (Thermo Scientific, Waltham, MA, USA).
Cell permeability of HPN
The permeability of HPN was assayed in C2C12 myotubes by HPLC, as described previously with some modifications (Bono et al., 2013). Differentiated C2C12 myotubes were treated with HPN (0.1 μmol, the final concentration was 10 μM) and subsequently incubated for 8 h at 37°C. Then the myotubes were washed with PBS and fixed with methanol. Cells were collected by scraping and fully lysed by subjecting them to ultrasound treatment. Equal amounts of the internal standard (0.1 μmol) was added, and then cell debris was removed by filtration (The structure of the internal standard is shown in Figure 1C). The resulting solution was evaporated under reduced pressure, and the residue was dissolved in methanol (100 μL) for subsequent HPLC analysis (π‐Nap, 45% ACN/H2O + 0.05% TFA). Lysed cells treated with DMSO were used as a control.
Animal studies
Animals
Six‐ to eight‐week‐old male BKS.Cg‐Dock7m+/+Leprdb/J mice (BKS db, the Jackson Laboratory stock number 000642) and their lean C57BLKS/J (BKS, the Jackson Laboratory stock number 000662) wild‐type controls were obtained from the Model Animal Research Centre of Nanjing University (MARC). Mice were fed a normal chow diet.
Validity
BKS db mice are used to model phases I to III of diabetes type II and obesity. Mice with BKS background show an uncontrolled rise in blood sugar and severe depletion of insulin‐producing beta cells of the pancreatic islets.
Housing and husbandary
Mice were housed in isolated ventilated cages in a specific pathogen‐free room with controlled temperature (24 ± 2°C), humidity (60–80%) and lighting (12 h light/dark cycle), ad libitum access to water and diet. All mice were given 1 week to acclimatize to the housing conditions before study.
Ethical statement
Animal studies are reported in compliance with the ARRIVE guidelines (Kilkenny et al., 2010; McGrath and Lilley, 2015). All animal experiments were performed in accordance with the guidelines established by Institute of Oceanology committees for care and use of laboratory animals. Efforts were made to minimize animal suffering.
Blinding
The drugs (vehicle, metformin and different concentrations of HPN) were prepared and numbered by the designer. The operator was blinded to the drug treatments.
Study in BKS db mice
After 1 week of acclimatization, plasma glucose levels of all BKS db mice were verified. BKS db mice were randomly divided into three groups (n = 8): model control group (BKS db), metformin‐treated group (80 mg·kg−1 body wt·day−1) and HPN‐treated group (80 mg·kg−1 body wt·day−1). Age‐matched male BKS mice were used as the normal control (n = 8). Glucose levels were assessed in tail blood every week using an Accu‐Chek Performa glucometer (Roche, Germany). For the triglyceride (TG) and total cholesterol (TC) levels, blood samples were collected every 2 weeks from the orbital venous plexus and centrifuged (1301 × g, 10 min, 4°C) to separate serum. TG and TC levels were measured by an enzymatic method (Zhejiang Dongou Diagnostic Products Co., Ltd, China). The insulin levels were determined using an Insulin Assay Kit (Nanjing Jiancheng Bioengineering Institute, China). For glycosylated haemoglobin (GHb) and glycosylated serum albumin (GSA) levels, at the end of the eighth week, mice were fasted overnight and blood samples were collected. GHb concentration was measured by use of a GHb assay kit (Nanjing Jiancheng Bioengineering Institute, China). The GSA levels were determined using a Glycosylated serum protein assay kit (Nanjing Jiancheng Bioengineering Institute, China).
Glycogen levels in BKS db mice
Mice were anaesthetised with isoflurane and killed by decapitation. The liver and quadriceps femoris muscle were dissected for glycogen level analysis. Then the glycogen content was analysed by a liver/muscle glycogen assay kit (Nanjing Jiangcheng Bioengineering Institute, Nanjing, China).
Histology
After the 8 week treatment period, mice were killed and the pancreas and liver tissues were isolated, fixed with formalin and embedded in paraffin. Then, 5 μm sections of the tissues were prepared for analysis. Specimens were stained with haematoxylin and eosin (H&E) to identify morphological changes. Other pancreas specimens were stained with Gomori to detect beta cells of islets. Tissue sections were observed using a light microscope (Nikon, Tokyo, Japan).
Oral acute toxicity study in ICR mice
ICR mice (the Jackson Laboratory stock number 009122) were used to test the in vivo safety of HPN. Twenty ICR male and female mice were obtained from the Shanghai Lab. Animal Research Center (Shanghai, China) with a body weight ranging from 18 to 22 g. The animals were housed in a temperature‐controlled animal room (24 ± 2°C) with a relative humidity of 60–80%. All mice were fasted overnight but given water ad libitum prior to dosage.
Animals were divided into two groups with 10 males and 10 females at random. HPN was dissolved in 0.5% CMC‐Na/2% Tween‐80 and administered p.o. twice a day by gavage at doses of 1.6 and 3.2 g·kg‐1. Their general behaviour, signs of toxicity and mortality were recorded for 14 days after the administration of HPN.
Statistical analysis
The data and statistical analysis comply with the recommendations on experimental design and analysis in pharmacology (Curtis et al., 2015). All data are presented as mean ± SD values. Statistical differences between the model and drug‐treatment groups were analysed with one‐way ANOVA followed by Tukey's post hoc test. The difference between the control and model groups was analysed using Student's t‐test. For all the analyses, P < 0.05 was considered significant. GraphPad Prism 6.0 software was used for all statistical evaluations.
Materials
HPN (3,4‐dibromo‐5‐(2‐bromo‐3,4‐dihydroxy‐6‐isopropoxymethyl benzyl)benzene‐1,2‐diol) was synthesized and identified by our lab (purity 98%). Metformin, insulin, palmitic acid and fatty acid‐free BSA were purchased from Sigma‐Aldrich (St. Louis, MO, USA). RNAiso Plus, PrimerScriptTM RT reagent Kit and SYBR Premix Ex TaqTM II were bought from Takara (Dalian, Liaoning, China). Ni‐NTA agarose resin was purchased from Qiagen (Hildon, Germany). DMEM, HS and penicillin–streptomycin were purchased from Hyclone. FBS was bought from PAN (Adenbach, Bavaria, Germany). Sensor Chips Series S CM5, EDC, NHS and ethanolamine HCl, pH 8.5, were obtained from GE Healthcare Life Sciences. IRS1 antibody, InsRβ (L55B10) mouse mAb, phospho‐Akt (Ser473) (D9E) XP Rabbit mAb and phospho‐GSK‐3β (Ser9) were purchased from Cell Signalling Technology (Danvers, MA, USA). The antibody directed against p‐InsRβ (Tyr1185), p‐FOXO1 (Ser256) and total FOXO1 were bought from Abcam. p‐IRS‐1 (Tyr608) antibody and PVDF membrane were purchased from Millipore (Bedford, MA, USA). Anti‐β‐actin mouse monoclonal IgG and all secondary antibodies were obtained from Proteintech Group (Wuhan, China). The BCA Protein Assay Kit was obtained from Beyotime Biotechnology (Shanghai, China). Pierce™ ECL Western Blotting Substrate was purchased from Thermo Scientific (Waltham, MA, USA).
Nomenclature of targets and ligands
Key protein targets and ligands in this article are hyperlinked to corresponding entries in http://www.guidetopharmacology.org, the common portal for data from the IUPHAR/BPS Guide to PHARMACOLOGY (Southan et al., 2016), and are permanently archived in the Concise Guide to PHARMACOLOGY 2017/18 (Alexander et al., 2017a, 2017b).
Results
HPN is a specific PTP1B inhibitor
Recombinant hPTP1B1–321 was expressed in Escherichia coli and subsequently purified by the Ni‐NTA column (Figure 2A). Then we studied the inhibitory mode of PTP1B by the Lineweaver‐Burk plot enzyme reaction in the presence of HPN. The lines intersected on the y‐axis, and the K M values increased in a dose‐dependent manner without changing the Vmax value, demonstrating that HPN is a competitive inhibitor (Figure 2B).
Figure 2.
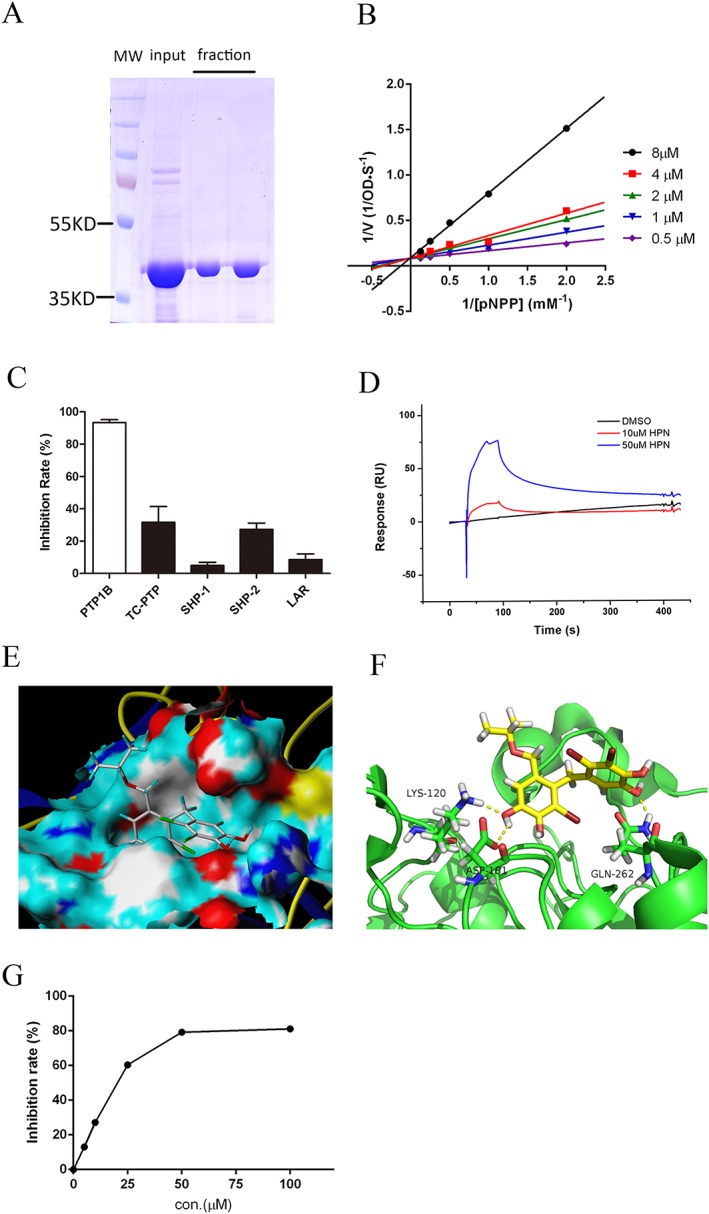
HPN is a specific PTP1B inhibitor. (A) SDS‐PAGE of purified recombinant hPTP1B1–321. (B) Lineweaver–Burk analysis of HPN inhibition of PTP1B. In the presence of various concentrations of HPN, the reciprocal of initial reaction rate (1/[V]) was plotted against the reciprocal of p‐NPP concentrations (1/[pNPP]). (C) Selectivity of HPN against five PTPs. A total of 20 μg·mL−1 HPN was pre‐incubated with each enzyme for 5 min at the room temperature. (D) The interaction between HPN and PTP1B. HPN (10 and 50 μM) in PBSP‐5% DMSO buffer was injected over a CM5 sensor chip surface to which hPTP1B1–321 was immobilized. Binding was measured by a flow rate of 30 μL·min−1 for 60 s. The response units (RU) were corrected to a reference flow cell. (E) Surface representation and (F) stick representation of predicted binding models of PTP1B (1QXK) with HPN. Hydrogen bonds are depicted as yellow dot lines. (G) DPPH‐scavenging activity of HPN. Various concentrations of HPN were incubated with DPPH at 25°C for 30 min, and then, the decrease in the absorbance at 519 nm was measured.
In terms of the inhibition specificity of HPN, a set of analyses was performed to evaluate the inhibitory effect of HPN on other protein tyrosine phosphatases (PTPs), including TC‐PTP, SHP‐1, SHP‐2 and LAR. A total of 20 μg·mL−1 HPN showed 93.46% inhibition of PTP1B (Figure 2C), while HPN was markedly less effective against other four PTPs (all below 32%), illustrating that HPN is a specific PTP1B inhibitor.
SPR biosensor‐based technology was applied to study whether HPN could directly interact with PTP1B. HPN was found to show significant binding to the PTP1B in comparison to a blank injection of buffer with no HPN compound (Figure 2D). And the dissociation of HPN was in a slow‐off manner.
We then carried out docking studies using HPN as ligand (PDB code of PTP1B: 1QXK). The result showed that a substituted benzene ring was embedded into the catalytic pocket of PTP1B (Figure 2E). Additionally, the Lys120, Asp181 and Gln262 formed three hydrogen bonds with HPN (Figure 2F), which strengthened the protein–ligand interaction between PTP1B and HPN. The second benzene ring of HPN was located at the edge of the active site, and no evident interaction was observed with residues around the active site.
Furthermore, the antioxidant properties of HPN were determined using the cell‐free DPPH assay. HPN inhibited DPPH activity in a dose‐dependent manner (Figure 2G). Thus, HPN is a reducing agent. This potent antioxidant activity may be due to the hydroxyl groups of HPN.
HPN is permeable to the plasma membrane
HPN needs to cross the cell membrane to exert its inhibitory effect. First, the octanol–water partition coefficient was calculated to theoretically predict the lipophilicity of HPN. The theoretical cLogP was 4.334, indicating that HPN was preferentially distributed in a hydrophobic rather than hydrophilic milieu and thus likely to cross the plasma membrane. Then HPLC assay was used to measure the ratio of HPN in C2C12 myotubes. The result showed that the proportion of compound HPN in the cell lysate was about 56.98% (Figure 3A–C), indicating that HPN successfully crossed the plasma membrane and accumulated intracellularly.
Figure 3.
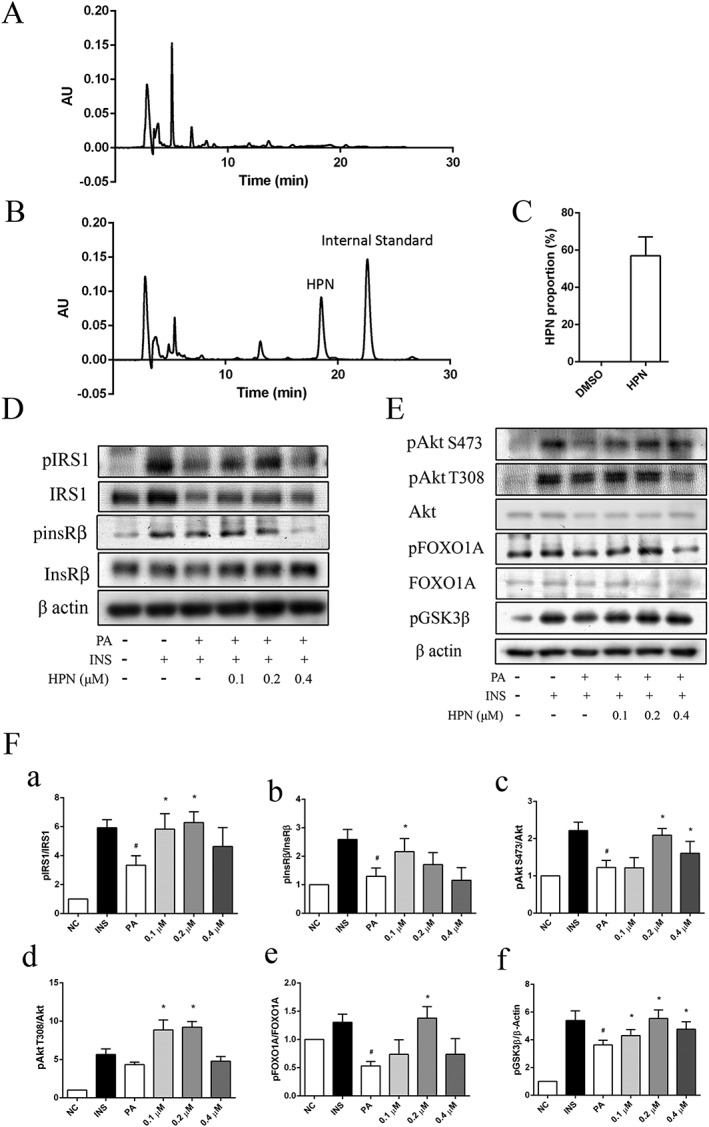
HPN is cell permeable in C2C12 myocytes. (A–C) Cell permeability of HPN in C2C12 myotubes. (A) DMSO‐treated group (control). (B) HPN‐treated group. C2C12 myotubes were treated with HPN (0.1 μmol) for 8 h. Then the myocytes were fixed with methanol and collected for HPLC analysis. An equal amount of the internal standard (0.1 μmol) was added after cell was disrupted. (C) Ratio of uptake of HPN in C2C12 myotubes. (D) HPN ameliorates insulin resistance in PA‐treated C2C12 myotubes. C2C12 cells were incubated with 0.75 mM PA for 16 h in the presence or absence of HPN followed by 5 min of insulin (100 nM) treatment. (E) The phosphorylation of InsR/IRS1downstream factors. (F) Relative ratio of phosphorylated IRS‐1, InsRβ, A78y8777kt, FOXO1A and GSK3β. Data are expressed as mean ± SD (n = 5). *P < 0.05 versus PA‐treated group; # P < 0.05 versus insulin‐treated group.
Given that HPN is a specific PTP1B inhibitor with good cell permeability, we next investigated the cellular activity of HPN. The tyrosine phosphorylation status of InsRβ, a key target of PTP1B, was assessed in C2C12 myocytes. As shown in Figure 3C, the phosphorylation was impaired when cells were exposed to 0.75 mM PA for 16 h, suggesting that PA caused insulin resistance. In contrast, the effect of saturated fatty acid was blocked in the presence of HPN, which increased a significant phosphorylation of InsR at Tyr1185. HPN treatment also activated IRS1 phosphorylation at Tyr608 (Figure 3D).
Consistent with InsR/IRS1 activation, the phosphorylation of several downstream factors was also increased, including Akt phosphorylation at Thr308 and Ser473, FOXO1 phosphorylation at Ser256 and GSK‐3β phosphorylation at Ser9 (Figure 3E).
HPN reduces the appetite of diabetic BKS db mice
The typical symptoms of T2DM are polydipsia and polyphagia, so we studied the dynamic effects of HPN on food intake, water intake and body weight during an 8 week treatment in BKS db mice. At the baseline, there was no difference in food intake, water intake and body weight among the three groups of BKS db mice (Figure 4A–C). Although there was no statistically significant change in food intake at the eighth week, the dynamic monitor of HPN‐treated mice showed they has a tendency to have a decreased food intake (Figure 4A). In detail, HPN could significantly reduce mice feeding at the fifth and seventh week. Furthermore, HPN could significantly reduce mean water intake from the third week (Figure 4B).
Figure 4.
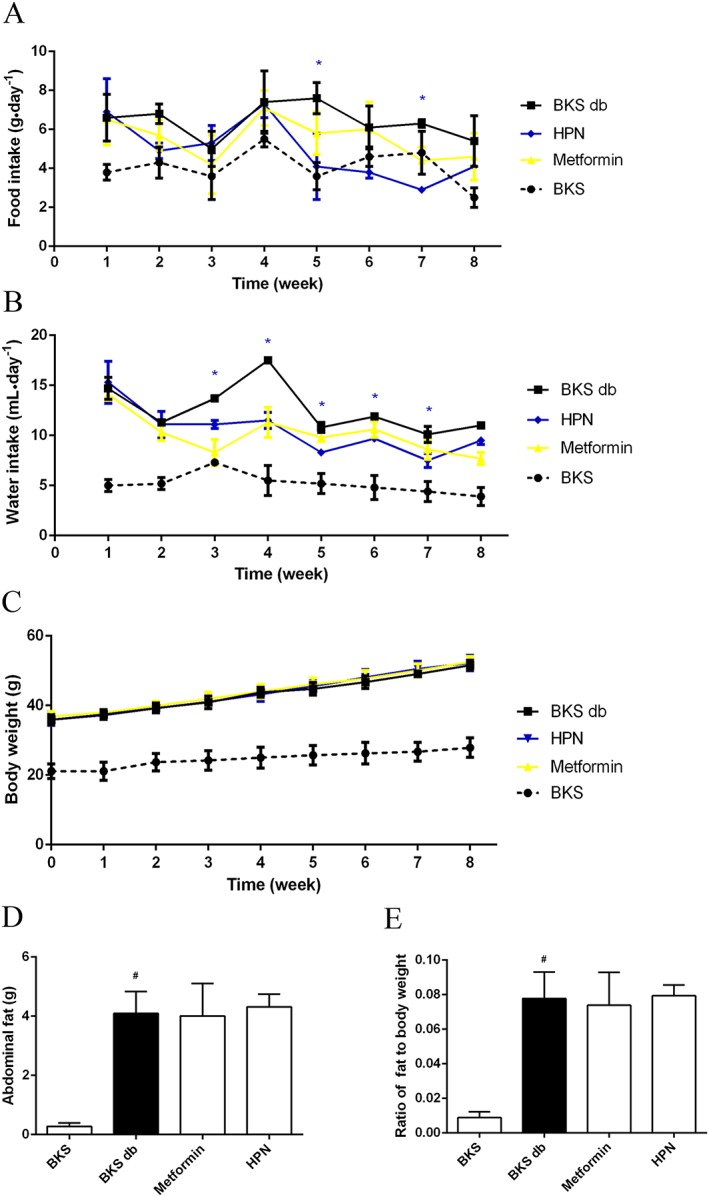
Effects of 8 week treatment with HPN on mean food intake, water intake and body weight. (A) and (B) show the food intake and water intake in BKS db mice during 8 weeks of treatment with vehicle, HPN and metformin, and in BKS mice treated with vehicle. Data are expressed as mean ± SD (n = 5). *P < 0.05 (HPN group versus BKS db group). (C), (D) and (E) show the body weight, abdominal fat weight and the fat ratio at the eighth week respectively. Data are expressed as mean ± SD (n = 8). # P < 0.05 versus BKS group.
As shown in Figure 4C, the BKS db mice were obese and their body weight increased rapidly with age. However, both HPN and metformin (a first‐line drug for T2DM) had no effect on body weight of BKS db mice. At the end of drug administration, BKS db mice developed a lot of abdominal fat (Figure 4D). Both HPN and metformin were unable to block the increased ratio of abdominal fat (Figure 4E).
Long‐term oral administration of HPN ameliorates hyperglycaemia in BKS db mice
To further investigate the anti‐diabetic effect of HPN, blood glucose levels were measured during the 8 week treatment. Compared with BKS mice, diabetic BKS db mice had hyperglycaemia with blood glucose levels of about 26 mM (Figure 5A). An 8 week treatment with HPN and metformin showed a trend towards decrease in blood glucose levels compared with vehicle (Figure 5A–C). Specifically, HPN significantly reduced the blood glucose levels from the third week; in the metformin‐treated group, the blood glucose levels of BKS db mice were significantly decreased from the first week.
Figure 5.
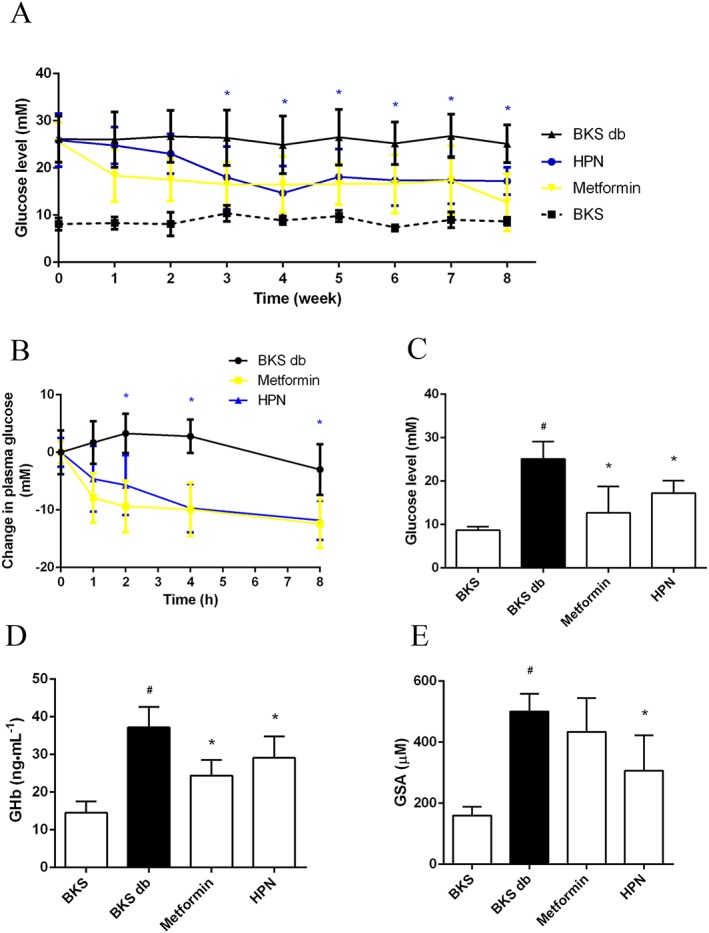
Hpyerglycaemic effect of HPN. (A) Long‐term measurement of the blood glucose levels in BKS db mice after treatment with vehicle, HPN and metformin, and in BKS mice treated with vehicle after 6 h fasting. Data are expressed as mean ± SD (n = 8). *P < 0.05 (HPN group versus BKS db group). (B) Changes in plasma glucose levels of BKS db mice after treatment with vehicle, HPN and metformin. Data are expressed as mean ± SD (n = 8). *P < 0.05 (HPN group versus BKS db group). (C), (D) and (E) show the blood glucose levels, GHb levels and GSA levels at the eighth week respectively. Data are expressed as mean ± SD (n = 8). # P < 0.05 versus BKS group; *P < 0.05 versus BKS db group.
Next, we investigated the effect of HPN on the levels of GHb and GSA. Compared with the BKS group, the levels of GHb and GSA in the BKS db mice were significantly increased (Figure 5D, E). HPN significantly lowered GHb levels compared with the model BKS db mice at the eighth week (Figure 5D). And HPN also significantly reduced GSA levels in BKS db mice (Figure 5E). However, in our study, metformin significantly reduced the levels of GHb in BKS db mice but had no effect on GSA levels.
HPN ameliorates dyslipidaemia in BKS db mice
Then we further studied whether HPN could improve the blood lipid levels of diabetic mice. Results showed that HPN potently reduced serum TC and TG levels from the second week (Figure 6A, C), while the lowering effect of metformin on serum TC levels was delayed by 1 week (Figure 6A). As shown in Figure 6B, D, after the 8 week treatment, HPN significantly lowered serum TC (decreased by 30.5%) and TG (decreased by 46.2%) levels compared with those in the model diabetic BKS db mice.
Figure 6.
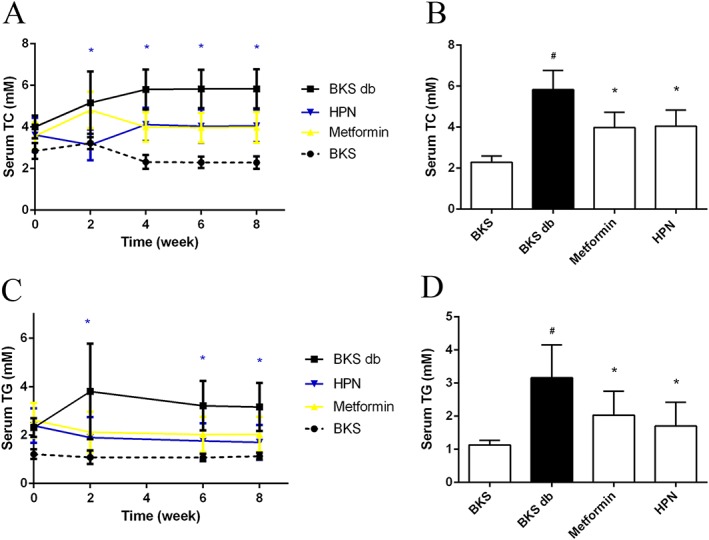
Effects of HPN on dyslipidaemia during the 8 week treatment of BKS db mice. Data in (A) and (C) represent the serum TC and TG levels during 8 weeks of treatment with vehicle, HPN and metformin, and in BKS mice treated with vehicle. Data are expressed as mean ± SD (n = 8). *P < 0.05 (HPN group versus BKS db group). (B) and (D) show the serum TC and TG levels after 8 weeks of treatment respectively. Data are expressed as mean ± SD (n = 8). # P < 0.05 versus BKS group; *P < 0.05 versus BKS db group.
HPN prevents hyperinsulinaemia in BKS db mice
Plasma insulin levels were examined in BKS db mice to evaluate the ability of HPN to improve insulin levels. As shown in Figure 7A, during the treatment period, diabetic BKS db mice became hyperinsulinaemic compared with the BKS mice. HPN significantly suppressed the plasma insulin levels after a 4 week oral treatment. At the eighth week, plasma insulin levels were markedly suppressed by HPN with 36.8% reduction (Figure 7B).
Figure 7.
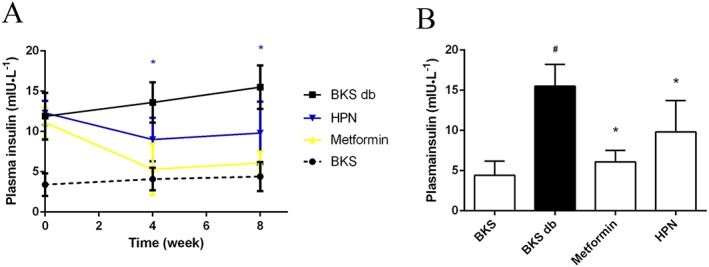
Hyperinsulinaemia effect of HPN. (A) Plasma insulin levels during the 8 week treatment. Data are expressed as mean ± SD (n = 8). *P < 0.05 (HPN group versus BKS db group). (B) Plasma insulin levels after 8 weeks of treatment. Data are expressed as mean ± SD (n = 8). # P < 0.05 versus BKS group; *P < 0.05 versus BKS db group.
HPN increases glycogen content in vivo
Next, the glycogen contents in muscle and liver were tested. Diabetic BKS db mice had lower hepatic and muscle glycogen content (reduced by 61.9 and 54.6%, respectively) compared with non‐diabetic BKS mice. Consistent with the enhanced phosphorylation level of GSK3B in C2C12 myotubes (Figure 3D), HPN significantly increased the glycogen content in quadriceps femoris muscle (increased by 73.8%) compared with vehicle‐treated BKS db mice (Figure 8A). Then we examined the glycogen content in the liver, the major site for glycogen storage. HPN significantly increased the liver glycogen content by 54.6% (Figure 8B).
Figure 8.
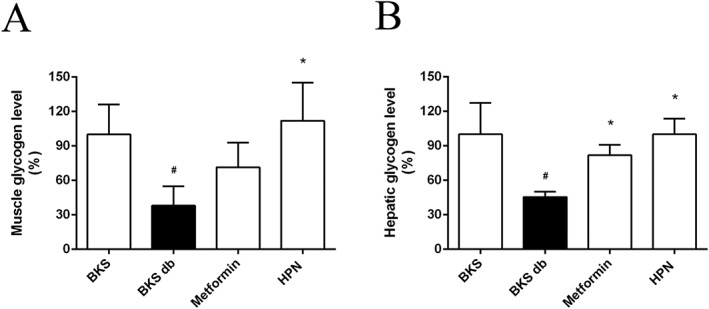
HPN improves glycogen storage in vivo. Data in (A) and (B) represent the glycogen levels in muscle and liver, respectively, after 8 weeks treatment with vehicle, HPN and metformin, and in BKS mice treated with vehicle. Data are expressed as mean ± SD (n = 8). # P < 0.05 versus BKS group; *P < 0.05 versus BKS db group.
Histological analysis of pancreas and liver
To investigate whether HPN has beneficial effects on islets, we first weighed the pancreas. HPN had no effect on pancreas weight (Figure 9A). Next, we employed Gomori staining of pancreatic islets after the 8 week treatment. As shown in Figure 9B, beta cells of control BKS mice appeared purple and were distributed uniformly. In contrast, the purple colour of beta cells in diabetic BKS db mice was lighter than control mice, indicating that diabetic db mice with a BKS background had a severe depletion of insulin‐producing beta cells of the pancreatic islets (Figure 9C). After treatment with HPN, the purple colour was darker and distributed more uniformly (Figure 9D). This indicates that HPN improved the number of beta cells.
Figure 9.
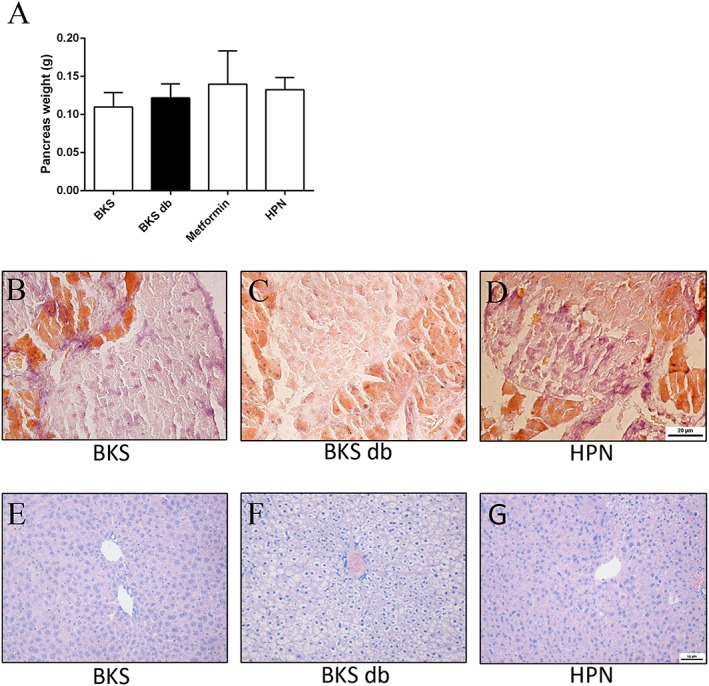
Effects of HPN on pancreatic islets and liver. (A)Pancreas weight. Data are expressed as mean ± SD (n = 8). Gomori staining of pancreatic islets after an 8 week treatment with vehicle in BKS mice (B) and in BKS db mice treated with vehicle (C) and HPN (D). H&E staining of liver after an 8 week treatment with vehicle in BKS mice (E) and in BKS db mice treatment with vehicle (F) and HPN (G). (A–C ×400; D–F ×200).
H&E‐stained liver sections of the BKS mice showed the normal characteristic of hepatic architecture: hepatic lobules with hepatocytes arranged radially around the central veins (Figure 9E). The diabetic BKS db mice showed markedly vacuolated and swollen hepatocytes with a disordered hepatic architecture (Figure 9F). And these vacuolated hepatocytes were effectively reduced after treatment with HPN (Figure 9G).
Oral acute toxicity study
No mortality was observed at both doses of HPN during the 14 day monitoring period (Table 1). Mice administered 1.6 g·kg−1 of HPN did not manifest any signs of toxicity during this observation period. However, mice treated with HPN 3.2 g·kg−1 showed a reduction in activity initially, which then gradually returned to normal during 24 h. No obvious abnormal symptoms were observed in the following 13 days.
Table 1.
Toxicity of acute p.o. HPN in ICR mice
| Dose (g·kg−1) | Mortality | |
|---|---|---|
| 1.6 | Male | 0/10 |
| Female | 0/10 | |
| 3.2 | Male | 0/10 |
| Female | 0/10 | |
Discussion
PTPs are a key group of signal transduction enzymes which, together with protein tyrosine kinases, control the levels of cellular protein tyrosine phosphorylation. Given that the membership of the PTP family is defined by the structurally conserved PTP domain, selectivity is one of the major issues in the development of PTP1B inhibitors as T2DM drugs (Andersen et al., 2001). Thus, we have taken out a series of enzyme inhibition experiments on PTPs which show high degree sequence similarity with PTP1B, including TC‐PTP, SHP‐1, SHP‐2 and LAR (Johnson et al., 2002). The results showed that HPN specifically inhibited PTP1B activity (Figure 2C). Moreover, kinetic analysis and SPR assay indicated that HPN was a competitive inhibitor which directly interacted with PTP1B (Figure 2B, D). The docking study demonstrated this competitive mode of inhibition in detail, in which HPN binds to PTP1B at the catalytic site through hydrogen bonds at residues Lys120, Asp181 and Gln262 (Figure 2E, F). It can be speculated that HPN is a specific inhibitor, which competitively interacted with PTP1B through hydrogen bonds binding to the catalytic domain.
Although many synthetic compounds showed excellent in vitro inhibitory effects on PTP1B in the past few years, their poor cell permeability limits their ability to reach the intracellular target. HPLC analysis showed that the permeability of HPN into C2C12 myotubes was about 56.98% (Figure 3A–C). By treating insulin‐resistant C2C12 myotubes with HPN, enhanced insulin signalling was observed (Figure 3D–F). These results indicate the good cell permeability of HPN.
Given that the in vivo properties of many PTP1B inhibitors are not consistent with their in vitro effects, a series of in vivo studies were carried out in diabetic BKS db mice to confirm the anti‐diabetic effects of HPN. More importantly, oral availability is another challenge to develop PTP1B inhibitors (Combs, 2010). Thus in our current study, we examined the effects of long‐term oral administration of HPN in diabetic BKS db mice.
Homozygous BKS db mice are polyphagic and polydipsic. HPN had a trend towards decreasing the appetite of BKS db mice (Figure 4A, B). However, HPN had no suppressive effect on the enhanced body weight (Figure 4C) or increased abdominal fat in these mice (Figure 4D).
Glycaemic control of HPN was then studied, which is the basis for the treatment of type 2 diabetes (Fonseca, 2003). Long‐term HPN administration potently reduced the blood glucose level of diabetic BKS db mice (Figure 5A–C). Moreover, GHb and GSA are two well‐known parameters of glycaemic control. In particular, the measurement of GHb remains the gold standard for the assessment of glycaemic control in patients with type 2 diabetes (Koenig et al., 1976). In this study, HPN significantly lowered the GHb and GSA levels in the diabetic mice (Figure 5D, E). Our results demonstrate that HPN has anti‐diabetic potency with an effective blood glucose‐lowering effect.
Dyslipidaemia is highly prevalent in diabetic subjects with increased TG and TC levels (Yoshino et al., 1996). And diabetic dyslipidaemia is a major factor contributing to the accelerated cardiovascular disease in T2DM (Taskinen, 2002). In the present study, HPN showed potent lipid‐lowering capability in the BKS db mice with reduced serum TC and TG levels (Figure 6A–D). The lowered TC and TG levels in the peripheral circulation may contribute to the anti‐diabetic effects of HPN.
Generally, early in the T2DM development, beta cells secrete sufficient insulin to compensate for insulin resistance and maintain euglycaemia, which causes the hyperinsulinaemia (Warram et al., 1990). In our study, HPN could attenuate hyperinsulinaemia of diabetic BKS db mice (Figure 7A, B). The plasma insulin levels significantly decreased after HPN treatment.
Glycogen synthesis in the liver (primarily) and skeletal muscle is an important mechanism of glycaemic control. Impaired glycogen storage is one of the major contributors to the pathophysiology of T2DM (MacAulay and Woodgett, 2008). We found that HPN significantly increased hepatic and muscle glycogen contents in diabetic BKS db mice (Figure 8A‐B). Liver, a key regulator of glucose homeostasis, is the largest gland in the body. The hepatocytes of BKS db mice were obviously vacuolated and swollen (Figure 9F), which might result in the decreased glycogen storage. HPN markedly improved the hepatic architecture with reduced vacuolated hepatocytes (Figure 9G). These results indicated that HPN could significantly improve the architecture and the function of liver, which may contribute to whole body glucose homeostasis.
Furthermore, increased beta cells were observed in the HPN‐treated pancreatic islets (Figure 9D), while severe depletion occurred in vehicle‐treated BKS db mice (Figure 9C). We speculate that HPN exerts protective effects on beta cells in diabetic mice.
The in vivo safety of HPN was also studied by acute toxicity test in ICR mice, which may provide toxic reference materials for the clinical safety of HPN. No death, behavioural changes or toxic symptoms were observed in mice administered 1.6 g·kg−1 HPN p.o. This dose is 40 times that of the effective dose (80 mg·kg−1) of HPN. The maximum dosing capacity and maximum dosing concentration of HPN to ICR mice was 3.2 g·kg−1 by oral gavage.
In view of the fact that no PTP1B inhibitor has yet been approved, studying marine‐derived products may give us more chance to identify effective candidates. Moreover, HPN is a bromophenol compound, which has three bromine atoms on the benzene ring. Halogenated compounds often show unique physiological activities. Among them, bromocriptine has been approved by the US Food and Drug Administration for the treatment of type 2 diabetes (Defronzo, 2011; Valiquette, 2011). In addition, enriched phenolic hydroxyl is another structural feature of HPN, which gives it an antioxidant effect (Figure 2G). Since oxidative stress plays a major role in the development and progression of diabetes (Asmat et al., 2016), these hydroxyl groups may also contribute to the anti‐diabetic properties of HPN. We are confident that HPN will achieve a breakthrough for hypoglycaemic agents targeting PTP1B.
Taken together, a novel bromophenol derivative HPN was identified as a specific PTP1B inhibitor and exerted promising anti‐diabetic effects with good cell permeability and oral availability. Further pharmacokinetics and harmacodynamics studies will be conducted to evaluate the drugability of HPN. Efforts in that regard will be reported in due course.
Author contributions
J.L., Q.X., B.J., R.Z., C.G., X.J. and X.L. conducted the experiments and performed data analysis. J.L., N.W., L.W. and D.S. designed the research, made data interpretation and prepared the manuscript. All authors reviewed the results and approved the final version of the manuscript.
Conflict of interest
The authors declare no conflicts of interest.
Declaration of transparency and scientific rigour
This Declaration acknowledges that this paper adheres to the principles for transparent reporting and scientific rigour of preclinical research recommended by funding agencies, publishers and other organisations engaged with supporting research.
Acknowledgements
This work was supported by the Shandong Provincial Natural Science Foundation for Distinguished Young Scholars (no. JQ201722); the National Natural Science Foundation of China (no. 81773586, 81703354); Key Research and Development Project of Shandong Province (2016ZDJS07A13, 2016GSF115002, 2016GSF201193, 2016GSF115009); Key Research Program of Frontier Sciences, CAS (QYZDB‐SSW‐DQC014); the Project of Discovery, Evaluation and Transformation of Active Natural Compounds, Strategic Biological Resources Service Network Programme of Chinese Academy of Sciences (ZSTH‐026); NSFC‐Shandong Joint Fund for Marine Science Research Centres (U1606403); the Scientific and Technological Innovation project financially supported by Qingdao National Laboratory for Marine Science and Technology (no. 2015ASKJ02); Aoshan Talents Program Supported by Qingdao National Laboratory for Marine Science and Technology (no. 2015ASTP); and National Program for Support of Top‐notch Young Professionals and Taishan scholar Youth Project of Shandong province.
Luo, J. , Xu, Q. , Jiang, B. , Zhang, R. , Jia, X. , Li, X. , Wang, L. , Guo, C. , Wu, N. , and Shi, D. (2018) Selectivity, cell permeability and oral availability studies of novel bromophenol derivative HPN as protein tyrosine phosphatase 1B inhibitor. British Journal of Pharmacology, 175: 140–153. doi: 10.1111/bph.14080.
References
- Ahmad F, Li PM, Meyerovitch J, Goldstein BJ (1995). Osmotic loading of neutralizing antibodies demonstrates a role for protein‐tyrosine phosphatase 1B in negative regulation of the insulin action pathway. J Biol Chem 270: 20503–20508. [DOI] [PubMed] [Google Scholar]
- Alexander SPH, Fabbro D, Kelly E, Marrion NV, Peters JA, Faccenda E et al (2017a). The Concise Guide To PHARMACOLOGY 2017/18: Catalytic receptors. Br J Pharmacol 174: S225–S271. [DOI] [PMC free article] [PubMed] [Google Scholar]
- Alexander SPH, Fabbro D, Kelly E, Marrion NV, Peters JA, Faccenda E et al (2017b). The Concise Guide To PHARMACOLOGY 2017/18: Enzymes. Br J Pharmacol 174: S272–S359. [DOI] [PMC free article] [PubMed] [Google Scholar]
- Andersen JN, Mortensen OH, Peters GH, Drake PG, Iversen LF, Olsen OH et al (2001). Structural and evolutionary relationships among protein tyrosine phosphatase domains. Mol Cell Biol 21: 7117–7136. [DOI] [PMC free article] [PubMed] [Google Scholar]
- Asmat U, Abad K, Ismail K (2016). Diabetes mellitus and oxidative stress‐A concise review. Saudi Pharm J 24: 547–553. [DOI] [PMC free article] [PubMed] [Google Scholar]
- Bono F, De Smet F, Herbert C, De Bock K, Georgiadou M, Fons P et al (2013). Inhibition of tumor angiogenesis and growth by a small‐molecule multi‐FGF receptor blocker with allosteric properties. Cancer Cell 23: 477–488. [DOI] [PubMed] [Google Scholar]
- Byon JC, Kusari AB, Kusari J (1998). Protein‐tyrosine phosphatase‐1B acts as a negative regulator of insulin signal transduction. Mol Cell Biochem 182: 101–108. [PubMed] [Google Scholar]
- Chen H, Wertheimer SJ, Lin CH, Katz SL, Amrein KE, Burn P et al (1997). Protein‐tyrosine phosphatases PTP1B and Syp are modulators of insulin‐stimulated translocation of GLUT4 in transfected rat adipose cells. J Biol Chem 272: 8026–8031. [DOI] [PubMed] [Google Scholar]
- Combs AP (2010). Recent advances in the discovery of competitive protein tyrosine phosphatase 1B inhibitors for the treatment of diabetes, obesity, and cancer. J Med Chem 53: 2333–2344. [DOI] [PubMed] [Google Scholar]
- Curtis MJ, Bond RA, Spina D, Ahluwalia A, Alexander SP, Giembycz MA et al (2015). Experimental design and analysis and their reporting: new guidance for publication in BJP. Br J Pharmacol 172: 3461–3471. [DOI] [PMC free article] [PubMed] [Google Scholar]
- Defronzo RA (2011). Bromocriptine: a sympatholytic, d2‐dopamine agonist for the treatment of type 2 diabetes. Diabetes Care 34: 789–794. [DOI] [PMC free article] [PubMed] [Google Scholar]
- Delibegovic M, Bence KK, Mody N, Hong E‐G, Ko HJ, Kim JK et al (2007). Improved glucose homeostasis in mice with muscle‐specific deletion of protein‐tyrosine phosphatase 1B. Mol Cell Biol 27: 7727–7734. [DOI] [PMC free article] [PubMed] [Google Scholar]
- Delibegovic M, Zimmer D, Kauffman C, Rak K, Hong E‐G, Cho Y‐R et al (2009). Liver‐specific deletion of protein‐tyrosine phosphatase 1B (PTP1B) improves metabolic syndrome and attenuates diet‐induced endoplasmic reticulum stress. Diabetes 58: 590–599. [DOI] [PMC free article] [PubMed] [Google Scholar]
- Ding H, Zhang Y, Xu C, Hou D, Li J, Zhang Y et al (2014). Norathyriol reverses obesity‐ and high‐fat‐diet‐induced insulin resistance in mice through inhibition of PTP1B. Diabetologia 57: 2145–2154. [DOI] [PubMed] [Google Scholar]
- Elchebly M, Payette P, Michaliszyn E, Cromlish W, Collins S, Loy AL et al (1999). Increased insulin sensitivity and obesity resistance in mice lacking the protein tyrosine phosphatase‐1B gene. Science 283: 1544–1548. [DOI] [PubMed] [Google Scholar]
- Fonseca V (2003). Clinical significance of targeting postprandial and fasting hyperglycemia in managing type 2 diabetes mellitus. Curr Med Res Opin 19: 635–641. [DOI] [PubMed] [Google Scholar]
- Fukuda S, Ohta T, Sakata S, Morinaga H, Ito M, Nakagawa Y et al (2010). Pharmacological profiles of a novel protein tyrosine phosphatase 1B inhibitor, JTT‐551. Diabetes Obes Metab 12: 299–306. [DOI] [PubMed] [Google Scholar]
- Goldstein BJ (2002). Insulin resistance as the core defect in type 2 diabetes mellitus. Am J Cardiol 90: 3G–10G. [DOI] [PubMed] [Google Scholar]
- Grant L, Shearer K, Czopek A, Lees E, Owen C, Agouni A et al (2013). Myeloid‐cell protein tyrosine phosphatase‐1B deficiency in mice protects against high‐fat diet and lipopolysaccharide induced inflammation, hyperinsulinemia and endotoxemia through an IL10 STAT3 dependent mechanism. Diabetes DB_130885 63: 456–470. [DOI] [PubMed] [Google Scholar]
- Haj FG, Zabolotny JM, Kim Y‐B, Kahn BB, Neel BG (2005). Liver‐specific protein‐tyrosine phosphatase 1B (PTP1B) re‐expression alters glucose homeostasis of PTP1B−/−mice. J Biol Chem 280: 15038–15046. [DOI] [PubMed] [Google Scholar]
- Johnson TO, Ermolieff J, Jirousek MR (2002). Protein tyrosine phosphatase 1B inhibitors for diabetes. Nat Rev Drug Discov 1: 696–709. [DOI] [PubMed] [Google Scholar]
- Kilkenny C, Browne W, Cuthill IC, Emerson M, Altman DG, Group NCRRGW (2010). Animal research: reporting in vivo experiments: the ARRIVE guidelines. Br J Pharmacol 160: 1577–1579. [DOI] [PMC free article] [PubMed] [Google Scholar]
- Klaman LD, Boss O, Peroni OD, Kim JK, Martino JL, Zabolotny JM et al (2000). Increased energy expenditure, decreased adiposity, and tissue‐specific insulin sensitivity in protein‐tyrosine phosphatase 1B‐deficient mice. Mol Cell Biol 20: 5479–5489. [DOI] [PMC free article] [PubMed] [Google Scholar]
- Koenig RJ, Peterson CM, Jones RL, Saudek C, Lehrman M, Cerami A (1976). Correlation of glucose regulation and hemoglobin‐A‐IC in diabetes‐mellitus. N Engl J Med 295: 417–425. [DOI] [PubMed] [Google Scholar]
- MacAulay K, Woodgett JR (2008). Targeting glycogen synthase kinase‐3 (GSK‐3) in the treatment of Type 2 diabetes. Expert Opin Ther Targets 12: 1265–1274. [DOI] [PMC free article] [PubMed] [Google Scholar]
- McGrath JC, Lilley E (2015). Implementing guidelines on reporting research using animals (ARRIVE etc.): new requirements for publication in BJP. Br J Pharmacol 172: 3189–3193. [DOI] [PMC free article] [PubMed] [Google Scholar]
- Mittermayer F, Caveney E, De Oliveira C, Alexander Fleming G, Gourgiotis L, Puri M et al (2016). Addressing unmet medical needs in type 1 diabetes: a review of drugs under development. Curr Diabetes Rev 13: 300–314. [DOI] [PMC free article] [PubMed] [Google Scholar]
- Olokoba AB, Obateru OA, Olokoba LB (2012). Type 2 diabetes mellitus: a review of current trends. Oman Med J 27: 269–273. [DOI] [PMC free article] [PubMed] [Google Scholar]
- Owen C, Lees E, Grant L, Zimmer D, Mody N, Bence K et al (2013). Inducible liver‐specific knockdown of protein tyrosine phosphatase 1B improves glucose and lipid homeostasis in adult mice. Diabetologia 56: 2286–2296. [DOI] [PubMed] [Google Scholar]
- Rondinone CM, Trevillyan JM, Clampit J, Gum RJ, Berg C, Kroeger P et al (2002). Protein tyrosine phosphatase 1B reduction regulates adiposity and expression of genes involved in lipogenesis. Diabetes 51: 2405–2411. [DOI] [PubMed] [Google Scholar]
- Samsdodd F (2005). Target‐based drug discovery: is something wrong? Drug Discov Today 10: 139–147. [DOI] [PubMed] [Google Scholar]
- Seely BL, Staubs PA, Reichart DR, Berhanu P, Milarski KL, Saltiel AR et al (1996). Protein tyrosine phosphatase 1B interacts with the activated insulin receptor. Diabetes 45: 1379–1385. [DOI] [PubMed] [Google Scholar]
- Shi D, Guo S, Jiang B, Guo C, Wang T, Zhang L et al (2013). HPN, a synthetic analogue of bromophenol from red alga Rhodomela confervoides: synthesis and anti‐diabetic effects in C57BL/KsJ‐db/db mice. Mar Drugs 11: 350–362. [DOI] [PMC free article] [PubMed] [Google Scholar]
- Southan C, Sharman JL, Benson HE, Faccenda E, Pawson AJ, Alexander SPH et al (2016). The IUPHAR/BPS guide to PHARMACOLOGY in 2016: towards curated quantitative interactions between 1300 protein targets and 6000 ligands. Nucl Acids Res 44 (D1): D1054–D1068. [DOI] [PMC free article] [PubMed] [Google Scholar]
- Taskinen MR (2002). Diabetic dyslipidemia. Atheroscler Suppl 3: 47–51. [DOI] [PubMed] [Google Scholar]
- Valiquette G (2011). Bromocriptine for diabetes mellitus type II. Cardiol Rev 19: 272–275. [DOI] [PubMed] [Google Scholar]
- Warram JH, Martin BC, Krolewski AS, Soeldner JS, Kahn CR (1990). Slow glucose removal rate and hyperinsulinemia precede the development of type‐II diabetes in the offspring of diabetic parents. Ann Intern Med 113: 909–915. [DOI] [PubMed] [Google Scholar]
- Yoshino G, Hirano T, Kazumi T (1996). Dyslipidemia in diabetes mellitus. Diabetes Res Clin Pract 33: 1–14. [DOI] [PubMed] [Google Scholar]
- Zhang R, Chen S, Zhang X, Yu R, Wan S, Geng M et al (2016a). Synthesis and evaluation of novel non‐covalent binding quinazoline glycoside derivatives targeting the L858R and T790M variants of EGFR. RSC Adv 6: 36857–36862. [Google Scholar]
- Zhang X, Tian J, Li J, Huang L, Wu S, Liang W et al (2016b). A novel protein tyrosine phosphatase 1B inhibitor with therapeutic potential for insulin resistance. Br J Pharmacol 173: 1939–1949. [DOI] [PMC free article] [PubMed] [Google Scholar]
- Zinker BA, Rondinone CM, Trevillyan JM, Gum RJ, Clampit JE, Waring JF et al (2002). PTP1B antisense oligonucleotide lowers PTP1B protein, normalizes blood glucose, and improves insulin sensitivity in diabetic mice. Proc Natl Acad Sci U S A 99: 11357–11362. [DOI] [PMC free article] [PubMed] [Google Scholar]


