Abstract
Background and Purpose
Amiodarone is one of the most effective anti‐arrhythmic drugs available, but its clinical applications are limited by toxic side effects including optic toxicity. The purpose of this study was to investigate the toxic effect of amiodarone on D407 cells (a human retinal pigmented epithelial (RPE) cell line) and the mechanisms of the protective effect of insulin‐like growth factor‐1 (IGF‐1).
Experimental Approach
The involvement of the kinases, Akt and ERK, was analysed by Western blot. Intracellular accumulation of ROS was measured using fluorophotometric quantification. A pharmacological approach with inhibitors was used to investigate the pathways involved in the protective action of IGF‐1.
Key Results
Amiodarone concentration‐dependently augmented the production of ROS, lipid peroxidation and apoptosis in D407 cells. IGF‐1 time‐ and concentration‐dependently reversed these effects of amiodarone and protected D407 cells from amiodarone‐mediated toxicity. Amiodarone inhibited the pAkt but not pErk, and IGF‐1 reversed this inhibitory effect of amiodarone. However, IGF‐1 failed to suppress amiodarone‐induced cytotoxicity in the presence of PI3K/Akt inhibitor LY294002 suggesting the direct involvement of the PI3K/Akt pathway. Furthermore, in vivo rat flash electroretinogram (FERG) recordings showed that IGF‐1 reverses the amiodarone‐induced decrease in a‐ and b‐waves. The immunocytochemistry findings confirmed that vitreous IGF‐1 injections promote the survival of RPE cells in rat retina treated with amiodarone.
Conclusion and Implications
IGF‐1 can protect RPE cells from amiodarone‐mediated injury via the PI3K/Akt pathway in vivo and in vitro. IGF‐1 has potential as a protective drug for the prevention and treatment of amiodarone‐induced optic toxicity.
Abbreviations
- FERG
flash electroretinogram
- IGF‐1
insulin‐like growth factor‐1
- INL
inner nuclear layer
- IPL
inner plexiform layer
- RGCs
retinal ganglionic cells
- RPE
retinal pigmented epithelium
Introduction
Amiodarone is one of the most commonly prescribed antiarrhythmic medications used for the treatment of life‐threatening cardiac conduction pathologies. Amiodarone shows β adrenoceptor blocking activity as well as calcium channel blocking activity and has effects on cardiac conduction and contractility. However, the utility of amiodarone is limited by its toxicity (Kim et al., 2014). Amiodarone can adversely affect multiple organs including eyes, lungs, thyroid gland, liver, skin and nerves (Park and Kim, 2014). Amiodarone‐induced optic neuropathy presents as visual dysfunction and is typically a bilateral process, and is only reversible in a few cases on drug withdrawal. The incidence of amiodarone‐associated optic neuropathy is 1.3–1.8% (Cheng et al., 2015). Although amiodarone‐induced optic toxicity is a serious side effect, the underlying molecular mechanisms and potential approaches for the amelioration of this toxicity remain unresolved (Kervinen et al., 2013; Mindel, 2014).
The risk of adverse effects increases with dose and duration of use. Several hypotheses have been put forward to explain the toxicity of amiodarone including increased release of inflammatory mediators, mitochondrial dysfunction and free‐radical formation (Lu et al., 2013; Pomponio et al., 2015). Evidence from cell and animal studies suggests that amiodarone induces the formation of ROS; this was evaluated in a relevant in vitro model of pulmonary toxicity (Nicolescu et al., 2008). Furthermore, amiodarone increases mitochondrial H2O2 synthesis, which in turn induces peroxide production (Serviddio et al., 2011).
The retinal pigmented epithelium (RPE) is a monolayer of pigmented cells located between the photoreceptors and the choroid (Folgar et al., 2016). The RPE has critical support functions for photoreceptors, which include nutrient transport, phagocytosis and the barrier function (Miranda et al., 2012). The RPE is essential for visual acuity, the survival of photoreceptors and for absorbing stray light (Slomiany and Rosenzweig, 2004). The RPE and RPE cells are part of the blood–retinal barrier, which restricts the entry of blood‐borne components to the retina. The RPE is constantly impaired by oxidative stress, particularly due to the presence of ROS (Atienzar‐Aroca et al., 2016). RPE cells release higher amounts of peroxidation products when they are under conditions of elevated oxidative stress. Hence, oxidative stress‐induced damage can have toxic consequences on the survival of the neural retina (Sridhar et al., 2016).
Insulin‐like growth factor‐1 (IGF‐1) is a polypeptide growth factor which is similar to insulin in structure and function. IGF‐1 plays key roles in cell growth and metabolism, and it is mitogenic in many cells and tissues, including the RPE (Bu et al., 2013). The expression of mRNA for IGF receptors types I (IGF1R) and II (IGF2R) in human RPE cells (Martin et al., 1992) suggests that RPE cells secrete IGF‐1 which can function in an autocrine or paracrine regulatory manner. The presence of IGF‐1 in the supernatant of cultured RPE cells and in the interphotoreceptor matrix suggests that RPE‐derived IGF is active on photoreceptor cells (Holtkamp et al., 2001). ROS‐induced oxidative stress increases in RPE cells with ageing and decreased cell density causing age‐related macular degeneration (Golan et al., 2014). IGF‐1 promotes the survival of the cells under oxidative stress (Ayadi et al., 2016). It is not known whether IGF‐1 can protect the RPE from amiodarone‐induced oxidative stress and toxicity.
We previously reported that IGF‐1 promotes the survival of various cell types in which cell death is initiated by stimuli such as serum deprivation and sodium nitroprusside. This action of IGF‐1 occurs via the ubiquitous PI3K/Akt signalling pathway, although the complete pathway including upstream and downstream effectors is yet to be fully characterized (Zheng et al., 2002; Zheng and Quirion, 2006, 2009; Sun et al., 2012; Wang et al., 2015). In the present study, we evaluated the toxic effect of amiodarone on D407 cells (a human RPE cell line) (Kennedy et al., 1996; Wang et al., 2015) and used a clinically relevant cellular model of oxidative injury to evaluate the role of IGF‐1 and its mechanism of action in the protection of D407 cells from the oxidative injury induced by amiodarone. We found that amiodarone inhibited the activation of Akt and induced apoptosis in D407 cells while IGF‐1 promoted the survival of D407 cells subjected to amiodarone‐induced oxidative stress. As observed with toxic mechanisms in other cells, this effect of IGF‐1 was mediated by the PI3K/Akt pathway indicating the ubiquitous nature of the protective role of the PI3K/Akt pathway in cell biology.
Methods
Animals
A total of 15 special pathogen‐free adult Sprague–Dawley rats of either sex were used in this study (weighing 200–220 g). The rats were obtained from the animal centre at the Sun Yat‐sen University. The rats were housed in groups of two per cage (length, 36.2 cm; width, 24.8 cm; height, 17.8 cm) in accordance with the IACUC recommendation for humane animal care and were maintained in standard laboratory conditions (20–25°C, 40–70% relative humidity and a 12 h light–dark cycle). All rats had free access to food and water throughout the experiment. Animal studies are reported in compliance with the ARRIVE guidelines (Kilkenny et al., 2010; McGrath and Lilley, 2015). The study was approved by the local Medical Ethics Committee, and the experiments were conducted in compliance with the ARVO Statement for the Use of Animals in Ophthalmic and Vision Research.
Cell culture
Human retinal pigment epithelial cells (D407 cells) were maintained in 75 cm2 tissue culture flasks in DMEM supplemented with 10% FBS, streptomycin 100 μg·mL−1 and penicillin 100 U·mL−1 and incubated at 37°C with 5% CO2 humidified atmosphere. Stock cells were sub‐cultured twice a week to provide new stocks and cells for the experiments described (Wang et al., 2015).
Cell treatments
D407 cells in logarithmic phase were seeded into 96‐well, 12‐well or 6‐well plates coated with 0.1 mg·mL−1 poly‐D‐lysine (Sigma) and allowed to grow for at least 24 h. To study the effect of amiodarone on the viability of these cells, they were treated with different concentrations of amiodarone (0–100 μM) as indicated, then their viability or apoptosis were determined by MTT or Hoechst staining and Annexin V‐FITC/PI assay respectively (see below). To study the protective effect of IGF‐1, cells pretreated with IGF‐1 (1–100 ng·mL−1) were treated with/without amiodarone (50 μM), and the viability of these cells was determined. To study the pathways involved in the effect of IGF‐1, cells pretreated with various kinase inhibitors were treated with IGF‐1 and amiodarone, and their viability or the activation/phosphorylation of each signalling protein was determined.
MTT cell viability assays
Cell viability was assessed by MTT assay as described by Zheng et al. (2002) with some modifications. Briefly, D407 cells were seeded in 96‐well plates at a density of 2 × 10⁵ cells per well. All of the treatments were performed under conditions of serum deprivation. After serum starvation and exposure to reagents as indicated for 24 h, cells were incubated with MTT (0.5 mg·mL−1) for an additional 3 h. Each group was treated in triplicate. The medium was aspirated from each well, and DMSO (100 μL) (Sigma, USA) was added to the well to dissolve the formazan crystals. The absorbance of each well was recorded with a Multiskan Ascent Revelation Plate Reader (Thermo, USA) at a wavelength of 570 nm. All procedures were repeated five times.
Detection of cell apoptosis by Hoechst 33342 staining and Annexin V‐FITC/PI assay
Apoptosis of cells was assessed by staining with the DNA binding dye, Hoechst 33342 as described by Zeng et al. (2017). D407 cells treated as indicated were fixed with 4% formaldehyde in PBS for 10 min at 4°C. Cells were then incubated with 10 μg·mL−1 of Hoechst 33342 (Sigma, St. Louis, MO, USA) for 20 min to stain the nuclei. After being washed with PBS, the apoptotic cells were observed under a fluorescence microscope (Olympus, Japan). Cells exhibiting condensed chromatin or fragmented nuclei were scored as apoptotic cells. For each Hoechst staining experiment, at least 200 cells in five random scope fields were collected and quantified.
The apoptotic cells were measured by Annexin V‐FITC/PI assays described by Zeng et al. (2017); 24 h after treatment with amiodarone, D407 cells were trypsinized, washed twice with ice‐cold PBS then centrifuged for 5 min and re‐suspended in Annexin V‐FITC binding buffer (195 μL). Annexin V‐FITC (5 μL) and propidium iodide (PI) (10 μL) were supplemented, and the cells were incubated away from light at 20–25°C for 10 min. Apoptosis was quantified by using flow cytometry. The data were evaluated using the Flowjo 7.6.1 software. All procedures were repeated five times.
Mitochondrial membrane potential assay
JC‐1 dye was used to monitor mitochondrial integrity, as described by Yan et al. (2016). In brief, D407 cells were seeded into black 96‐well plates (1 × 10⁴ cells per well). After the appropriate treatment, the cells were incubated with JC‐1 (10 μg·mL−1 in medium) at 37°C for 15 min and then washed twice with PBS. For signal quantification, the intensity of red fluorescence (excitation 560 nm, emission 595 nm) and green fluorescence (excitation 485 nm, emission 535 nm) was measured using an Infinite M200 PRO Multimode Microplate. Mitochondrial membrane potential (△ψm) was calculated as the ratio of JC‐1 red/green fluorescence intensity, and the value was normalized to the control group. The fluorescent signal in the cells was also observed and recorded with a fluorescent microscope. All procedures were repeated five times.
Measurement of ROS
Intracellular accumulation of ROS was measured using fluorophotometric quantification, as described by Wang et al. (2016). The cells cultured with IGF‐1 with/without amiodarone for 24 h and were subsequently stained with DCFH‐DA for 30 min at 37°C. The cell suspension was dispensed into a 96‐well black plate. DCFH‐DA reacts with ROS and is converted to dichlorofluorescein (DCF). The fluorescence in eight random fields from the DCF was analysed using a high content screening system (ArrayScan VTI, Thermo Fisher Scientific, USA) with the excitation wavelength set at 488 nm and the emission wavelength set at 525 nm. The levels of ROS were normalized to the control group and expressed as a percentage. All procedures were repeated five times.
Estimation of lipid peroxidation
Cell cytotoxicity was determined by measuring the activity of lactate dehydrogenase (LDH) released into the incubation medium when cellular membranes were damaged. MDA reacts with thiobarbituric acid to produce a fluorescent product which can be detected with a microplate reader at a wavelength of 535 nm. As described by Wang et al. (2016), D407 cells pretreated with IGF‐1 were exposed to amiodarone and left to grow up to more than 90% confluence in six‐well plates. Cells were harvested by trypsinization, and cellular extracts were prepared by sonication in ice‐cold buffer (50 mM Tris–HCl, pH 7.5, 5 mM EDTA and 1 mM DTT). After sonication, lysed cells were centrifuged at 10 000 × g for 20 min to remove debris. The supernatant was used to measure the levels of LDH and MDA according to the manufacturer's protocol (Nanjing Jiancheng Bioengineering Institute, Nanjing, China). The concentrations of LDH and MDA released were normalized to the control group and are expressed as a percentage. All procedures were repeated five times.
Caspase 3/7 activity assay
After treatment, the activity of caspase 3/caspase 7 was measured using the commercially available Caspase‐Gloss 3/7 Assay (Invitrogen, USA) according to the manufacturer's protocol, as described by Zheng et al. (2016). Briefly, D407 cells were lysed in lysis buffer and centrifuged at 12 500 × g for 5 min. A total of 15 μL of cell lysate was incubated with 15 μL of 2× substrate working solution at room temperature for 30 min in 96‐well plates. The fluorescence intensity was then determined by Infinite M200 PRO Multimode Microplate at an excitation wavelength of 490 nm and emission at 520 nm. The fluorescence intensity of each sample was normalized to the protein concentration of sample. All values for caspase 3/7 activities were normalized to the control group and are expressed as a percentage. All procedures were repeated five times.
Western blot analysis
Western blotting was performed as described by Zheng and Quirion (2009). Briefly, treated cells from different experimental conditions were lysed in either sample buffer [62.5 mM Tris–HCl (pH 6.8), 2% (w.v‐1) SDS, 1% glycerol, 50 mM dithiothreitol and 0.1% (w.v‐1) bromphenol blue] or RIPA buffer [50 mM Tris–HCl (pH 8.0), 150 mM NaCl, 1 mM EDTA, 1% Igepal CA‐630, 0.1% SDS, 50mM NaF, 1 mM NaVO3, 5 mM PMSF, 10 mg·mL−1 leupeptin and 50 mg·mL−1 aprotinin], and protein concentration was determined with a BCA protein assay kit according to the manufacturer's instructions. Samples with equal amounts of protein were then separated by PAGE (8%) under denaturing conditions (SDS–PAGE) and electro‐transferred onto a nitrocellulose membrane (Millipore, USA). Membranes were incubated with 5% non‐fat milk in TBST [10mMTris‐HCl (pH 8.0), 150 mM NaCl and 0.2% Tween 20] for 1 h at room temperature and incubated with the appropriate primary antibody at 4°C overnight. Membranes were then washed twice with TBST and probed with the corresponding secondary antibodies conjugated with horseradish peroxidase at room temperature for 1 h. Membranes were finally washed several times with TBST to remove unbound secondary antibodies and visualized using enhanced chemiluminescence as described by the instructions of the manufacturer. A part of the SDS gel was stained with coomassie blue to confirm the use of equal amounts of protein. Each sample was repeated three times.
The respective phosphorylation of Akt and MAPK was determined by Western blotting using anti‐phospho‐Akt and anti‐phospho‐ERK respectively. Blots were stripped and reprobed with anti‐Akt or anti‐ERK antibodies to assess that equal amounts of Akt were present. In some cases, blots were stripped and reprobed with anti‐GAPDH or β‐actin antibody respectively as a control. All experiments were repeated five times.
Flash electroretinogram (FERG) test
Fifteen Sprague–Dawley rats were randomly assigned to three groups: Group 1 was normal control group; Group 2 was amiodarone (1.5 μM) group; and Group 3 was IGF‐1 (100 ng·mL−1) + amiodarone (1.5 μM) group. Group 1 was injected with normal saline 5 μL into the vitreous; Group 2 was injected with amiodarone (1.5 μM) 2.5 μL + normal saline 2.5 μL into the vitreous; Group 3 was injected with IGF‐1 (100 ng·mL−1) 2.5 μL + amiodarone (1.5 μM) 2.5 μL into the vitreous respectively. Twenty hours later, FERG studies were performed and the measurements on each rat were technically repeated three times.
FERG was monitored by the Roland RETI port visual electrical physiological system (Roland Consult, Germany). The experiment was performed as described by Chen et al. (2015). Under dim red illumination, FERG was conducted after 60 min of dark adaptation. Rats were anaesthetised with 10% chloral hydrate. Changes in the conscious state were judged by loss of righting reflex (LOR). The cornea was anaesthetised with pontocaine (0.5%), and both pupils were dilated with Compound Tropicamide Eye Drops. A circle silver chloride electrode was placed on the centre of the cornea. A reference electrode was placed in the mouth, and a grounding electrode was placed s.c. into the tail. Rats were kept warm during and after the procedure. Rats were still anaesthetized when FERG was monitored. The interval time between two FERG recordings was 5 min. All experiments were repeated five times.
The average amplitudes of the a‐wave and b‐wave were calculated. The amplitude of the a‐wave was measured from the baseline to the bottom of the a‐wave, and the amplitude of the b‐wave was measured from the bottom of the a‐wave to the peak of the b‐wave.
Paraffin sections and morphological observations
Paraffin sections and morphological observations were performed as described by Chen et al. (2015). Animals were killed with an overdose of 10% chloral hydrate after the FERG test, and both eyes were immediately removed and prefixed with fixative solution for the eyeball at 4°C overnight. The eyes were used for paraffin sections. The fixed eyes were cut into two sagittal, half balls, and the lens was extirpated. Next, samples from both halves were embedded in paraffin routinely and sagittal‐sectioned at 5 μm thickness with a paraffin slicing machine (LeicaRM2235, Germany). The slices were kept at room temperature.
The paraffin sections were used for morphological observations. The slices were dewaxed, stained with haematoxylin for 20 s and restained with eosin for 2 min. Images were taken with a Zeiss fluorescence microscope equipped with Axioplan 2 imaging and processed with Axio Vision Rel4.8 (Zeiss, Germany). Three sections from each eye were used for morphological analysis. All procedures were repeated five times.
RPE65 staining
RPE65 staining was performed as described by Zheng et al. (2017). The eyes were harvested 24 h after light exposure and fixed for 24 h in 4% paraformaldehyde, dehydrated in 15 and 30% sucrose solution overnight, embedded in Tissue‐Tek optimal cutting temperature compound, and 6 μm frozen sections were collected. Sections were blocked in 6% (w.v‐1) normal goat serum, 0.3% (v.v‐1) Triton X‐100 in PBS for 1 h. Rabbit anti‐RPE65 antibody (Novus Biologicals, Littleton, CO, USA) was diluted in 1:100 ratio in blocking solution and incubated with the section overnight at 4°C. The section was washed three times in PBS followed by incubation with CY3‐goat anti‐rabbit secondary antibody (Jackson Immuno Research) diluted 1:400 in the blocking buffer. For all sections, light and fluorescent microscopy (Zeiss Axioplan 2 imaging) were used to observe the effect of different treatments with a differential interference contrast and appropriate fluorescent filters. All procedures were repeated five times.
Data analysis
Numbers of experiments are based on data for coefficients of variation of relevant end‐points in previous studies (Liao et al., 2017) and power calculations to allow detection of a 30% difference between groups with <5% false negative error. Data and statistical analysis comply with the recommendations on experimental design and analysis in pharmacology (Curtis et al., 2015). Data are expressed as the mean ± SEM of n animals or tissue samples or cell preparations; values of n are given in the figure legends.
According to the design of the experiment, data were analysed using SPSS 22.0 (SPSS Inc., Chicago, Illinois, US) after application of the Brown Forsy test to examine homogeneity of variance using a parametric one‐ or two‐factor ANOVA followed post hoc, when indicated for a particular factor (when F achieved P < 0.05). When data are expressed as fold change for comparison purposes of readouts with different baselines, the Kruskal–Wallis test followed by Bonferonni post hoc test for multiple comparisons was used. In all cases, P < 0.05 was considered statistically significant. All experiments were conducted in a blinded manner, and experimenters did not know the treatment conditions. All the experiments were repeated five times.
Materials
MTT (3‐(4,5‐dimethylthiazol‐2‐yl)‐2, 5‐diphenyl tetrazolium bromide), DMSO, poly‐D‐lysine, anti‐β‐actin antibody, AM, BSA, IGF‐1, PBS solution and dichlorofluoresceindiacetate (DCFH‐DA) kits were purchased from Sigma (St. Louis, MO, USA); Anti‐phospho‐Akt (Ser473) and phospho‐ERK1/2 antibodies were purchased from Cell Signalling Technology (Woburn, USA); PI3K inhibitor LY294002, Akt inhibitor VIII and ERK1/2 inhibitors PD98059 were obtained from Calbiochem (La Jolla, CA, USA); Hoechst 33342, MDA detection kit and BCA protein assay kit are from Beyotime Institute of Biotechnology (Beijing, China); Annexin V‐FITC/PI was purchased from Sigma‐Aldrich (Missouri, USA); Western blotting and protein quantification materials were purchased from Bio‐Rad (Hercules, CA, USA). Super Signal West Pico chemiluminescent substrate was purchased from Thermo Scientific (Rockford, IL, USA). FBS, HBSS, high‐glucose DMEM, penicillin/streptomycin and trypsin were from Invitrogen (Carlsbad, USA).
Nomenclature of targets and ligands
Key protein targets and ligands in this article are hyperlinked to corresponding entries in http://www.guidetopharmacology.org, the common portal for data from the IUPHAR/BPS Guide to PHARMACOLOGY (Southan et al., 2016), and are permanently archived in the Concise Guide to PHARMACOLOGY 2017/18 (Alexander et al., 2017a,b).
Results
Effect of amiodarone on the viability and survival of D407 cells
Increased levels of amiodarone in vitreous cavity and retina may lead to the injury of RPE cells and eventually contributes to the occurrence and development of retinopathy. To test the direct effect of amiodarone on RPE cells, we investigated the effect of the amiodarone on the viability of cells of the human RPE cell, D407. Amiodarone decreased the viability of D407 cells. The effect of amiodarone was concentration‐dependent with the greatest effect observed in terms of decreased viability up to 40% (Figure 1A). A detrimental effect of amiodarone on the viability of D407 cells was observed at 6.25–100 μM and showed an LC50 of 60 μM. Hoechst DNA dye staining for apoptosis was observed by fluorescence microscopy, and this indicated that amiodarone caused nuclear condensation and fragmentation and the phenomenon was increasingly apparent with increasing amiodarone concentrations (Figure 1B, C). Annexin V‐FITC/PI assay also showed amiodarone induced apoptosis of the D407 cells in a concentration‐dependent manner (Figure 1D).
Figure 1.
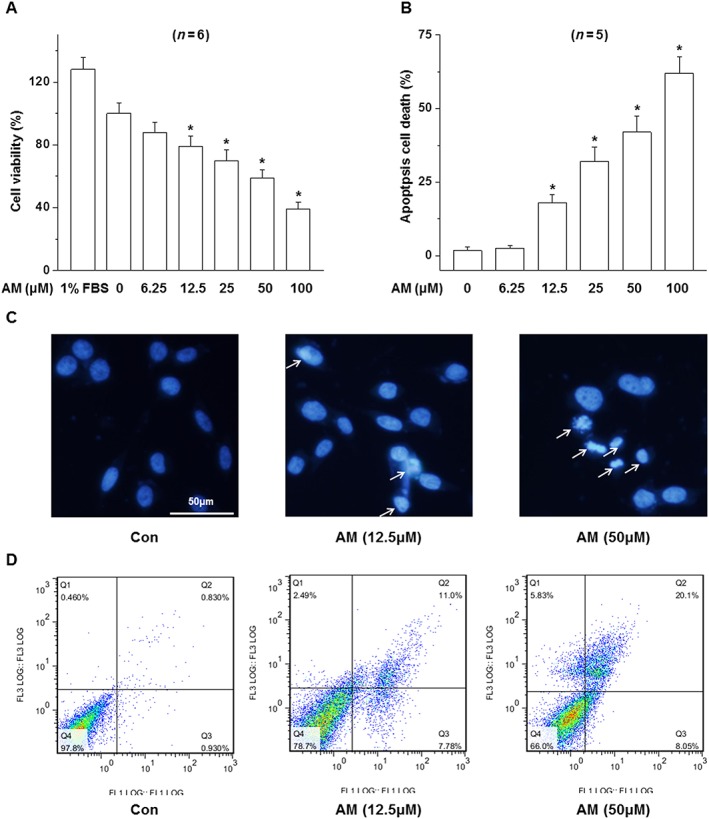
Effect of amiodarone (AM) on the survival and apoptosis of D407 cells. D407 cells were treated with various concentrations of amiodarone; (A) cell viability was determined by MTT; (B, C) the apoptosis was determined by Hoechst DNA colour staining (24 h) and (D) the Annexin V‐FITC/PI assay (16 h). Data are presented as means ± SEM of the results obtained from five to six experiment.*P < 0.05 versus control.
Effect of amiodarone on the level of ROS and MDA in D407 cells
Amiodarone reacts with superoxide anions resulting in the formation of peroxynitrite, which induces lipid peroxidation leading to neurotoxicity (Lu et al., 2013; Niimi et al., 2016). MDA, which is formed by the degradation of polyunsaturated lipids by ROS, is used as a marker of oxidative stress. We examined the effect of amiodarone on the levels of ROS and MDA in D407 cells. Amiodarone increased ROS and MDA production in a concentration‐dependent manner (Figure 2A, B).
Figure 2.
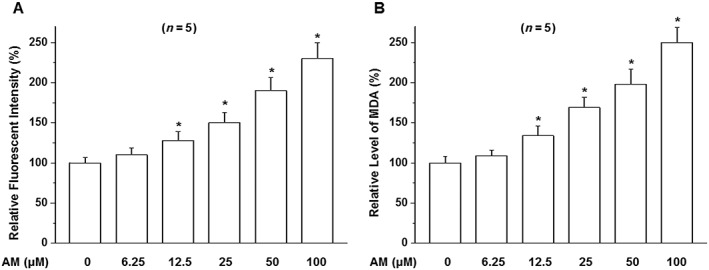
Effects of amiodarone (AM) on the generation of ROS and lipid peroxidation in D407 cells. D407 cells were treated as indicated in the figure with amiodarone and then stained by DCFH‐DA and analysed by fluorometry (A) to detect ROS or followed by the application of MDA detection kit (B) to measure MDA. Data are presented as means ± SEM of the results obtained from five experiments. *P < 0.05 versus control.
D407 cells showed a marked cytotoxic response when treated with amiodarone at 50 μM for 24 h. Therefore, these conditions were used in subsequent experiments to study the effect of amiodarone in D407 cells.
IGF‐1 promoted the survival of D407 cells and protected them from amiodarone‐induced toxicity
IGF‐1 is a survival‐promoting growth factor which also promotes the survival of D407 cells, but its effect on amiodarone‐induced toxicity is not known. We investigated the effect of IGF‐1 on the survival of D407 cells subjected to amiodarone‐induced toxicity using the MTT assay and Hoechst DNA dye staining. Both the MTT (Figure 3A) and Hoechst (Figure 3B, C) staining assay showed that IGF‐1 protected D407 cells from death induced by amiodarone in a concentration‐dependent manner.
Figure 3.
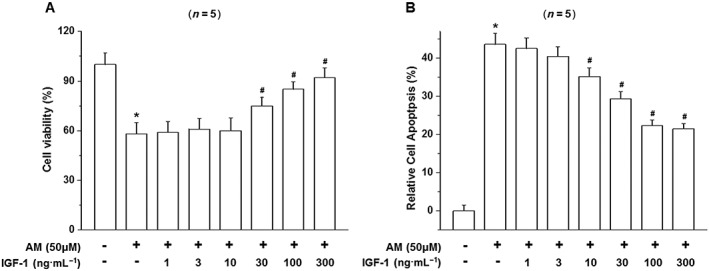
IGF‐1 prevents amiodarone‐induced cell death in D407 cells. (A) D407 cells were treated with various concentrations of IGF‐1 and exposed to toxic levels of amiodarone (AM). The viability of the cells was determined by the MTT assay. (B) The apoptosis of D407 cells was determined by Hoechst DNA staining and presented as the quantified data. Data are presented as means ± SEM of the results obtained from five experiments, #P < 0.05 versus control, *P < 0.05 versus amiodarone‐treated group.
Similar results were obtained in the ROS and MDA assays. Amiodarone increased the production of ROS (Figure 4A, B) and MDA (Figure 4C) while IGF‐1 treatment reversed these effects of amiodarone.
Figure 4.
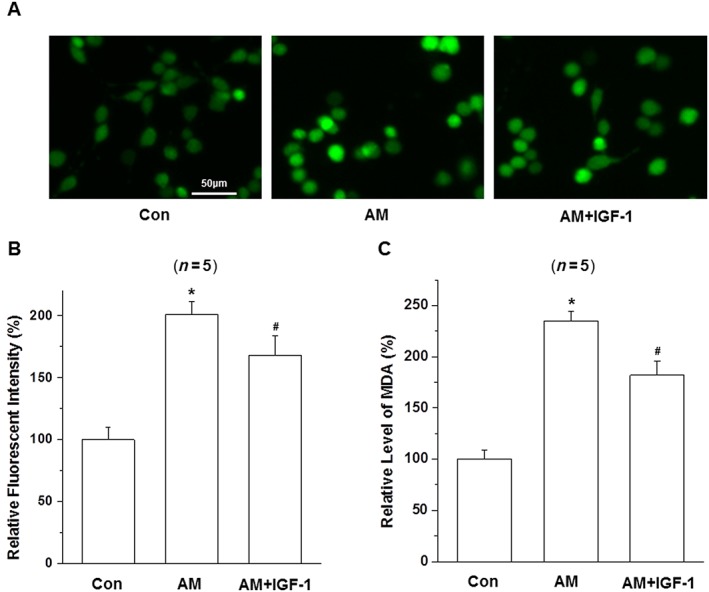
Effect of IGF‐1 on the activity of intracellular ROS and MDA in amiodarone (AM)‐treated D407 cells. (A–C) After pretreatment with IGF‐1(100 ng·mL−1) for 1 h, D407 cells were incubated with or without 50 μM amiodarone for another 24 h then stained with DCFH‐DA and analysed by fluorometry to detect ROS, or by the application of MDA detection kit to measure MDA; data are presented as means ± SEM of the results obtained from five experiments. #P < 0.05 versus control, *P < 0.05 versus amiodarone‐treated group.
IGF‐1 decreased amiodarone‐induced mitochondrial membrane potential failure and activation of caspase 3/7
Mitochondrial inhibition causes the loss of mitochondrial membrane potential (△ψm). To determine the effect of amiodarone and IGF‐1 on the mitochondrial membrane potential of D407 cells, the △ψm in D407 cells was assessed by analysing the red/green fluorescent intensity ratio of JC‐1 staining. Exposure of D407 cells to amiodarone (50 μM) resulted in an increase in green fluorescence intensity indicating △ψm dissipation (51%) (Figure 5A, B). Pretreatment with IGF‐1 at 100 ng·mL−1 for 1 h attenuated amiodarone‐induced △ψm loss (68%).
Figure 5.
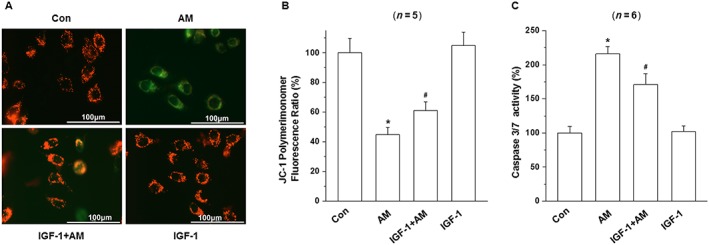
IGF‐1 attenuated amiodarone (AM)‐induced loss of mitochondrial membrane potential (△ψm) loss and increase in caspase 3/7 activity in D407 cells. (A, B) After pretreatment with IGF‐1(100 ng·mL−1) for 1 h, D407 cells were incubated with or without 50 μM amiodarone for another 6 h. The △ψm was determined by the JC‐1 assay. (C) Quantification of caspase 3/7 activity was determined by caspase 3/7 activity assay. Data are presented as means ± SEM of the results obtained from five to six experiments. #P < 0.05 versus control group; *P < 0.05 versus amiodarone‐treated group.
Caspase 3/7 is the main biomarker for the apoptosis of cells. As shown in Figure 5C, treatment of cells with 50 μM amiodarone for 6 h increased caspase 3/7 activity by more than twofold compared to the control group (220%). In contrast, pretreatment with IGF‐1 significantly reduced the caspase 3/7 activation induced by amiodarone (170%).
Effects of amiodarone on phosphorylation of Akt and ERK1/2
Having shown that IGF‐1 protected D407 cells from injury induced by amiodarone, we investigated the signalling pathways responsible for this protective action. The PI3K/Akt and the ERK pathways are two major pathways associated with the cell survival effects of IGF‐1. We therefore investigated the effect of amiodarone on the activity of these pathways. Amiodarone treatment resulted in a concentration (Figure 6A, C) and time‐dependent (Figure 6B, E) attenuation of the phosphorylation of Akt. A significant effect was apparent at a concentration of 6.25 μM and increased as the concentration of amiodarone increased (Figure 6A). Amiodarone (50 μM) significantly inhibited Akt phosphorylation at 3 h (P<0.05), and this effect was increased as the treatment time was extended. In contrast, treatment with amiodarone at the same concentration had no effect on the level of phosphorylated ERK1/2 in these cells at any time point or any concentration of amiodarone used (Figure 6A, B, D, F).
Figure 6.
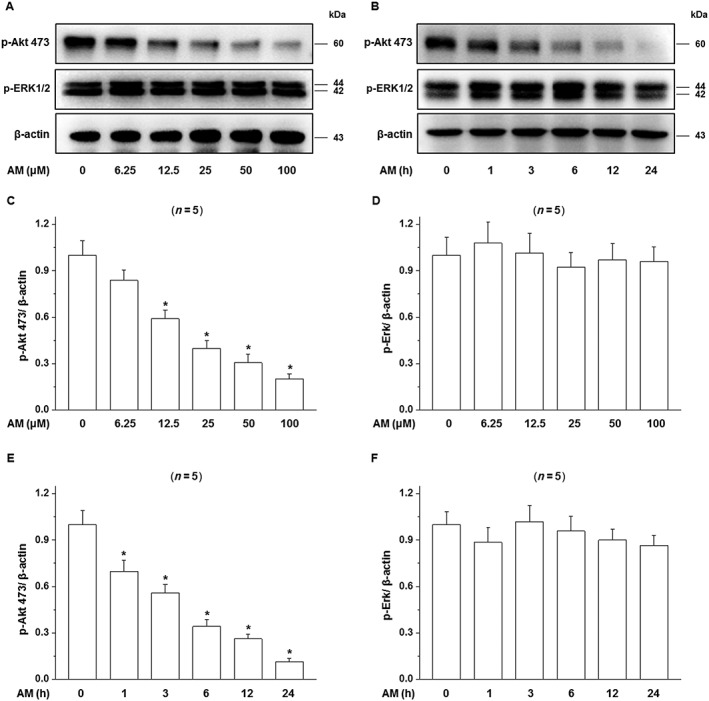
Effects of amiodarone (AM) on phosphorylation of the Akt and ERK1/2. (A, B) D407 cells were treated with 50 μM amiodarone for various times or with different concentrations of amiodarone for 24 h, and then, the phosphorylation of Akt and MAPK (ERK1/2) in D407 cells was determined as described in Methods. Blots and quantitative data (OD) are shown (C–F). Data are presented as means ± SEM of the results obtained from five experiments. *P < 0.05 versus control.
Activation of Akt was essential for the IGF‐1‐induced protection of D407 cells from amiodarone‐induced injury
To study the signalling pathway responsible for the protective effect of IGF‐1 on D407 cells, cells were pretreated with amiodarone (50 μM) in the presence of the PI3K inhibitor LY294002 (30 μM), the MAPK (ERK) kinase pathway inhibitor PD98059 (25 μM) or the p38 MAPK inhibitor PD160316 (10 μM) and then stimulated with IGF‐1 (100 ng·mL−1 for 24 h) and the viability and caspase 3/7 activity of cells was determined by the MTT assay and caspase assay respectively. The protective effect of IGF‐1 was abolished by the application of LY294002, while the MAPK pathway inhibitor PD98059 and p38 MAPK inhibitor PD160316 had no effect (Figure 7). Similar results were obtained from caspase 3/7 assays which showed that IGF‐1 failed to suppress the increase in caspase 3/7 activity in the presence of the PI3k/Akt pathway inhibitor (Figure 7B). These results indicate that the PI3k/Akt signalling pathway is involved in the protective effects of IGF‐1.
Figure 7.
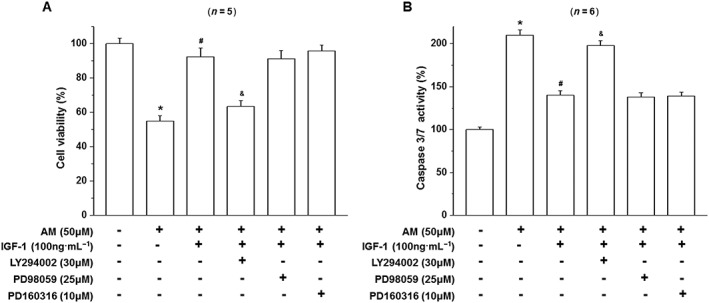
Effect of LY294002 and PD98059 on the activation of Akt and ERK1/2 and the survival effects of IGF‐1 on amiodarone‐treated D407 cells. D407 cells pretreated with LY294002 to block PI3K/Akt signalling or PD98059 to block the MAPK (ERK1/2) pathway were treated with IGF‐1 and then incubated with (AM) or without (CTL) amiodarone as indicated. Cell viability (A) and caspase 3/7 activity (B) were determined. Data are presented as means ± SEM of the results obtained from five to six experiments. #P < 0.05 versus control, *P < 0.05 versus amiodarone‐treated group.
Effect of amiodarone and IGF‐1 on the activation/phosphorylation of Akt
Having established that the PI3K/Akt signalling pathway is essential for the protective effect of IGF‐I on D407 cells from amiodarone‐induced toxicity, we studied the effect of amiodarone and IGF‐1 on the activation/phosphorylation of Akt. Amiodarone had an inhibitory effect on phosphorylation of Akt while IGF‐1 stimulated Akt phosphorylation and reversed the inhibitory effect of amiodarone on Akt phosphorylation (Figure 8). The PI3K inhibitor LY294002 completely inhibited IGF‐1 stimulated phosphorylation of Akt demonstrating that LY294002 at the concentration used in our conditions was able to block IGF‐1‐induced activation of Akt. These results supported the role of Akt in the protective effect of IGF‐1on D407 cells against amiodarone‐induced toxicity.
Figure 8.
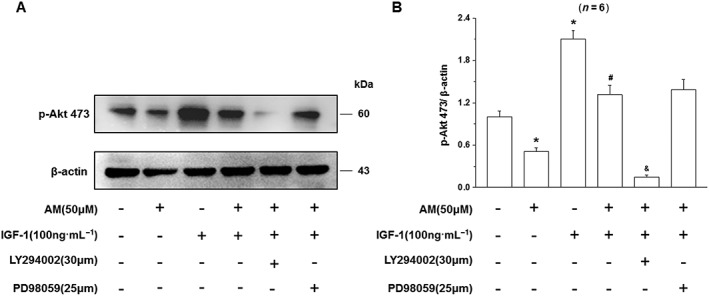
Effect of LY294002 on the activation of Akt and the IGF‐1 mediated attenuation of the damaging effects of amiodarone (AM) on D407 cells injury. D407 cells, pretreated with LY294002 to block PI3K/Akt signalling or PD98059 to block the MAPK (ERK1/2) pathway, were treated with IGF‐1 and then incubated with (AM) or without (CTL) amiodarone as indicated. Data are presented as means ± SEM of the results obtained from five experiments. #P < 0.05 versus control, *P < 0.05 versus amiodarone‐treated group.
IGF‐1 showed a protective effect and reversal of the effects of amiodarone on entoretina function as detected by FERG
Morphological injury after vitreous injected with amiodarone (1.5 μM) was observed by HE staining. Representatives of each group are shown in Figure 9B. Slight vacuolation and condensed nuclei of RPE were observed in the amiodarone group, while a reduction in RPE number, obvious oedema at the inner plexiform layer (IPL) and inner nuclear layer (INL) and condensed or fragmented nuclei of INL cells could be seen in the amiodarone‐treated group. These histological changes in the RPE, IPL and INL and reduced number of RPE cells were considerably less in the IGF‐1 + amiodarone group compared to the amiodarone group. Immunocytochemistry showed that vitreous IGF‐1 injections promoted the survival of RPE cells in rat retina and protects the expression of RPE65 in RPE cells from amiodarone‐induced impairments (Figure 9A).
Figure 9.
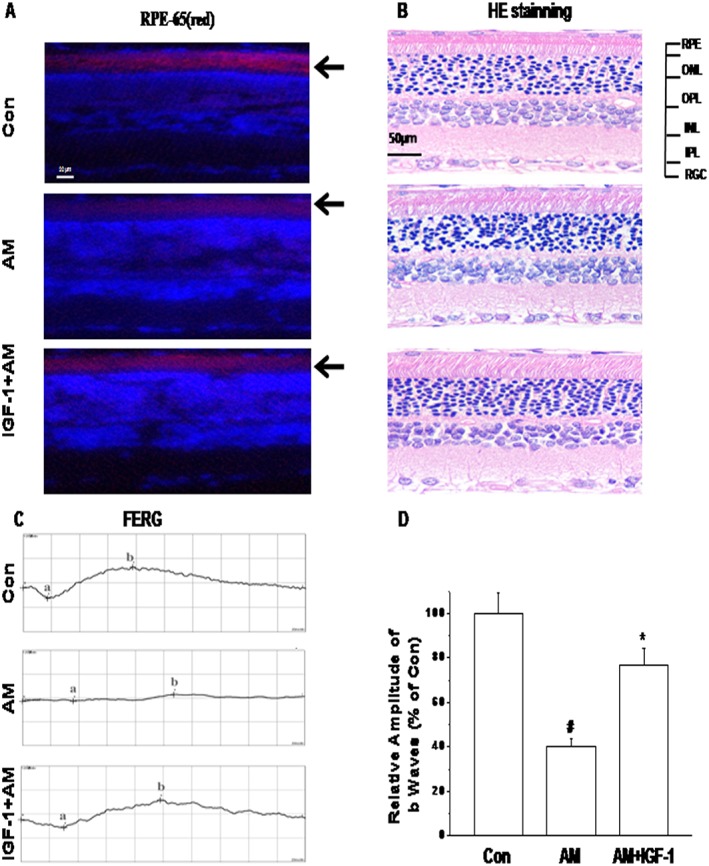
IGF‐1 showed a protective effect and reversal of the effects of amiodarone (AM) on entoretina function detected by FERG morphological injury after vitreous injection with amiodarone (1.5 μM). Representative photographs showing RPE‐65 protein expression in IGF‐1‐treated retina induced by photochemical damage detected by immunofluorescence staining (A) and haematoxylin–eosin staining of retinal sections (B). FERG was tested after 24 h. Rats were vitreous injected with normal saline 5 μL; amiodarone (1.5 μM) 2.5 μL + normal saline 2.5 μL, IGF‐1(100 ng·mL−1) 2.5 μL + AM (1.5 μM) 2.5 μL respectively. FERG studies were performed as described in Methods. Representatives of each group in Max reaction are shown (C, D). Data are presented as means ± SEM of the results obtained from five experiments. #P < 0.05 compared with control, *P < 0.05 compared with amiodarone.
To evaluate the retinal function among groups, FERG were performed after 24 h. Alterations in FERG were analysed as shown in Figure 9C, D. In the amiodarone (1.5 μM) group, b‐wave amplitudes of Max reaction in FERG were decreased compared to the control group. There was also a substantial reduction in a‐wave amplitudes of Max reaction compared to the control group. Other reactions in FERG showed no differences among the groups. The a‐wave and b‐wave amplitudes of Max reaction amplitude in FERG were all highly enhanced in the IGF‐1 + amiodarone‐treated group compared to the amiodarone group. These results demonstrate that IGF‐1 had a protective effect on entoretinal function after amiodarone treatment (Figure 10).
Figure 10.
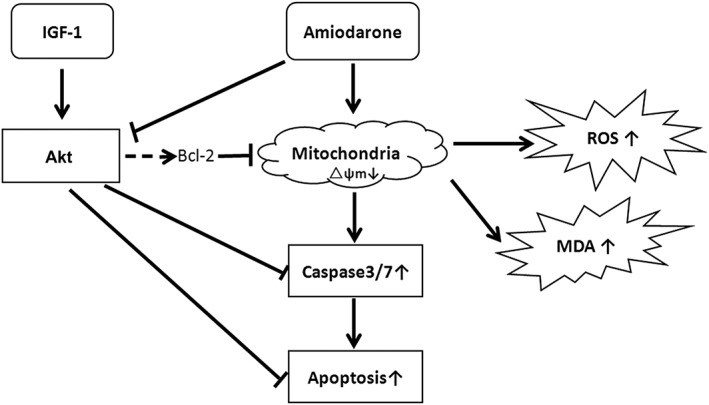
Schematic presentation of the antioxidant and protective effects of IGF‐1 on amiodarone‐treated human retinal pigment epithelial cells. Amiodarone inhibited the activation of Akt, increased ROS/MDA and induced mitochondrial membrane failure and the activation of caspase, causing the apoptosis of D407 cells while IGF‐1 reversed the effects of amiodarone and promoted the survival of D407 cells.
Discussion
Although amiodarone is an effective and commonly used anti‐arrhythmic drug, at present its use is limited due to its toxicity (Roberts, 2010; Mosher, 2011; Kim et al., 2014; Park and Kim, 2014). Impaired vision is one of the main causes for the discontinuation of amiodarone therapy especially for patients on long‐term treatment. Toxicity usually begins with corneal deposits, microdeposits, visual disturbance and progresses slowly to the vision impairment with optic neuritis, toxic optic neuropathy and/or blindness (Miguel et al., 2014; Cheng et al., 2015; Turk et al., 2015). The mechanisms of amiodarone toxicity have not been defined; however, one hypothesis is that they are due to an increase in mitochondrial H2O2 synthesis, which induces oxidative injury (Leeder et al., 1994; Serviddio et al., 2011; Cheng et al., 2015; Pomponio et al., 2015; Niimi et al., 2016).
We found that lower amiodarone concentrations induce retinal ganglionic cell (RGC) death (LC50 = 2 μM) (Liao et al., 2017). RPE cells are less sensitive to amiodarone (LC50 = 50 μM) compared to RGC cells. This is an interesting phenomenon; although RGCs and RPEs are different cell types, with RGCs being a neuronal cell line, whereas RPE is retinal epithelial cell line, so the cells have considerably different expressions of phenotype including, for example, different types and densities of cell survival receptors. In this study, we characterized the effect of amiodarone on the viability of RPE cells using the human cell line D407. We found that amiodarone treatment resulted in the collapse of the △ψm, and an increase in ROS in RPE cells, while pretreatment of these cells with IGF‐1 was able to suppress these changes. Apoptosis is a frequent type of cell death observed in RPE cells. The decrease in cell viability, the increase of MDA release and nuclear morphological changes induced by amiodarone were suppressed by IGF‐1 (Figures 3, 4, 5), suggesting that the antioxidant activity of IGF‐1 contributes to its protective effects. The concentration range of IGF‐1 (10–300 ng·mL−1) used in our experiments had no toxicity in D407 cells and is therapeutically relevant based on the in vitro quantification of IGF‐1's effects at these concentrations. The protective effect of IGF‐1 was further confirmed by the FERG analysis, which showed it reversed the effects of amiodarone on entoretinal function (Figure 9).
Multiple studies in various cells and cell lines have demonstrated that IGF‐1 can protect cells from damage induced by various stimuli and interestingly different signalling pathways have been identified as mediating the effects of IGF‐1 (Zheng et al., 2002). Barber et al. (2001) observed, in a rat model of diabetes with hyperglycaemia induced by STZ, that recombinant human IGF‐1 inhibits the activity of caspase 3 and protects cells from damage through activating the PI3K‐Akt pathway. Our in vitro experiments also showed that IGF‐1 can concentration‐dependently protect D407 cells from the damage induced by amiodarone. When D407 cells were pretreated with IGF‐1(100 ng·mL−1 for 1 h) before the amiodarone treatment, the cell survival rate was increased by approximately 68% (see Figure 3B).
Apoptosis of retinal cells caused by oxidative stress is one of the key features of retinopathy. High levels of amiodarone are toxic to cells (Mancardi et al., 2011), and amiodarone increases the damage in patients with retinopathy (Rosales et al., 2014). The elevation of amiodarone in these tissues results in the RPE cells being injured and eventually contributes to the occurrence and development of retinopathy. D407 cells are a human RPE cell line widely used in the study of survival and death of RPE cells. Therefore, we established a cell damage model in D407 cells based on amiodarone‐induced toxicity and used this model to investigate the protective effect of IGF‐1 against this toxicity induced by amiodarone in D407 cells. Amiodarone caused inhibition of Akt and apoptotic cell death of D407 cells while the application of IGF‐1 promoted the activation of Akt, reversed the inhibitory effect of amiodarone on Akt activation and promoted the survival of these amiodarone‐treated D407 cells. These results support the key role of PI3K/Akt in the action of amiodarone and IGF‐1. Consistent with this, our results also showed that IGF‐1 failed to suppress amiodarone‐induced cytotoxicity and the increase of caspase 3/7 activity in the presence of the PI3K/Akt inhibitor LY294002 (Figure 7B). Thus, the blockade of Akt by the PI3K/Akt pathway inhibitor abolished the protective effect of IGF‐1. These results indicate that the protective effect of IGF‐1 on D407 cells is mediated by the PI3K/Akt pathway.
There is an important question as to whether or not there is a correlation or causative relationship between the level of amiodarone in the serum or vitreous cavity and the formation and development of amiodarone toxicity (retinopathy). Currently, there are no data on these issues in eye tissue (Pfeiffer et al., 1997; Simo et al., 2002). In patients with type 1 and type 2 diabetes, with increased capillary permeability and a damaged blood–retinal barrier, amiodarone in the serum can enter into the vitreous cavity, resulting in raised concentrations of amiodarone in the vitreous cavity (Acerini et al., 1997). The amiodarone metabolite, N‐desethylamiodarone (DEA), accumulates to high levels in tissues during amiodarone therapy, and probably is an important contributor to clinical amiodarone toxicity. Both amiodarone and DEA accumulate in the tissues due to their amphiphilic nature (Rodrigues et al., 2013). Consideration of the findings in the current paper along with ongoing studies in animal models and even clinical studies might provide a better understanding of the role of amiodarone/DEA in the aetiology of retinal disease.
In conclusion, amiodarone induced cell death by apoptosis of D407 cells and its toxic effects could be attenuated by treatment with IGF‐1. IGF‐1 stimulates both the PI3K and MAPK pathways, but the cell survival effect occurred through the PI3K/Akt signalling pathway. Furthermore, FERG in vivo recording in rats showed that amiodarone decreases the a‐wave and b‐wave of FERG while IGF‐1 reverses these effects of amiodarone. Immunocytochemistry confirmed that vitreous IGF‐1 injections promote the survival of RPE cells in rat retina and protect the expression of RPE65 in RPE cells from amiodarone injury. These results indicate that IGF‐1 is able to protect RPE cells from amiodarone‐mediated injury via the PI3K/ Akt pathway in vivo and in vitro. Thus, IGF‐1 or potentially other agents that stimulate the PI3K pathway may be able to attenuate amiodarone‐induced toxicity. These results also extend the cell survival effects of IGF‐1 to another cell type and provide indications for potential new targets and approaches that can be considered for the treatment of arrhythmias with amiodarone while minimizing retinal toxicity.
Author contributions
R.L. and W.Z. contributed to the experimental design; R.L., F.Y. and J.X. performed the experiments; R.L., F.Y., Z.Z., H.W., K.Q. and J.X. analysed the data; R.L. and Z.Z. wrote the manuscript; and R.L., F.Y., Z.Z., W.H. and W.Z. edited the manuscript.
Conflict of interest
The authors declare no conflicts of interest.
Declaration of transparency and scientific rigour
This Declaration acknowledges that this paper adheres to the principles for transparent reporting and scientific rigour of preclinical research recommended by funding agencies, publishers and other organisations engaged with supporting research.
Acknowledgements
This research was financially supported by the Guangdong Provincial Project of Science and Technology (2011B050200005), SRG2015‐00004‐FHS and MYRG2016‐00052‐FHS from the University of Macau, the Science and Technology Development Fund (FDCT) of Macao (FDCT 021/2015/A1 and 016/2016/A1) and the National Natural Science Foundation of China (31371088), Guangdong Natural Science Foundation (2014A030310039). We also want to really appreciate the excellent English proof read of Prof. Peter Little and Dr. Uma Guar.
The sources of funding had no role in the design and conduct of this project or in the preparation of the manuscript.
Liao, R. , Yan, F. , Zeng, Z. , Wang, H. , Qiu, K. , Xu, J. , and Zheng, W. (2018) Insulin‐like growth factor‐1 activates PI3K/Akt signalling to protect human retinal pigment epithelial cells from amiodarone‐induced oxidative injury. British Journal of Pharmacology, 175: 125–139. doi: 10.1111/bph.14078.
Contributor Information
Rifang Liao, Email: liaorf@mail.sysu.edu.cn.
Wenhua Zheng, Email: wenhuazheng@umac.mo.
References
- Acerini CL, Patton CM, Savage MO, Kernell A, Westphal O, Dunger DB (1997). Randomised placebo‐controlled trial of human recombinant insulin‐like growth factor I plus intensive insulin therapy in adolescents with insulin‐dependent diabetes mellitus. Lancet 350: 1199–1204. [DOI] [PubMed] [Google Scholar]
- Alexander SPH, Fabbro D, Kelly E, Marrion NV, Peters JA, Faccenda E et al (2017a). The Concise Guide To PHARMACOLOGY 2017/18: Catalytic receptors. Br J Pharmacol 174: S225–S271. [DOI] [PMC free article] [PubMed] [Google Scholar]
- Alexander SPH, Fabbro D, Kelly E, Marrion NV, Peters JA, Faccenda E et al (2017b). The Concise Guide To PHARMACOLOGY 2017/18: Enzymes. Br J Pharmacol 174: S272–S359. [DOI] [PMC free article] [PubMed] [Google Scholar]
- Atienzar‐Aroca S, Flores‐Bellver M, Serrano‐Heras G, Martinez‐Gil N, Barcia JM, Aparicio S et al (2016). Oxidative stress in retinal pigment epithelium cells increases exosome secretion and promotes angiogenesis in endothelial cells. J Cell Mol Med 20: 1457–1466. [DOI] [PMC free article] [PubMed] [Google Scholar]
- Ayadi AE, Zigmond MJ, Smith AD (2016). IGF‐1 protects dopamine neurons against oxidative stress: association with changes in phosphokinases. Exp Brain Res 234: 1863–1873. [DOI] [PMC free article] [PubMed] [Google Scholar]
- Barber AJ, Nakamura M, Wolpert EB, Reiter CE, Seigel GM, Antonetti DA et al (2001). Insulin rescues retinal neurons from apoptosis by a phosphatidylinositol 3‐kinase/Akt‐mediated mechanism that reduces the activation of caspase‐3. J Biol Chem 276: 32814–32821. [DOI] [PubMed] [Google Scholar]
- Bu SY, Yu GH, Xu GX (2013). Expression of insulin‐like growth factor 1 receptor in rat retina following optic nerve injury. Acta Ophthalmol 91: e427–e431. [DOI] [PubMed] [Google Scholar]
- Chen Q, Wang H, Liao S, Gao Y, Liao R, Little PJ et al (2015). Nerve growth factor protects retinal ganglion cells against injury induced by retinal ischemia‐reperfusion in rats. Growth Factors 33: 149–159. [DOI] [PubMed] [Google Scholar]
- Cheng HC, Yeh HJ, Huang N, Chou YJ, Yen MY, Wang AG (2015). Amiodarone‐associated optic neuropathy: a nationwide study. Ophthalmology 122: 2553–2559. [DOI] [PubMed] [Google Scholar]
- Curtis MJ, Bond RA, Spina D, Ahluwalia A, Alexander SP, Giembycz MA et al (2015). Experimental design and analysis and their reporting: new guidance for publication in BJP. Br J Pharmacol 172: 3461–3471. [DOI] [PMC free article] [PubMed] [Google Scholar]
- Folgar FA, Yuan EL, Sevilla MB, Chiu SJ, Farsiu S, Chew EY et al (2016). Drusen volume and retinal pigment epithelium abnormal thinning volume predict 2‐year progression of age‐related macular degeneration. Ophthalmology 123: 39–50. [DOI] [PubMed] [Google Scholar]
- Golan S, Levi R, Entin‐Meer M, Barak A (2014). The effects of vital dyes on retinal pigment epithelium cells in oxidative stress. Ophthalmic Res 52: 147–150. [DOI] [PubMed] [Google Scholar]
- Holtkamp GM, Kijlstra A, Peek R, de Vos AF (2001). Retinal pigment epithelium‐immune system interactions: cytokine production and cytokine‐induced changes. Prog Retin Eye Res 20: 29–48. [DOI] [PubMed] [Google Scholar]
- Kennedy CJ, Rakoczy PE, Constable IJ (1996). A simple flow cytometric technique to quantify rod outer segment phagocytosis in cultured retinal pigment epithelial cells. Curr Eye Res 15: 998–1003. [DOI] [PubMed] [Google Scholar]
- Kervinen M, Falck A, Hurskainen M, Hautala N (2013). Bilateral optic neuropathy and permanent loss of vision after treatment with amiodarone. J Cardiovasc Pharmacol 62: 394–396. [DOI] [PubMed] [Google Scholar]
- Kilkenny C, Browne W, Cuthill IC, Emerson M, Altman DG (2010). Animal research: reporting in vivo experiments: the ARRIVE guidelines. Br J Pharmacol 160: 1577–1579. [DOI] [PMC free article] [PubMed] [Google Scholar]
- Kim HL, Seo JB, Chung WY, Kim SH, Kim MA, Zo JH (2014). The incidence and predictors of overall adverse effects caused by low dose amiodarone in real‐world clinical practice. Korean J Intern Med 29: 588–596. [DOI] [PMC free article] [PubMed] [Google Scholar]
- Leeder RG, Brien JF, Massey TE (1994). Investigation of the role of oxidative stress in amiodarone‐induced pulmonary toxicity in the hamster. Can J Physiol Pharmacol 72: 613–621. [DOI] [PubMed] [Google Scholar]
- Liao R, Yan F, Zeng Z, Farhan M, Little P, Quirion R et al (2017). Amiodarone‐induced retinal neuronal cell apoptosis attenuated by IGF‐1 via counter regulation of the PI3k/Akt/FoxO3a pathway. Mol Neurobiol 54: 6931–6943. [DOI] [PubMed] [Google Scholar]
- Lu J, Miyakawa K, Roth RA, Ganey PE (2013). Tumor necrosis factor‐alpha potentiates the cytotoxicity of amiodarone in Hepa1c1c7 cells: roles of caspase activation and oxidative stress. Toxicol Sci 131: 164–178. [DOI] [PMC free article] [PubMed] [Google Scholar]
- Mancardi D, Pla AF, Moccia F, Tanzi F, Munaron L (2011). Old and new gasotransmitters in the cardiovascular system: focus on the role of nitric oxide and hydrogen sulfide in endothelial cells and cardiomyocytes. Curr Pharm Biotechnol 12: 1406–1415. [DOI] [PubMed] [Google Scholar]
- Martin DM, Yee D, Feldman EL (1992). Gene expression of the insulin‐like growth factors and their receptors in cultured human retinal pigment epithelial cells. Brain Res Mol Brain Res 12: 181–186. [DOI] [PubMed] [Google Scholar]
- McGrath JC, Lilley E (2015). Implementing guidelines on reporting research using animals (ARRIVE etc.): new requirements for publication in BJP. Br J Pharmacol 172: 3189–3193. [DOI] [PMC free article] [PubMed] [Google Scholar]
- Miguel A, Henriques F, Azevedo LF, Pereira AC (2014). Ophthalmic adverse drug reactions to systemic drugs: a systematic review. Pharmacoepidemiol Drug Saf 23: 221–233. [DOI] [PubMed] [Google Scholar]
- Mindel JS (2014). Absence of amiodarone‐associated optic neuropathy. Ophthalmology 121: 2074–2075. [DOI] [PubMed] [Google Scholar]
- Miranda S, Gonzalez‐Rodriguez A, Garcia‐Ramirez M, Revuelta‐Cervantes J, Hernandez C, Simo R et al (2012). Beneficial effects of fenofibrate in retinal pigment epithelium by the modulation of stress and survival signaling under diabetic conditions. J Cell Physiol 227: 2352–2362. [DOI] [PubMed] [Google Scholar]
- Mosher MC (2011). Amiodarone‐induced hypothyroidism and other adverse effects. Dimens Crit Care Nurs 30: 87–93. [DOI] [PubMed] [Google Scholar]
- Nicolescu AC, Ji Y, Comeau JL, Hill BC, Takahashi T, Brien JF et al (2008). Direct mitochondrial dysfunction precedes reactive oxygen species production in amiodarone‐induced toxicity in human peripheral lung epithelial HPL1A cells. Toxicol Appl Pharmacol 227: 370–379. [DOI] [PubMed] [Google Scholar]
- Niimi N, Yako H, Tsukamoto M, Takaku S, Yamauchi J, Kawakami E et al (2016). Involvement of oxidative stress and impaired lysosomal degradation in amiodarone‐induced schwannopathy. Eur J Neurosci 44: 1723–1733. [DOI] [PubMed] [Google Scholar]
- Park HS, Kim YN (2014). Adverse effects of long‐term amiodarone therapy. Korean J Intern Med 29: 571–573. [DOI] [PMC free article] [PubMed] [Google Scholar]
- Pfeiffer A, Spranger J, Meyer‐Schwickerath R, Schatz H (1997). Growth factor alterations in advanced diabetic retinopathy: a possible role of blood retina barrier breakdown. Diabetes 46 (Suppl 2): S26–S30. [DOI] [PubMed] [Google Scholar]
- Pomponio G, Zurich MG, Schultz L, Weiss DG, Romanelli L, Gramowski‐Voss A et al (2015). Amiodarone biokinetics, the formation of its major oxidative metabolite and neurotoxicity after acute and repeated exposure of brain cell cultures. Toxicol In Vitro 30 (1 Pt A): 192–202. [DOI] [PubMed] [Google Scholar]
- Roberts M (2010). Clinical utility and adverse effects of amiodarone therapy. AACN Adv Crit Care 21: 333–338 339‐340. [DOI] [PubMed] [Google Scholar]
- Rodrigues M, Alves G, Ferreira A, Queiroz J, Falcao A (2013). A rapid HPLC method for the simultaneous determination of amiodarone and its major metabolite in rat plasma and tissues: a useful tool for pharmacokinetic studies. J Chromatogr Sci 51: 361–370. [DOI] [PubMed] [Google Scholar]
- Rosales MA, Silva KC, Duarte DA, de Oliveira MG, de Souza GF, Catharino RR et al (2014). S‐nitrosoglutathione inhibits inducible nitric oxide synthase upregulation by redox posttranslational modification in experimental diabetic retinopathy. Invest Ophthalmol Vis Sci 55: 2921–2932. [DOI] [PubMed] [Google Scholar]
- Serviddio G, Bellanti F, Giudetti AM, Gnoni GV, Capitanio N, Tamborra R et al (2011). Mitochondrial oxidative stress and respiratory chain dysfunction account for liver toxicity during amiodarone but not dronedarone administration. Free Radic Biol Med 51: 2234–2242. [DOI] [PubMed] [Google Scholar]
- Simo R, Lecube A, Segura RM, Garcia AJ, Hernandez C (2002). Free insulin growth factor‐I and vascular endothelial growth factor in the vitreous fluid of patients with proliferative diabetic retinopathy. Am J Ophthalmol 134: 376–382. [DOI] [PubMed] [Google Scholar]
- Slomiany MG, Rosenzweig SA (2004). IGF‐1‐induced VEGF and IGFBP‐3 secretion correlates with increased HIF‐1 alpha expression and activity in retinal pigment epithelial cell line D407. Invest Ophthalmol Vis Sci 45: 2838–2847. [DOI] [PubMed] [Google Scholar]
- Southan C, Sharman JL, Benson HE, Faccenda E, Pawson AJ, Alexander SPH et al (2016). The IUPHAR/BPS guide to PHARMACOLOGY in 2016: towards curated quantitative interactions between 1300 protein targets and 6000 ligands. Nucl Acids Res 44: D1054–D1068. [DOI] [PMC free article] [PubMed] [Google Scholar]
- Sridhar J, Shahlaee A, Rahimy E, Hong B, Shields CL (2016). Optical coherence tomography angiography of combined hamartoma of the retina and retinal pigment epithelium. Retina . [DOI] [PubMed] [Google Scholar]
- Sun C, Meng Q, Zhang L, Wang H, Quirion R, Zheng W (2012). Glutamate attenuates IGF‐1 receptor tyrosine phosphorylation in mouse brain: possible significance in ischemic brain damage. Neurosci Res 74: 290–297. [DOI] [PubMed] [Google Scholar]
- Turk U, Turk BG, Yilmaz SG, Tuncer E, Alioglu E, Dereli T (2015). Amiodarone‐induced multiorgan toxicity with ocular findings on confocal microscopy. Middle East Afr J Ophthalmol 22: 258–260. [DOI] [PMC free article] [PubMed] [Google Scholar]
- Wang H, Liao S, Geng R, Zheng Y, Liao R, Yan F et al (2015). IGF‐1 signaling via the PI3K/Akt pathway confers neuroprotection in human retinal pigment epithelial cells exposed to sodium nitroprusside insult. J Mol Neurosci 55: 931–940. [DOI] [PubMed] [Google Scholar]
- Wang R, Zhao J, Zhang L, Peng L, Zhang X, Zheng W et al (2016). Genipin derivatives protect RGC‐5 from sodium nitroprusside‐induced nitrosative stress. Int J Mol Sci 17: E117. [DOI] [PMC free article] [PubMed] [Google Scholar]
- Yan F, Liao R, Farhan M, Wang T, Chen J, Wang Z et al (2016). Elucidating the role of the FoxO3a transcription factor in the IGF‐1‐induced migration and invasion of uveal melanoma cancer cells. Biomed Pharmacother 84: 1538–1550. [DOI] [PubMed] [Google Scholar]
- Zheng W, Chong CM, Wang H, Zhou X, Zhang L, Wang R et al (2016). Artemisinin conferred ERK mediated neuroprotection to PC12 cells and cortical neurons exposed to sodium nitroprusside‐induced oxidative insult. Free Radic Biol Med 97: 158–167. [DOI] [PubMed] [Google Scholar]
- Zheng W, Meng Q, Wang H, Yan F, Little PJ, Deng X et al (2017). IGF‐1‐mediated survival from induced death of human primary cultured retinal pigment epithelial cells is mediated by an Akt‐dependent signaling pathway. Mol Neurobiol. https://doi.org/10.1007/s12035-017-0447-0 [Epub ahead of print] [DOI] [PubMed] [Google Scholar]
- Zeng Z, Wang X, Bhardwaj SK, Zhou X, Little PJ, Quirion R et al (2017). The atypical antipsychotic agent, clozapine, protects against corticosterone‐induced death of PC12 cells by regulating the Akt/FoxO3a signaling pathway. Mol Neurobiol 54: 3395–3406. [DOI] [PubMed] [Google Scholar]
- Zheng WH, Quirion R (2006). Insulin‐like growth factor‐1 (IGF‐1) induces the activation/phosphorylation of Akt kinase and cAMP response element‐binding protein (CREB) by activating different signaling pathways in PC12 cells. BMC Neurosci 7: 51. [DOI] [PMC free article] [PubMed] [Google Scholar]
- Zheng WH, Quirion R (2009). Glutamate acting on N‐methyl‐D‐aspartate receptors attenuates insulin‐like growth factor‐1 receptor tyrosine phosphorylation and its survival signaling properties in rat hippocampal neurons. J Biol Chem 284: 855–861. [DOI] [PubMed] [Google Scholar]
- Zheng WH, Kar S, Quirion R (2002). Insulin‐like growth factor‐1‐induced phosphorylation of transcription factor FKHRL1 is mediated by phosphatidylinositol 3‐kinase/Akt kinase and role of this pathway in insulin‐like growth factor‐1‐induced survival of cultured hippocampal neurons. Mol Pharmacol 62: 225–233. [DOI] [PubMed] [Google Scholar]


