

Abstract
In myotonic dystrophy type 1, several studies have suggested causal relationships between CTG repeat length and the severity of symptoms, such as weakness or myotonia. We aimed to explore these relationships in a large population of 144 DM1 patients. All patients underwent clinical and functional assessments using a standardized test for grip strength and myotonia assessment. Myotonia was assessed using a fully automatic software based on mathematical modeling of relaxation force curve. CTG repeat length was statistically correlated with both myotonia and grip strength, which are two major primary neuromuscular symptoms of DM1 patients. However, these relationships are not clinically meaningful and not predictive at the individual level.
Introduction
Myotonia and muscle weakness are two main primary neuromuscular features in patients suffering from myotonic dystrophy type 1 (DM1). Both myotonia and muscle weakness are generally evidenced during maximal grip contractions1, 2, 3, 4 and have been used as hallmarks of disease severity. DM1 is caused by expansion of a CTG trinucleotide repeat in the noncoding region of the DMPK gene. Despite large interindividual variations, the length of CTG repeat is thought to be a rough determinant of disease severity. Leukocyte DNA CTG repeat length has been found to be correlated with myotonia5, 6 and with muscle strength.6, 7, 8 Other studies did not observe such correlations between CTG repeat length and myotonia7, 9, 10 or between CTG repeat length and muscle strength.9 However, the number of patients included in these studies was rather small (between 14 and 38). It is thus still controversial to use myotonia and muscle strength as outcomes related to the CTG repeat length measured on leukocytes. In order to address this shortcoming, the aim of this study was to revisit this issue with a large cohort of DM1 patients.
Materials and Methods
Participants and study design
The data included in the present study were acquired from 2009 to 2016 within the frame of several clinical trials or during yearly clinical consultations. The results of all this studies were pooled together in order to perform a meta‐analysis aiming to answer the initial scientific question. A smaller population of controls was also assessed. The data were collected independently in three centers: Institute of Myology at the Pitié‐Salpêtrière Hospital (Paris, France), Henri Mondor Hospital (Créteil, France), and Québec Hospital (Québec, Canada). Disease duration and Muscular Impairment Rating Scale (MIRS) were collected for most of the patients.
Standard protocol approvals, registrations, and patient consents
All patients involved in trials gave written informed consent prior to participation in this study. The Local Ethics Committee approved the study protocols in France and Québec. Some patients were assessed in Québec Hospital as part of their routine yearly evaluation.
Genetic analysis
The size of CTG repeat expansion mutation was assessed by Southern blot analysis. An amount of 10 μg of DNA extracted from peripheral blood samples was digested using two restriction enzymes (EcoRI and BamHI) following the manufacturer's conditions and electrophoresed on agarose gel (0.8%) for 24 h at 50 V. The gel was depurinated, denatured, neutralized and the DNA fragments were transferred to a positive nitrocellulose membrane (Roche). Filter was hybridized to the (a‐32P)‐dCTP‐labeled 5 cDNA25 probe at 65°C for 18 h. Before autoradiography, the filter was washed to a final stringency of 0.1X SSC, 0.1% SDS at 65°C for 10–30 min. Since 2014, filters were probed with cDNA25 labeled using the nonradioactive PCR DIG probe synthesis kit (Roche). Probe hybridization and detection was made following the manufacturer's conditions [DIG Easy Hyb, Anti‐Digoxigenin AB, CDP Star (Roche)].
Strength and myotonia assessments
The data of grip strength and myotonia were collected in all centers using the same experimental protocol following strict standardized operating procedures. The test (namely, the MyoTone Test) was developed in 2008 in order to assess in less than 10 min reaction time, maximal voluntary contraction (MVC) for hand grip and myotonia after a submaximal grip contraction at 70%MVC sustained during 5 sec.9
Signal processing
A fully automatic method was validated in order to process the relaxation force curve and to improve myotonia estimation by overcoming drawbacks mainly due to unstable force, odd peaks, or digital noise. Signal processing was performed automatically using the mathematical modeling of the force relaxation curve following the contraction at 70% MVC.9 When a subject is asked to relax a grip contraction, the force globally decreases according to an asymmetric sigmoid function. All force curve analyses were then performed using a regression model according to a Richards equation using a specific software (MyoTonIM software, Institut de Myologie, Paris, France). The inverse function leads to the direct computation of various relaxation times (RT) corresponding to given percentages of the average strength maintained just before relaxation. RT between 90 and 10% of relaxation (RT[90–10]%) was kept as a myotonia estimate for further analyses. Test–retest reliability of strength and RT(90–10)% for DM1 patients has been shown to be excellent.9
MVC was expressed in percentage of predicted values calculated from a predictive model using age, sex, and height using the data already published.11
Statistical analyses
Since all variables were not normally distributed for the DM1 population (Kolmogorov–Smirnov test), nonparametric tests were used. The variables were analyzed first to test a possible center effect using a Kruskal–Wallis test. Differences between patients and controls were assessed using a Mann–Whitney test. Possible correlations between strength, myotonia and CTG repeat length were assessed using a Spearman correlation test. A P value lower than 0.05 was considered significant.
Results
Population description
Pooling all the data from the different studies together yielded a total of 144 patients and 44 controls. Their characteristics are given in Table 1. At the time of evaluation, MIRS varied between 1 and 5 (none to severe impairment), with a prevalence of grade 3 and 4 (3 patients with MIRS 1, 17 with MIRS 2, 62 with MIRS 3, 36 with MIRS 4, 8 with MIRS 5). Age of symptom‐onset ranged between 1 and 57 years (22.3 ± 11.7 years). Time from disease onset ranged between 2 and 49 years (20.6 ± 11.3 years). Time between genetic test and assessment was uniformly distributed, ranging from 1 to 20 years.
Table 1.
Characteristics of controls and DM1 patients
| Controls | DM1 | P | |
|---|---|---|---|
| n | 44 | 144 | |
| Women (%) | 24 (54%) | 76 (53%) | 0.837 |
| Age (years) | 40.2 ± 11.5 | 42.2 ± 11.0 | 0.324 |
| Height (cm) | 171.3 ± 7.8 | 167.7 ± 8.5 | 0.008 |
| Weight (kg) | 70.9 ± 12.6 | 69.7 ± 17.6 | 0.396 |
| CTG repeat (n) | NA | 679 ± 414 | NA |
| Grip strength (N) | 371.5 ± 103.8 | 125.2 ± 80.7 | <0.001 |
| Grip strength (% predictive) | 101.0 ± 13.8 | 35.4 ± 19.4 | <0.001 |
| RT (90–10)% (msec) | 89.1 ± 17.4 | 261.5 ± 332.3 | <0.001 |
Muscle weakness and myotonia assessment
The patients were significantly weaker than controls (P < 0.0001). Their remaining strength was divided by about 3 compared to the normal strength (see Table 1). Their relaxation times were also largely increased (P < 0.0001) and were about three times higher than in control subjects. While their age and their CTG expansion were similar, DM1 men exhibited lower strength than women when expressed in percentage of predicted values (P = 0.020) and larger RT(90–10)% (P = 0.009). There was no detectable center effect on all variables.
Muscle strength was correlated with the MIRS (ρ = −0.326, P < 0.0001), while RT(90–10%) was not (ρ = 0.137, P = 0.443). Disease duration was neither correlated with muscle strength (ρ = −0.140, P = 0.124) nor with relaxation time (ρ = 0.079, P = 0.390).
Relationships between muscle weakness and myotonia with CTG repeat length
Figure 1 shows the relationships between CTG repeat length, grip strength, and grip myotonia. CTG repeat length was statistically correlated with strength expressed either in absolute values (ρ = −0.293, P < 0.001) or in percentage of predicted value (ρ = −0.269, P = 0.002) and with RT(90–10)% (ρ = 0.229, P = 0.008). Strength expressed in relative values and RT(90–10)% were also significantly correlated (ρ = −0.181, P = 0.031).
Figure 1.
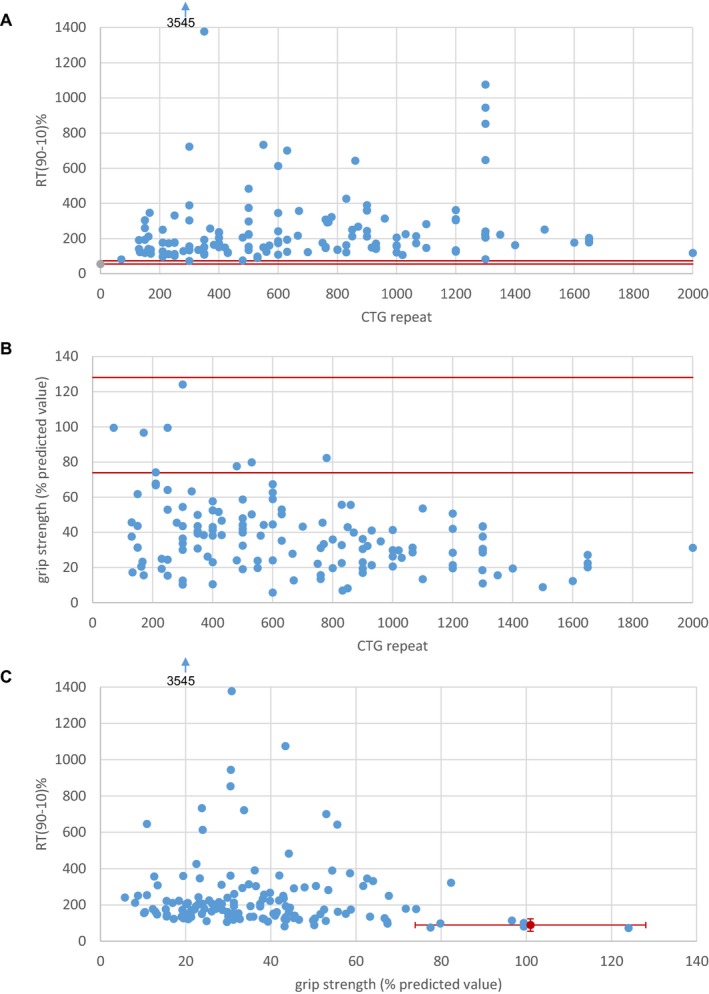
Relationships between: (A) CTG repeat length and grip strength expressed in percentage of predicted values; (B) CTG repeat length and myotonia; (C) grip strength and myotonia. For clarity, a subject with relaxation time (90–10)% of 3545 msec is out of the graphs. Red lines depict the limits of normal values.
Discussion
The scientific question initially raised was addressed in a large population of DM1 patients, the largest so far including myotonia quantification. Both muscle weakness and myotonia were statistically correlated with leukocyte CTG repeat length. It has been widely accepted that CTG repeat length could determine the severity of the disease (reflected by age at onset). However, some studies suggested to limiting this assertion only in patients with less than 1200 CTG repeat.12 Even if statistical significance was reached for CTG, strength and myotonia relationships, our results have also to be pondered by clinical considerations. Also, statistical analyses performed on the various patient populations of individual studies lead to opposite conclusions. What holds for large numbers of patients does not hold true for smaller populations or individuals, meaning that CTG repeat length cannot predict strength or myotonia. As an example, a patient with 30% of remaining grip strength can have a CTG repeat length of 300, 800 as well as 1700. Limitations to the interpretation of these relationships are numerous. First, the measure of CTG repeat length is generally performed once, while the disease is progressive and the CTG expansion may change. Second, CTG repeat length is measured in leukocytes, which could yield a different estimate than in muscle. Third, the disease has a very large heterogeneity in terms of age of onset, clinical manifestations and development. Fourth, the correlations between CTG repeat length, strength and myotonia remained weak indicating that correlations are virtually absent. This is why we support the idea that even if statistically correlated, CTG repeat length is not predictive of the disease severity at an individual level.
Our results also suggest a more severe phenotype for men than for women, which is consistent with a recent study.13 This had also been observed in other neuromuscular disorders, e.g. LGMD2A.14 Even if a hormonal influence has been suggested to explain a gender effect, the reasons for this phenotype difference remain unclear.
Among the 144 DM1 patients, six patients (4.2%) could be considered as asymptomatic considering their muscle strength and myotonia. It has been recently suggested that interruption in the CTG expansion could lead to milder form of the disease,15 which is the case in almost 5% of the total DM1 population16 consistently of what is deduced from our results. The identification of such interruptions in the CTG repeat sequence was unfortunately not available for the patients in our study. Thus, this hypothesis cannot be ascertain.
The relaxation times described here are much lower than what has been described in previous publications.6, 7 This difference may be due to several factors. First, the protocol used in the present study used a submaximal level of strength (70%) for myotonia assessment. It is our experience that patients cannot concentrate on a double task including both the highest strength generation and the fastest release as possible. This was one of the reasons leading to dissociate maximal strength assessment and myotonia assessment. We have already shown that myotonia estimate was significantly lower during a submaximal task compared to a maximal one.9 Second, we used the relaxation time between 90 and 10% of relaxation, not between 90 and 5%. This choice was made because the lower part of the force curve may present fluctuations that may render difficult to detect the time at the 5% relaxation level. Third, modeling may smooth the lower part of the force curve of some patients, which can be seen as a bias. However what is important to obtain is a robust estimate of the slope of force decrease, which is achieved using modeling. Finally, our population of DM1 may have presented with milder myotonia compared to other studies.
The results presented here do not rule out stronger possible relationships between CTG expansion measured in other tissues (muscle, fibroblast, or lymphocyte) and muscle weakness and/or myotonia. The different tissues present a somatic heterogeneity of the CTG repeat, which may lead to large difference in the estimation of CTG repeat length.
This study appraised that the sole CTG repeat length value measured in leukocytes cannot predict at an individual level muscle weakness and myotonia, which are two main primary neuromuscular symptoms in DM1 patients, even if statistical relationships are demonstrated.
Author Contributions
Conception and design of the study: JYH, LJH, BE, JP, GB; Acquisition and analysis of data: JYH, GO, IL, LJH; Clinical follow‐up of the patients: BE, JP, GB; Drafting the manuscript: JYH; Revising and approving the manuscript: all authors.
Conflicts of Interest
Nothing to report.
Acknowledgments
The authors would like to thank Thi Ngoc Linh Tran who did a great job in developing the fully automated myotonia analysis software (MyoTonIM). Joanne Saulnier and Frédéric Proteau are acknowledged for their contribution in collecting part of the data presented in this article. This work was supported by the Association Française contre les Myopathies (AFM).
References
- 1. Logigian EL, Blood CL, Dilek N, et al. Quantitative analysis of the “warm‐up” phenomenon in myotonic dystrophy type 1. Muscle Nerve 2005;32:35–42. [DOI] [PubMed] [Google Scholar]
- 2. Nitz J, Burns Y, Wuthapanich N, Jackson R. A study of repeated lateral pinch grip in myotonic dystrophy. Physiother Res Int 1999;4:1–11. [DOI] [PubMed] [Google Scholar]
- 3. Sansone V, Marinou K, Salvucci J, Meola G. Quantitative myotonia assessment: an experimental protocol. Neurol Sci 2000;21(5 Suppl):S971–S974. [DOI] [PubMed] [Google Scholar]
- 4. Torres C, Moxley RT, Griggs RC. Quantitative testing of handgrip strength, myotonia, and fatigue in myotonic dystrophy. J Neurol Sci 1983;60:157–168. [DOI] [PubMed] [Google Scholar]
- 5. Logigian EL, Moxley RTT, Blood CL, et al. Leukocyte CTG repeat length correlates with severity of myotonia in myotonic dystrophy type 1. Neurology 2004;62:1081–1089. [DOI] [PubMed] [Google Scholar]
- 6. Moxley RT III, Logigian EL, Martens WB, et al. Computerized hand grip myometry reliably measures myotonia and muscle strength in myotonic dystrophy (DM1). Muscle Nerve 2007;36:320–328. [DOI] [PubMed] [Google Scholar]
- 7. Andersen G, Orngreen MC, Preisler N, et al. Muscle phenotype in patients with myotonic dystrophy type 1. Muscle Nerve 2013;47:409–415. [DOI] [PubMed] [Google Scholar]
- 8. Tohgi H, Utsugisawa K, Kawamorita A, et al. Effects of CTG trinucleotide repeat expansion in leukocytes on quantitative muscle histopathology in myotonic dystrophy. Muscle Nerve 1997;20:232–234. [DOI] [PubMed] [Google Scholar]
- 9. Hogrel JY. Quantitative myotonia assessment using force relaxation curve modelling. Physiol Meas 2009;30:719–727. [DOI] [PubMed] [Google Scholar]
- 10. Ebert D, Jaspert A, Murata H, Kaschka WP. Initial lithium augmentation improves the antidepressant effects of standard TCA treatment in non‐resistant depressed patients. Psychopharmacology 1995;118:223–225. [DOI] [PubMed] [Google Scholar]
- 11. Hogrel J‐Y. Grip strength measured by high precision dynamometry in healthy subjects from 5 to 80 years. BMC Musculoskelet Disord 2015;16:139. [DOI] [PMC free article] [PubMed] [Google Scholar]
- 12. Hamshere MG, Harley H, Harper P, et al. Myotonic dystrophy: the correlation of (CTG) repeat length in leucocytes with age at onset is significant only for patients with small expansions. J Med Genet 1999;36:59–61. [PMC free article] [PubMed] [Google Scholar]
- 13. Dogan C, De Antonio M, Hamroun D, et al. Gender as a modifying factor influencing myotonic dystrophy type 1 phenotype severity and mortality: a nationwide multiple databases cross‐sectional observational study. PLoS ONE 2016;11:e0148264. [DOI] [PMC free article] [PubMed] [Google Scholar]
- 14. Richard I, Hogrel J‐Y, Stockholm D, et al. Natural history of LGMD2A for delineating outcome measures in clinical trials. Ann Clin Transl Neurol 2016;3:248–265. [DOI] [PMC free article] [PubMed] [Google Scholar]
- 15. Braida C, Stefanatos RKA, Adam B, et al. Variant CCG and GGC repeats within the CTG expansion dramatically modify mutational dynamics and likely contribute toward unusual symptoms in some myotonic dystrophy type 1 patients. Hum Mol Genet 2010;19:1399–1412. [DOI] [PubMed] [Google Scholar]
- 16. Musova Z, Mazanec R, Krepelova A, et al. Highly unstable sequence interruptions of the CTG repeat in the myotonic dystrophy gene. Am J Med Genet A 2009;149A:1365–1374. [DOI] [PubMed] [Google Scholar]