

Abstract
In wild primates, social behaviour influences exposure to environmentally acquired and directly transmitted microorganisms. Prior studies indicate that gut microbiota reflect pairwise social interactions among chimpanzee and baboon hosts. Here, we demonstrate that higher-order social network structure—beyond just pairwise interactions—drives gut bacterial composition in wild lemurs, which live in smaller and more cohesive groups than previously studied anthropoid species. Using 16S rRNA gene sequencing and social network analysis of grooming contacts, we estimate the relative impacts of hierarchical (i.e. multilevel) social structure, individual demographic traits, diet, scent-marking, and habitat overlap on bacteria acquisition in a wild population of Verreaux's sifaka (Propithecus verreauxi) consisting of seven social groups. We show that social group membership is clearly reflected in the microbiomes of individual sifaka, and that social groups with denser grooming networks have more homogeneous gut microbial compositions. Within social groups, adults, more gregarious individuals, and individuals that scent-mark frequently harbour the greatest microbial diversity. Thus, the community structure of wild lemurs governs symbiotic relationships by constraining transmission between hosts and partitioning environmental exposure to microorganisms. This social cultivation of mutualistic gut flora may be an evolutionary benefit of tight-knit group living.
Keywords: primate, social network, grooming, gut microbiome, microbial ecology, lemur
1. Introduction
Mammalian gastrointestinal tracts harbour complex microbial communities that are critical to host development, metabolism, immune function and protection from pathogens [1–4]. Discovery of these essential physiological functions has shifted the traditional pathogen-dominated view of host–bacterial interactions [5] and spurred researchers to characterize the composition and function of host-associated microbial communities. Gut microbiome composition and the coevolution of gut microbiota and their hosts are likely influenced by a combination of heritable factors (e.g. host genetics and vertical transmission), environmental factors (e.g. geographic location and diet) and behavioural factors (e.g. social networks arising from daily contacts and proximity among individuals) [6–8]. However, we do not yet know the relative importance and interactions of vertical, horizontal and environmental transmission.
Primates exhibit diverse patterns of social organization, ranging from entirely solitary to dispersed to gregarious [9]. These social groupings mediate exposure to environmentally acquired and directly transmitted commensal microorganisms and may thus impact host health [10–14]. For example, the social transmission of gut bacteria has been linked to disease risk in mice [15] and protection against parasites in social bumblebees [2]. Although social networks demonstrably influence parasite transmission and infectious disease outbreaks in wildlife populations (e.g. [16–19]), we know little about their impact on the mammalian gut microbiome or the downstream consequences for host physiology and health. There may be informative parallels between pathogen transmission and gut colonization. For example, certain individuals may be highly connected super-spreaders [20] that disproportionately disseminate gut bacteria, or highly mobile super-movers [21] that connect otherwise disjointed parts of the population. Among wild mammals, several studies have demonstrated concordance between social or spatial networks and bacteria strain sharing [22–24]. In particular, the gut microbiota of chimpanzees and baboons reflect pairwise social interactions [25,26]. However, the applicability of these results is limited by the extensive effort required to estimate pairwise affiliations in wildlife. Higher levels of social organization, such as social groups, may be both easier to ascertain and have a more pronounced impact on microbiome composition, depending on the social structure of the host species.
In this study, we characterize the social networks of wild Verreaux's sifaka (Propithecus verreauxi), an arboreal, diurnal lemur that inhabits the dry forests of western Madagascar, and explore the impacts of these networks on gut microbiome similarity and within-host diversity. Sifaka are morphological folivores with dentition and gastrointestinal tracts that are anatomically specialized for consuming and processing fibrous leaf material [27,28] and for detoxifying secondary plant compounds [28]. Their sacculated caecum contains mutualistic bacteria that use fermentation to break down otherwise indigestible plant polysaccharides into digestible volatile fatty acids [29]. Sifaka live in small, cohesive, mixed-sex social groups [30] with small, overlapping home ranges [31]. Females tend to be philopatric [32], whereas males disperse from their natal group upon reaching sexual maturity [33]. Sifaka regularly groom one another with their toothcombs and tongues to remove ectoparasites [34]. Grooming relationships vary by sex, dominance rank and reproductive season and primarily occur within social groups [34]. Intimate grooming contacts, particularly near the anogenital region (electronic supplementary material, video S1), likely facilitate the direct oral exchange of gut bacteria within groups [25]. Sifaka also communicate via scent-marking, in which they rub their throat (males only) or anogenital region (both sexes) on trees [31,35]. Males commonly overmark and inspect the scent-marks of both group and extra-group members [31], thus scent-marking locations potentially serve as fomites for enteric bacterial transmission, as proposed by [23] and [24]. Because sifaka groups tend to have a high degree of home range overlap, scent-marking is not necessarily effective for deterring extra-group individuals from entering a home range [35]. Sifaka may also acquire gut microorganisms environmentally, either from their diet or when licking water from a substrate. A previous study in Verreaux's sifaka examined correlations among group membership, habitat overlap, and Escherichia coli subtype (ST) sharing [24], but did not address the influence of physical contacts on gut microbiota.
We present a multi-dimensional analysis of social network structure and gut microbiota variation in a sifaka study population. Specifically, we relate hierarchical characteristics—including group membership, pairwise associations and individual-level connectivity, demography and genotype—to microbial community structure within and across seven sifaka social groups. Although there is already strong correlative evidence that gut microbiota are socially transmitted in chimpanzees and baboons [6,25,26], sifaka are socially distinct from anthropoid primates in several respects: they live in much smaller, more cohesive social groups with overlapping home ranges, use scent-marking for within- and between-group communication, and groom orally rather than digitally. By contrast, chimpanzees and baboons live in large groups of up to a few hundred individuals. We hypothesized that the small, cohesive sifaka social groupings should lead to more pronounced modularity among their gut microbial communities—greater homogeneity within groups and distance between groups—than previously observed in chimpanzees and baboons [25,26]. We expected such microbial mirroring of social group membership to arise from common diet [6,36], horizontal transmission of gut bacteria via direct grooming contacts [25] or sequential scent-marking [37] and common environmental exposure among group members [26]. Further, assuming that gut bacteria are transmitted between groups primarily via scent-marking during intergroup encounters and habitat overlap, we hypothesized that sifaka groups with overlapping home ranges should cluster more closely in microbial composition than non-adjacent groups. Finally, because grooming and scent-marking likely contribute to the social exchange of gut bacteria, we predicted that individual sifaka that groom or scent-mark more frequently would have more diverse gut microbiomes. Given that sifaka are folivorous, strepsirrhine primates with markedly different ecology, social dynamics, means of communication and phylogenetic history than other primate species already in the microbiome literature, our study provides valuable comparative insights into the socioecological influences on host-associated microbial communities.
2. Material and methods
(a). Study site and study subjects
Sifaka behavioural data, genetic samples and faecal samples were collected at Ankoatsifaka Research Station (20°47.69′ S, 44°9.88′ E) in Kirindy Mitea National Park in western Madagascar (electronic supplementary material, figure S1). In this study, we focus on 47 individuals from six habituated social groups in the Ankoatsifaka trail system (Group I, Nindividuals = 4; II, N = 6; III, N = 9; IV, N = 8; V, N = 5; VI, N = 9) and from one partially habituated group in the research site camp area (Group Camp, N = 6). Since 2007, Groups II, III, IV and V have been the focus of long-term research, whereas genetic and demographic data for groups inhabiting the periphery of the field site (I, VI) have been collected opportunistically. Of the 47 individuals included in this study, demographic and genetic data were available for 35 individuals in Groups I–VI, social behaviour data for 22 individuals in Groups II–V, feeding behaviour data for 16 individuals in Groups II–V and scent-marking data for 19 individuals in Groups II–V (electronic supplementary material, table S1). We categorized sifaka based on their age, sex and dominance rank (electronic supplementary material, table S1), and, for pairwise analyses, scored whether two individuals were related to each other based on genetic data. Additional information concerning individual categorization is included in the electronic supplementary material.
(b). Faecal sample collection, sample processing and sequencing
Faecal samples were collected immediately after defaecation during a one-month span in the dry season (20 June 2012–28 July 2012), when the sifaka diet consists primarily of mature leaves. Figure 1c shows a map of sampling locations. Samples from two individuals in Groups I and III (I-M1 and III-M1) were collected during the Sifaka Research Project's annual capture in June 2012. Capture methods are described in detail elsewhere [38]. Faecal samples were preserved in RNAlater® at ambient temperature until their arrival in Austin, Texas, in August 2012 and frozen at −80°C until DNA extraction. DNA was extracted from faecal pellets using the bead-beating procedure described in Goodman et al. [39]. The V4 region of the bacterial 16S ribosomal RNA gene was PCR amplified in triplicate using primers 515F and 806R, as described in Caporaso et al. [40]. The resulting amplicons were pooled and paired-end sequenced using the Illumina MiSeq platform at Argonne National Laboratory (Lemont, IL, USA).
Figure 1.

Social groups harbour distinct gut microbiota despite close proximity. (a) Relative abundances of the nine most abundant gut bacterial phyla in 47 Verreaux's sifaka from seven social groups (I–VI: research site trail system; ‘camp': research station camp area). The ‘other' category represents low abundance (less than 2%) phyla. (b) Principal coordinates plot of Bray–Curtis dissimilarities showing ecological distances among 47 sifaka samples. Social group membership explains a significant proportion of variation in gut microbial composition, and groups do not cluster according to habitat overlap. (c) Faecal sample collection sites at Ankoatsifaka Research Station in Kirindy Mitea National Park, Madagascar. Sample collection sites represent group home ranges throughout the behavioural data collection period (electronic supplementary material, figure S16).
(c). Sequence quality control and taxonomy
Raw Illumina sequence reads were de-multiplexed and quality filtered using QIIME [41] with join_paired_ends.py and split_libraries_fastq.py and default settings. High-quality reads were assigned to 97% operational taxonomic units (OTUs) (i.e. phylotypes) and taxonomic classifications with the RDP classifier (pick_open_reference_otus.py) based on their best match in the Greengenes database. After initial quality filtering, singletons (OTUs detected once in the entire dataset) and chloroplast and eukaryotic mitochondria OTUs were removed to generate a usable table of bacterial taxa. The resultant set of OTUs contained a total of 33 433 unique OTUs ( phylotypes per sample). This high level of phylotype diversity likely stems from our open-reference OTU picking method, which incorporated novel OTU diversity by clustering all sequence reads.
(d). Sample clustering using Bray–Curtis and weighted Unifrac metrics
We assessed similarity in gut microbial communities using only OTUs that were detected in at least two samples, totalling 9050 unique phylotypes. To account for differences in sequencing depth among samples and heteroscedasticity in OTU counts, we estimated sample-specific normalization factors [42] and then rescaled OTU counts. After normalization, samples contained  unique OTUs. We quantified among-individual variation in gut microbial community composition by calculating Bray–Curtis dissimilarities and weighted Unifrac distances between samples. Bray–Curtis dissimilarities consider the presence/absence of bacterial OTUs, whereas weighted Unifrac distances incorporate OTU abundances and the phylogenetic relationships among OTUs.
Additional details about microbiome analyses, genetic sample collection, genotyping, behavioural data collection, dietary analysis, social network analysis and statistical analyses, as well as associated references, are provided in the electronic supplementary material.
3. Results
We characterized the gut microbiota of 47 sifaka (electronic supplementary material, table S1) by Illumina sequencing the V4 region of the bacterial 16S rRNA gene, resulting in an average sequencing depth of 79 263 reads and 3590 unique 97% OTUs (i.e. bacterial phylotypes) per sample. As described previously for wild sifaka [43], most classifiable bacteria were assigned to Firmicutes (mean ± s.d. = 52.8% ± 21.1%), Bacteroidetes (12.1% ± 7.5%) and Proteobacteria (7.4% ± 6.0%), which together constituted 53.6–94.1% of the sequence reads identified in each sample (figure 1a). Actinobacteria, Cyanobacteria, Fibrobacteres, Synergistetes, Tenericutes and Verrucomicrobia were also prevalent, but at substantially lower frequencies (less than 2%) than the three dominant phyla (figure 1a). A high proportion of sequence reads could not be classified at any hierarchical taxonomic level (22.6% ± 10.5% reads per sample), and the majority of phylum-resolved taxa (73.6%) lacked genus-level resolution. Thus, sifaka gut microbial communities are composed of mostly novel bacterial taxa that have yet to be characterized, perhaps stemming from the greater phylogenetic distance between humans and lemurs compared to the distance between humans and other anthropoid primates [44]. The two most abundant microbial families, Lachnospiraceae and Ruminococcaceae (Clostridiales: Firmicutes; electronic supplementary material, figure S2), have been associated with maintenance of gut health in humans and are uniquely suited to degrade a wide variety of recalcitrant substrates [45]. Their dominance in sifaka gut microbiomes is consistent with gut microbial profiles observed in other folivorous primate taxa [46,47].
(a). Gut microbial composition across social groups
Sifaka social groups differed significantly in gut biodiversity (electronic supplementary material, figure S3). We calculated Bray–Curtis dissimilarities and weighted Unifrac distances between samples to evaluate beta diversity in gut microbial community composition. Principal coordinates analysis and partitioning around medoids (PAM) clustering of phylotype-level Bray–Curtis dissimilarities and weighted Unifrac distances indicated that sifaka microbiomes formed two discrete clusters (figure 1b; electronic supplementary material, figure S4), with members of two social groups, VI and Camp, segregated from the other groups. Secondarily, Groups IV and V clustered separately from Groups I, II and III. Six males dispersed to new social groups during the eight to 12 months prior to faecal sample collection and exhibited microbiome signatures of their new groups (i.e. within social groups, the gut microbiota of recent immigrants were not significantly different from those of resident individuals, Wilcoxon, p = 0.51; figure 1b; electronic supplementary material, figures S5 and S6). Interestingly, one of these dispersed males (II-M1) frequently transferred between Groups I and II during the five months prior to sample collection and harboured a microbial signature that was intermediate between those of Groups I and II. The microbial phyla, families and genera associated with each microbial cluster are detailed in the electronic supplementary material (electronic supplementary material, table S2). Although we did not have data to show the presence of specific pathogens in our samples, several bacteria genera that include opportunistic pathogens, such as Atopobium, Clostridium, Escherichia and Streptococcus, were differentially abundant across social groups (electronic supplementary material, table S2 and figure S7).
(b). Neither dietary nor habitat overlap explain clustering
Some previous studies have attributed positive associations between social proximity and gut microbiome composition to shared diets [6,36]. We profiled the feeding behaviour of 16 adults in four of the focal groups (II, III, IV, V) during the six months prior to faecal sample collection (January–June 2012). Sifaka consumed primarily mature leaves (mean ± s.d. = 26.9% ± 17.4% foraging time), young leaves (28.3 ± 13.8%) and fruit (23.9 ± 13.4%) with a smaller proportion of time devoted to foraging on seeds, flowers and bark (electronic supplementary material, figure S8). Among social groups, only Groups II and IV had significantly different diets, with Group IV primarily consuming fruit and Group II primarily foraging on seeds (Kruskal–Wallis, p = 0.04 and 0.01, respectively; electronic supplementary material, figure S9). When we looked more closely at plant species consumed, we found some significant differences between groups (electronic supplementary material, figure S10). However, these differences do not align with the clustering in microbial composition. To assess inter-individual variation in diet, we computed pairwise Bray–Curtis dietary distances based on the relative proportions of plant parts or plant species consumed. We found that dietary profiles did not predict microbial similarity between individuals (plant parts: Mantel, r = 0.01, p = 0.44; plant species, r = 0.1, p = 0.09; electronic supplementary material, figure S11).
Although adjacent social groups shared more bacterial phylotypes than non-adjacent groups (Kruskal–Wallis, p < 0.05; electronic supplementary material, figure S12), the microbial clustering of groups did not correspond to habitat overlap or ad libitum observations of scent-marking during intergroup encounters. For example, Group VI's home range intersected with those of Groups II and III but its gut microbiota were most similar to those of Group Camp, which inhabited a section of forest approximately 1 km away from the trail system (figure 1c). Given that sifaka groups in Kirindy Mitea National Park have home ranges of approximately 0.15 km2 (range: 0.1–0.19 km2) [48], it is unlikely that the microbial clustering among members of Group VI and Group Camp arose due to shared habitat, physical interactions or scent-marking during intergroup encounters.
(c). Predictors of gut microbiome composition
Across all individuals, social group membership explained 57.6% of observed variation in gut microbial communities (PERMANOVA, Bray–Curtis metric: p < 0.001; figure 1b), whereas age (R2 = 0.06, p = 0.38) and sex (R2 = 0.01, p = 0.99) were not significant predictors of community composition. Furthermore, sex/dominance rank did not significantly influence variation in composition among adults in multi-male/multi-female groups (R2 = 0.21, p = 0.79). Rather than adopting observer-designated social groupings, we used a community detection algorithm to quantify network modularity and partition the focal population into groups based on dyadic grooming relationships. Four distinct social clusters emerged with strong statistical support (modularity, Q = 0.73), which perfectly matched the original observer-designated groupings. For each social group, we measured the proportion of existing dyadic grooming relationships relative to the total number possible within that group, and found a high median edge density of 0.67 (range: 0.46–1.0). By contrast, the overall edge density when aggregating all four groups into a single network was only 0.15. Social groups with higher edge densities (i.e. greater social connectedness) exhibited more homogeneous microbial compositions than social groups with lower edge densities (Pearson's r = −0.99, p = 0.01, electronic supplementary material, figure S13).
Group membership remained a significant predictor of gut microbiome composition after controlling for estimated genetic relatedness (‘related' versus ‘not related’) between individuals (partial Mantel, r = 0.31, p < 0.001), whereas genetic relatedness did not significantly correlate with similarity in microbial communities after controlling for group membership (partial Mantel, r = 0.07, p = 0.07; figure 2a). Within social groups, individuals belonging to the same maternal line did not, on average, share more bacterial phylotypes compared to related individuals belonging to different maternal lines or unrelated group members (Kruskal–Wallis, p = 0.63; electronic supplementary material, figure S14), suggesting that vertical transmission is not driving the compositional homogeneity observed among group members. Nonetheless, pedigree relationships predicted microbiome dissimilarity for dyads belonging to different groups (i.e. half-siblings, recently dispersed males and their relatives; figure 2a), thus indicating sifaka retain a signature of their inherited microbiota or that relatives in different groups groomed each other more frequently (or recently) than unrelated individuals in different groups.
Figure 2.
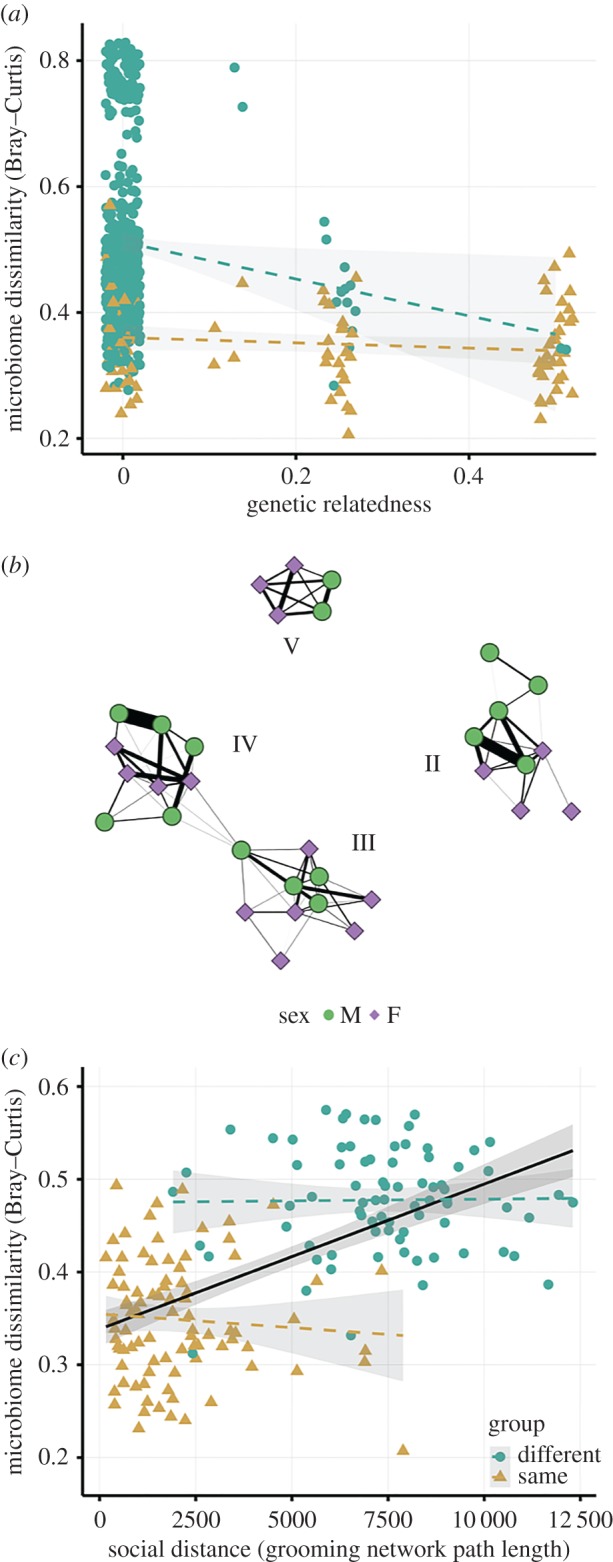
Gut microbiomes reflect social group membership and grooming duration. (a) Genetic relatedness predicts Bray–Curtis dissimilarity in gut microbiome composition for pairs of sifaka belonging to different social groups (circles) but not for pairs belonging to the same social group (triangles). Although related individuals in different groups share microbiota, kinship is not driving the compositional homogeneity observed among group members. (b) Social network based on grooming interactions in the year prior to and including microbiome sampling among four sifaka social groups (II, III, IV, V) inhabiting Kirindy Mitea National Park. Nodes (N = 33) represent individuals. Lines represent grooming interactions between individuals, and thicker lines reflect stronger grooming relationships. (c) Social distance in the grooming network predicts Bray–Curtis dissimilarity on a global (network) level (black line) but not for pairs belonging to the same or different social groups (triangles and circles, respectively). Thus, patterns of microbial similarity reflect social divisions among sifaka groups. (Online version in colour.)
We developed a predictive model of pairwise gut microbial similarity using four of the seven social groups (II, III, IV, V), for which we had extensive dyadic contact data. When considering the grooming network of all four groups (i.e. within- and between-group pairwise social distances; figure 2b), group membership was the strongest predictor of similarity in gut microbial composition between individuals (figure 2c and table 1; electronic supplementary material, table S3), while genetic relatedness was not informative. When we removed group membership as a predictor, we found that the shortest network path length between pairs of individuals (i.e. the proximity and strength of the dyadic grooming relationship) predicted gut microbial similarity (figure 2c and table 1). However, grooming path length was not a significant predictor in the full model that included the group membership predictor (ΔDIC < 5). Importantly, when we examined the within- and between-group networks separately, grooming path length no longer predicted similarity in gut microbiome composition (figure 2c), despite groups with higher edge densities displaying more homogeneous microbiome compositions. We thus conclude that the population-wide correlation between social contacts and microbiome composition stems primarily from group membership, as sifaka groups are highly cohesive, with most sifaka rarely grooming individuals outside their social group.
Table 1.
Pairwise social and genetic predictors of Bray–Curtis dissimilarity among Verreaux's sifaka inhabiting Kirindy Mitea National Park. Posterior mean, 95% credible interval (95% CIs), and p-value based on Markov chain Monte Carlo sampling for fixed-effect parameters. Baseline relatedness (not related) is not shown. Individual identity within each pair was included as a random effect. Bolded relationships are significant at p < 0.05.
| model | parameter | mean | 95% CI | p | interpretation |
|---|---|---|---|---|---|
| group membership Npairs = 167 DIC: −486.4 |
intercept | 0.47 | (0.44, 0.5) | <5×10⁻⁵ | |
| the same group | −0.11 | (−0.14, −0.09) | <5×10⁻⁵ | pairs in the same social group have less dissimilar microbiota | |
| related | 0.01 | (−0.02, 0.04) | 0.57 | no significant correlation | |
| social distance Npairs = 167 DIC: −440.67 |
intercept | 0.34 | (0.3, 0.38) | <5×10⁻⁵ | |
| network path length | 1.7×10⁻⁵ | (1.23×10⁻⁵, 2.19×10⁻⁵) | <5×10⁻⁵ | pairs that are farther apart in the social network have more dissimilar microbiota | |
| related | −9.22×10⁻³ | (−0.04, 0.02) | 0.54 | no significant correlation |
On an individual level, we assessed whether gut microbiome diversity correlated with an animal's age, scent-marking rate, dietary diversity and degree of sociability, as measured by its weighted degree centrality in the grooming network. After controlling for social group affiliation, individuals that more frequently received or initiated grooming had more diverse microbiomes (figure 3 and table 2; electronic supplementary material, table S4), even when limiting the analysis to only adult individuals (p = 0.003). Microbial diversity increased with age, with juvenile and subadult sifaka exhibiting significantly lower richness compared to adults (figure 3 and table 2). Dietary diversity (Shannon's evenness index for the proportion of food items consumed) correlated with increased phylotype richness (plant species: p = 0.003; plant parts, p = 3.84 × 10⁻⁷; table 2), as also reported in chimpanzees and red-shanked doucs [26,49]. Lastly, individuals with higher scent-marking rates, such as stained males, tended to have more diverse microbiomes (table 2; electronic supplementary material, figure S15).
Figure 3.
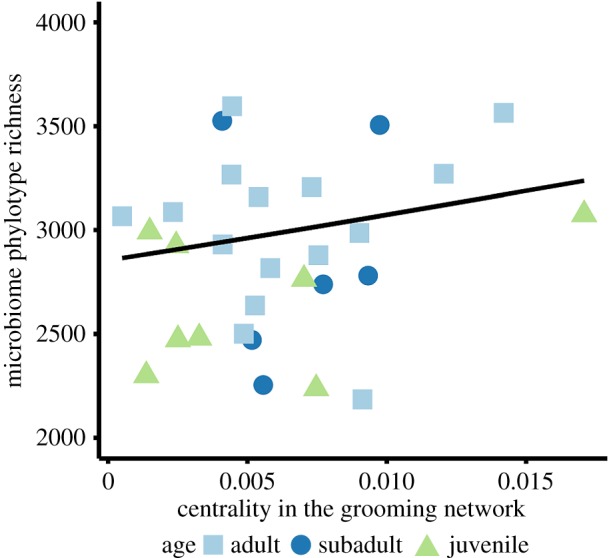
Centrality in the grooming social network and age influence individual gut bacterial diversity. For 29 Verreaux's sifaka in Kirindy Mitea National Park, we estimated individual centrality by summing the duration of initiated and received grooming contacts. We calculated within-host phylotype richness using 100 rarefied OTU tables. Adults and individuals that frequently initiated and/or received grooming had more diverse gut microbial communities. (Online version in colour.)
Table 2.
Predictors of within-host gut microbiome richness for Verreaux's sifaka inhabiting Kirindy Mitea National Park. Average coefficient estimates, standard errors, z values, and Pr(>|z|) values are shown for fixed-effect parameters. Baseline age (adult) is not shown. Group membership was included as a random effect in all models. Bolded relationships are significant at p < 0.05.
| model | parameter | estimate | s.e. | z-value | Pr(>|z|) | interpretation |
|---|---|---|---|---|---|---|
| sociability/age Nsifaka = 27 |
intercept | 8.0 | 0.01 | 638.1 | <2×10⁻¹⁶ | |
| weighted degree centrality | 7.65 | 1.04 | 7.4 | 1.92×10⁻¹³ | more central individuals have greater microbial diversity | |
| age (juvenile) | −0.11 | 0.01 | −12.9 | <2×10⁻¹⁶ | juveniles have lower microbial diversity than adults | |
| age (subadult) | −0.04 | 0.01 | −3.8 | 0.0001 | subadults have lower microbial diversity than adults | |
| scent-marking Nsifaka = 19 |
intercept | 7.94 | 0.01 | 558.9 | <2×10⁻¹⁶ | |
| scent-marking rate | 0.05 | 0.005 | 9.8 | <2×10⁻¹⁶ | individuals that scent-mark more frequently have greater microbial diversity | |
| diet composition Nsifaka = 16 |
intercept | 7.46 | 0.07 | 108.3 | <2×10⁻¹⁶ | |
| plant part evenness | 0.21 | 0.04 | 5.1 | 3.84×10⁻⁷ | individuals that eat a greater variety of plant parts have greater microbial diversity | |
| plant species evenness | 0.09 | 0.03 | 3.0 | 0.003 | individuals that eat a greater variety of plant species have greater microbial diversity |
(d). Evidence for direct between-host transmission
Microbiome similarity within groups may stem from direct transmission (perhaps via grooming), sequential scent-marking, common environmental exposure and/or similar dietary intake among group members. To distinguish between habitat use and physical contact, we controlled for common exposure by constructing social networks based on the duration with which individuals were observed to be in close proximity (within 1 m) during the six months and 12 months prior to faecal sample collection. We examined six-month and 12-month time periods because microbiome signatures of dispersed males suggest that gut microbial turnover occurs within six to 12 months after transferring groups. When controlling for six-month (but not 12-month) proximity, grooming network path length remained a strong and significant predictor of similarity in microbiome composition between individuals (partial Mantel, r = 0.11, p = 0.003), thus implicating grooming contacts in the social transmission of gut microorganisms over shorter timescales. Over longer periods of time, common environmental exposure arising from close proximity may be more important in shaping compositional homogeneity among group members. To distinguish between diet and physical contact, we constructed a grooming network among the 16 individuals for which foraging data were available. We then computed two sets of Bray–Curtis dietary distances based on the proportion of time these individuals were observed consuming plant species and plant parts. When controlling for dietary similarity, grooming path length remained a significant predictor of microbiome composition (plant species: partial Mantel, r = 0.42, p < 0.001; plant parts: r = 0.43, p < 0.001), despite close grooming partners tending to forage on similar plant species (Mantel, r = 0.13, p = 0.03).
4. Discussion
Hierarchical social organization is an important determinant of gut microbiome composition in wild Verreaux's sifaka. The study population exhibited modular community structure, identified both by field observers and through social network partitioning of dyadic contact data, consisting of small sub-networks (i.e. social groups) that were highly intraconnected and only loosely interconnected. Even after controlling for diet, kinship and habitat overlap, group membership was the single most informative predictor of gut microbiome diversity and similarity between individuals, revealing the importance of social network structures beyond the dyadic associations reported by prior studies [25,26]. Theoretical studies have shown that modular network structure constrains the spread of socially transmitted microorganisms [50,51], but few empirical studies demonstrate such effects in wild animal populations [52–54]. Within sifaka social groups, we found that individual sociability, age, diet composition and scent-marking rate also influenced gut microbiome diversity.
Microbiomes from the seven social groups aggregated into two clusters, each with distinct taxonomic structure, species diversity and abundances of particular bacterial phylotypes. Given that we observed minimal physical contact between groups during behavioural observations, we hypothesized that this clustering pattern may stem from habitat overlap, shared diet and/or scent-marking during intergroup encounters. However, using available proximity, foraging, and scent-marking data, we failed to find support for any of these mechanisms. Microbiomes did not cluster according to either geographic proximity (which is analogous to findings for ring-tailed lemurs [55]) or similarity in diet (i.e. plant parts or plant species consumed). Although sifaka scent-mark during intergroup encounters, the infrequency of these events was likely not sufficient to promote significant microbial transfer between adjacent social groups. A study examining E. coli ST sharing among Verreaux's sifaka groups from an entirely different study population in Kirindy Forest similarly found that dyads belonging to the same social group were more likely to share the same or closely related STs than dyads belonging to different groups with home range overlap [24]. When we examined inter-individual variation in foraging behaviour, dietary similarity failed to predict microbiome composition. However, we note that we did not have feeding data for Groups VI and Camp, two non-adjacent groups that clustered separately from the other five groups, and thus cannot fully exclude the influence of diet on sifaka gut microbiota.
Group-level clustering of sifaka gut microbiomes may stem from vertical transmission between mothers and offspring, direct transmission among individuals that are in close contact [25,26], or environmental overlap and dietary similarity among group members. Although relatedness predicted microbiome similarity for some sifaka in different groups (e.g. half-siblings, recently, dispersed males and their relatives), our within-group analyses suggest that neither vertical inheritance nor genetic relatedness can explain compositional homogeneity within groups, because related individuals did not have more similar gut microbiota than non-related individuals. Consistent with past studies of humans and other non-human primates [6,25,26,56], we found that group membership and physical contacts (as measured by grooming duration between dyads) predicted pairwise gut microbiome similarity on a global (network) level. Male sifaka that immigrated to new social groups during the previous year appeared to display the microbiome signatures of their new groups, suggesting rapid phylotype turnover amidst new social contacts, a pattern previously observed in female chimpanzees [6]. However, it is important to note that some of these dispersed males transferred from unsampled social groups that inhabited the periphery of the field site. On a population level, grooming relationships remained a significant predictor of microbiome composition, after controlling for both spatial proximity and dietary similarity. Furthermore, social groups with higher social connectedness (i.e. higher grooming network edge densities) exhibited more homogeneous microbiome compositions. However, contrary to yellow baboons (Papio cynocephalus) [25], gut microbiome similarity between individual sifaka did not reflect grooming relationships within social groups. This discrepancy may stem from substantial differences in group size, grooming relationships and olfactory communication between the two species. Yellow baboons live in social groups that are an order of magnitude larger and much more socially subdivided [57] than sifaka groups, with female baboons primarily grooming other female kin [57], and males grooming much less frequently, especially with members of their own sex [58]. While baboons do not scent-mark at all, male sifaka frequently overmark and inspect the scent-marks of other group members [31], which likely promotes bacterial exchange within social groups.
Age, centrality in the grooming social network, dietary evenness and scent-marking rate were significantly associated with individual microbiome diversity. Alpha diversity and stability in the gut microbiome have been linked to host development, immune function and protection from pathogens [1–4,6,36,59–62]. Although infants are inoculated by their mothers' microbiota through vaginal birth and lactation, they continue to acquire microbes throughout their lives through contact with conspecifics and the environment [63]. Prior studies have also linked age to gut microbiota diversity in baboons, chimpanzees and humans [6,36,64]. Intuitively, behaviours that promote contact with faecal matter—e.g. giving and/or receiving intimate grooming and scent-marking—correlated with greater microbial diversity [20,26,53]. Olfactory communication in lemurs is complex: adult sifaka use scent-marking and overmarking to self-advertise, to mark food resources, to delineate home ranges, to noncombatively fight and/or as a form of mate-guarding, depending on the individual and the context [31,35]. Overmarking and scent-mark inspection may increase individual exposure to enteric bacteria and promote indirect transmission between hosts, as hypothesized by previous studies on bacteria strain sharing [23,24]. Although grooming can facilitate the spread of parasites and pathogens [53,65], it may also improve health by promoting diverse mutualistic gut microbial communities [26], serving a hygienic function [66,67] and mediating the formation and maintenance of bonds between individuals [68,69]. These counterbalancing effects may have non-trivial and environmentally dependent impacts on host fitness and the evolution of primate social structure.
5. Conclusion
The gut microbiomes of wild sifaka reflect their modular social organization, and both grooming and scent-marking behaviours promote microbial exchange and within-host diversity. Like previous studies in anthropoid primates [25,26], we find that group membership and social contacts directly shape microbial variation, even while controlling for the potentially confounding factors of diet, genetic relatedness, vertical inheritance and spatial proximity. However, sifaka exhibit striking between-group differences and increased within-group homogeneity in their gut microbial communities as a result of their unique social dynamics, use of olfactory communication and style of grooming. Given that lemurs are more phylogenetically distant from humans than are anthropoid primates and are an independent radiation, this study provides comparative insights into social constraints on gut microbiota that may ultimately help to elucidate the diversity and evolution of primate sociality [10,11,13]. We speculate that permanent social groups promote the horizontal transmission of beneficial gut microorganisms [25] and the maintenance of diverse microbiomes, thereby reducing the pathogen-related costs of group living [14]. Although few microbiome studies have examined social transmission and pathogen resistance in tandem [2], separate evidence for the social transmission of commensal bacteria [25,26,37,56] and microbiome-mediated pathogen resistance [70–72] suggests a link between these two forces [14].
Supplementary Material
Acknowledgements
We wish to thank the Madagascar government, CAFF/CORE, and Madagascar National Parks for permission to conduct this research, and the University of Antananarivo (including Lydia Rabetafika, Daniel Rakotondravony and Hajanirina Rakotomanana) and MICET for facilitating our research. The Ankoatsifaka Research Station staff worked tirelessly to collect the majority of the demographic, social and feeding data presented here. We would also like to thank Enafa, Alexandre, Fidisoa Rasambainarivo, Edward Louis and the Omaha Zoo and Damien Caillaud for assistance in capturing animals, Elvis Rakatomalala for his help with faecal sample collection, Mireia Taboada for her help with ear tissue DNA extraction and genotyping sifaka, Deborah Bolnick and Carrie Veilleux for their help with the initial ear tissue DNA extractions, Chris Davis for his help creating the sifaka home range map, and two anonymous reviewers for their comments on our manuscript.
Ethics
All data collection procedures in this study complied with protocols approved by The University of Texas at Austin Institutional Animal Care and Use Committee and adhered to the legal requirements of Madagascar and the American Society of Primatologists Principles for the Ethical Treatment of Non-Human Primates. Behavioural data, genetic samples, and faecal samples were collected under permit approval from Madagascar National Parks, the Madagascar Ministry of Environment, Forests and Tourism, and the Madagascar Ministry of Higher Education.
Data accessibility
All data and code have been deposited in the Dryad Digital Repository at https://doi.org/10.5061/dryad.qf731 [73].
Authors' contributions
A.C.P., R.J.L. and L.A.M. designed the research; A.C.P. collected faecal samples, conducted faecal DNA extractions, analysed microbial and behavioural data, and wrote the manuscript with contributions from L.A.M.; R.J.L. collected genetic samples and behavioural and demographic data; L.A.A. and A.D. conducted ear tissue DNA extractions and genotyping analyses. All authors edited drafts of the manuscript and gave final approval for publication.
Competing interests
We declare we have no competing interests.
Funding
This research was financed by the National Institutes of Health/Modeling of Infectious Disease Agent Study, the National Science Foundation, the BEACON Center for the Study of Evolution in Action, the L.S.B. Leakey Foundation, Primate Conservation, Inc., the International Primatological Society, the American Society of Primatologists, The University of Texas at Austin, and multiple private donors.
References
- 1.Round JL, Mazmanian SK. 2009. The gut microbiota shapes intestinal immune responses during health and disease. Nat. Rev. Immunol. 9, 313–323. ( 10.1038/nri2515) [DOI] [PMC free article] [PubMed] [Google Scholar]
- 2.Koch H, Schmid-Hempel P. 2011. Socially transmitted gut microbiota protect bumble bees against an intestinal parasite. Proc. Natl Acad. Sci. USA 108, 19 288–19 292. ( 10.1073/pnas.1110474108) [DOI] [PMC free article] [PubMed] [Google Scholar]
- 3.Turnbaugh PJ, et al. 2009. A core gut microbiome in obese and lean twins. Nature 457, 480–484. ( 10.1038/nature07540) [DOI] [PMC free article] [PubMed] [Google Scholar]
- 4.McFall-Ngai MJ. 2002. Unseen forces: the influence of bacteria on animal development. Dev. Biol. 242, 1–14. ( 10.1006/dbio.2001.0522) [DOI] [PubMed] [Google Scholar]
- 5.The Human Microbiome Project Consortium. 2012. Structure, function and diversity of the healthy human microbiome. Nature 486, 207–214. ( 10.1038/nature11234) [DOI] [PMC free article] [PubMed] [Google Scholar]
- 6.Degnan P, Pusey A, Lonsdorf E, Goodall J, Wroblewski E, Wilson M, Rudicell R, Hahn B, Ochman H. 2012. Factors associated with the diversification of the gut microbial communities within chimpanzees from Gombe National Park. Proc. Natl Acad. Sci. USA 109, 13 034–13 039. ( 10.1073/pnas.1110994109) [DOI] [PMC free article] [PubMed] [Google Scholar]
- 7.Moeller AH, Li Y, Mpoudi Ngole E, Ahuka-Mundeke S, Lonsdorf EV, Pusey AE, Peeters M, Hahn BH, Ochman H. 2014. Rapid changes in the gut microbiome during human evolution. Proc. Natl Acad. Sci. USA 111, 16 431–16 435. ( 10.1073/pnas.1419136111) [DOI] [PMC free article] [PubMed] [Google Scholar]
- 8.Moeller AH, Caro-quintero A, Mjungu D, Georgiev AV, Lonsdorf EV, Muller MN, Pusey AE. 2016. Cospeciation of gut microbiota. Science 353, 380–382. ( 10.1126/science.aaf3951) [DOI] [PMC free article] [PubMed] [Google Scholar]
- 9.Muller AE, Thalman U. 2000. Origin and evolution of primate social organisation: a reconstruction. Biol. Rev. 75, 405–435. ( 10.1111/j.1469-185X.2000.tb00050.x) [DOI] [PubMed] [Google Scholar]
- 10.Lombardo MP. 2008. Access to mutualistic endosymbiotic microbes: an underappreciated benefit of group living. Behav. Ecol. Sociobiol. 62, 479–497. ( 10.1007/s00265-007-0428-9) [DOI] [Google Scholar]
- 11.Archie EA, Theis KR. 2011. Animal behaviour meets microbial ecology. Anim. Behav. 82, 425–436. ( 10.1016/j.anbehav.2011.05.029) [DOI] [Google Scholar]
- 12.Montiel-Castro AJ, González-Cervantes RM, Bravo-Ruiseco G, Pacheco-López G. 2013. The microbiota-gut-brain axis: neurobehavioral correlates, health and sociality. Front. Integr. Neurosci. 7, 70 ( 10.3389/fnint.2013.00070) [DOI] [PMC free article] [PubMed] [Google Scholar]
- 13.Ezenwa VO, Gerardo NM, Inouye DW, Medina M, Xavier JB. 2012. Animal behavior and the microbiome. Science 338, 198–199. ( 10.1126/science.1227412) [DOI] [PubMed] [Google Scholar]
- 14.Ezenwa VO, Ghai RR, McKay AF, Williams AE. 2016. Group living and pathogen infection revisited. Curr. Opin. Behav. Sci. 12, 66–72. ( 10.1016/j.cobeha.2016.09.006) [DOI] [Google Scholar]
- 15.Garrett WS, et al. 2010. Enterobacteriaceae act in concert with the gut microbiota to induce spontaneous and maternally transmitted colitis. Cell Host Microbe 8, 292–300. ( 10.1016/j.chom.2010.08.004) [DOI] [PMC free article] [PubMed] [Google Scholar]
- 16.Zohdy S, Kemp AD, Durden LA, Wright PC, Jernvall J. 2012. Mapping the social network: tracking lice in a wild primate (Microcebus rufus) population to infer social contacts and vector potential. BMC Ecol. 12, 4 ( 10.1186/1472-6785-12-4) [DOI] [PMC free article] [PubMed] [Google Scholar]
- 17.Reynolds JJH, Hirsch BT, Gehrt SD, Craft ME. 2015. Raccoon contact networks predict seasonal susceptibility to rabies outbreaks and limitations of vaccination. J. Anim. Ecol. 84, 1720–1731. ( 10.1111/1365-2656.12422) [DOI] [PubMed] [Google Scholar]
- 18.Craft ME, Volz E, Packer C, Meyers LA. 2011. Disease transmission in territorial populations: the small-world network of Serengeti lions. J. R. Soc. Interface 8, 776–786. ( 10.1098/rsif.2010.0511) [DOI] [PMC free article] [PubMed] [Google Scholar]
- 19.Drewe JA. 2010. Who infects whom? Social networks and tuberculosis transmission in wild meerkats. Proc. R. Soc. B 277, 633–642. ( 10.1098/rspb.2009.1775) [DOI] [PMC free article] [PubMed] [Google Scholar]
- 20.Lloyd-Smith JO, Schreiber SJ, Kopp PE, Getz WM. 2005. Superspreading and the effect of individual variation on disease emergence. Nature 438, 355–359. ( 10.1038/nature04153) [DOI] [PMC free article] [PubMed] [Google Scholar]
- 21.Craft ME. 2015. Infectious disease transmission and contact networks in wildlife and livestock. Phil. Trans. R. Soc. B 370, 20140107 ( 10.1098/rstb.2014.0107) [DOI] [PMC free article] [PubMed] [Google Scholar]
- 22.VanderWaal KL, Atwill ER, Isbell LA, McCowan B. 2014. Linking social and pathogen transmission networks using microbial genetics in giraffe (Giraffa camelopardalis). J. Anim. Ecol. 83, 406–414. ( 10.1111/1365-2656.12137) [DOI] [PubMed] [Google Scholar]
- 23.Bull CM, Godfrey SS, Gordon DM. 2012. Social networks and the spread of Salmonella in a sleepy lizard population. Mol. Ecol. 21, 4386–4392. ( 10.1111/j.1365-294X.2012.05653.x) [DOI] [PubMed] [Google Scholar]
- 24.Springer A, Mellmann A, Fichtel C, Kappeler PM. 2016. Social structure and Escherichia coli sharing in a group-living wild primate, Verreaux's sifaka. BMC Ecol. 16, 6 ( 10.1186/s12898-016-0059-y) [DOI] [PMC free article] [PubMed] [Google Scholar]
- 25.Tung J, et al. 2015. Social networks predict gut microbiome composition in wild baboons. Elife 4, e05224 ( 10.7554/eLife.05224) [DOI] [PMC free article] [PubMed] [Google Scholar]
- 26.Moeller A, Foerster S, Wilson M, Pusey A, Hahn B, Ochman H.. 2016. Social behavior shapes the chimpanzee pan-microbiome. Sci. Adv. 2, e1500997 ( 10.1126/sciadv.1500997) [DOI] [PMC free article] [PubMed] [Google Scholar]
- 27.Campbell JL, Eisemann JH, Williams CV, Glenn KM. 2000. Description of the gastrointestinal tract of five Lemur species: Propithecus tattersalli, Propithecus verreauxi coquereli, Varecia variegata, Hapalemur griseus, and Lemur catta. Am. J. Primatol. 52, 133–142. ( 10.10.1002/1098-2345(200011)52:3%3C133::AID-AJP2%3E3.0.CO;2-%23) [DOI] [PubMed] [Google Scholar]
- 28.Lambert JE. 1998. Primate digestion: Interactions among anatomy, physiology, and feeding ecology. Evol. Anthropol. 7, 8–20. ( 10.1002/(SICI)1520-6505(1998)7:1%3C8::AID-EVAN3%3E3.3.CO;2-J) [DOI] [Google Scholar]
- 29.Powzyk JA, Mowry CB. 2007. The Feeding ecology and related adaptations of Indri indri. In Lemurs - ecology and adaptation (eds Gould L, Sauther ML), pp. 353–368. Berlin, Germany: Springer US. [Google Scholar]
- 30.Lewis RJ, van Schaik CP. 2007. Bimorphism in male Verreaux's sifaka in the Kirindy Forest of Madagascar. Int. J. Primatol. 28, 159–182. ( 10.1007/s10764-006-9107-3) [DOI] [Google Scholar]
- 31.Lewis RJ. 2005. Sex differences in scent-marking in sifaka: Mating conflict or male services? Am. J. Phys. Anthropol. 128, 389–398. ( 10.1002/ajpa.20206) [DOI] [PubMed] [Google Scholar]
- 32.Lawler RR, Richard AF, Riley MA. 2003. Genetic population structure of the white sifaka (Propithecus verreauxi verreauxi) at Beza Mahafaly Special Reserve, southwest Madagascar (1992-2001). Mol. Ecol. 12, 2307–2317. ( 10.1046/j.1365-294X.2003.01909.x) [DOI] [PubMed] [Google Scholar]
- 33.Kubzdela KS. 1997. Sociodemography in diurnal primates? The effects of group size and female dominance rank of intra-group spatial distribution, feeding competition, female reproductive success, and female dispersal patterns in white sifaka, Propithecus verreauxi verreauxi. PhD dissertation, University of Chicago, Chicago, IL. [Google Scholar]
- 34.Lewis RJ. 2010. Grooming patterns in Verreaux's sifaka. Am. J. Primatol. 72, 254–261. ( 10.1002/ajp.20776) [DOI] [PubMed] [Google Scholar]
- 35.Lewis RJ. 2006. Scent marking in sifaka: no one function explains it all. Am. J. Primatol. 68, 622–636. ( 10.1002/ajp) [DOI] [PubMed] [Google Scholar]
- 36.Yatsunenko T, et al. 2012. Human gut microbiome viewed across age and geography. Nature 486, 222–227. ( 10.1038/nature11053) [DOI] [PMC free article] [PubMed] [Google Scholar]
- 37.Leclaire S, Nielsen JF, Drea CM. 2014. Bacterial communities in meerkat anal scent secretions vary with host sex, age, and group membership. Behav. Ecol. 25, 996–1004. ( 10.1093/beheco/aru074) [DOI] [Google Scholar]
- 38.Lewis RJ. 2009. Chest staining variation as a signal of testosterone levels in male Verreaux's Sifaka. Physiol. Behav. 96, 586–592. ( 10.1016/j.physbeh.2008.12.020) [DOI] [PubMed] [Google Scholar]
- 39.Goodman AL, Kallstrom G, Faith JJ, Reyes A, Moore A, Dantas G, Gordon JI. 2011. Extensive personal human gut microbiota culture collections characterized and manipulated in gnotobiotic mice. Proc. Natl Acad. Sci. USA 108, 6252–6257. ( 10.1073/pnas.1102938108) [DOI] [PMC free article] [PubMed] [Google Scholar]
- 40.Caporaso JG, et al. 2012. Ultra-high-throughput microbial community analysis on the Illumina HiSeq and MiSeq platforms. ISME J. 6, 1621–1624. ( 10.1038/ismej.2012.8) [DOI] [PMC free article] [PubMed] [Google Scholar]
- 41.Caporaso JG, et al. 2010. QIIME allows analysis of high-throughput community sequencing data. Nat. Methods 7, 335–336. ( 10.1038/nmeth0510-335) [DOI] [PMC free article] [PubMed] [Google Scholar]
- 42.Love MI, Huber W, Anders S. 2014. Moderated estimation of fold change and dispersion for RNA-seq data with DESeq2. Genome Biol. 15, 1–34. ( 10.1186/S13059-014-0550-8) [DOI] [PMC free article] [PubMed] [Google Scholar]
- 43.Fogel AT. 2015. The gut microbiome of wild lemurs: a comparison of sympatric Lemur catta and Propithecus verreauxi. Folia Primatol. 86, 85–95. ( 10.1159/000369971) [DOI] [PubMed] [Google Scholar]
- 44.Yildirim S, et al. 2014. Primate vaginal microbiomes exhibit species specificity without universal Lactobacillus dominance. ISME J. 8, 2431–2444. ( 10.1038/ismej.2014.90) [DOI] [PMC free article] [PubMed] [Google Scholar]
- 45.Biddle A, Stewart L, Blanchard J, Leschine S. 2013. Untangling the genetic basis of fibrolytic specialization by Lachnospiraceae and Ruminococcaceae in diverse gut communities. Diversity 5, 627–640. ( 10.3390/d5030627) [DOI] [Google Scholar]
- 46.Barelli C, et al. 2015. Habitat fragmentation is associated to gut microbiota diversity of an endangered primate: implications for conservation. Sci. Rep. 5, 14862 ( 10.1038/srep14862) [DOI] [PMC free article] [PubMed] [Google Scholar]
- 47.Gomez A, et al. 2015. Gut microbiome composition and metabolomic profiles of wild western lowland gorillas (Gorilla gorilla gorilla) reflect host ecology. Mol. Ecol. 24, 2551–2565. ( 10.1111/mec.13181) [DOI] [PubMed] [Google Scholar]
- 48.Leimberger KG, Lewis RJ. 2015. Patterns of male dispersal in Verreaux's sifaka (Propithecus verreauxi) at Kirindy Mitea National Park. Am. J. Primatol. 79, 1098–2345. ( 10.1002/ajp.22455) [DOI] [PubMed] [Google Scholar]
- 49.Clayton JB, et al. 2016. Captivity humanizes the primate microbiome. Proc. Natl Acad. Sci. USA 113, 10 376–10 381. ( 10.1073/pnas.1521835113) [DOI] [PMC free article] [PubMed] [Google Scholar]
- 50.Nunn CL, Jordan F, McCabe CM, Verdolin JL, Fewell JH. 2015. Infectious disease and group size: more than just a numbers game. Phil. Trans. R. Soc. B 370, 20140111 ( 10.1098/rstb.2014.0111) [DOI] [PMC free article] [PubMed] [Google Scholar]
- 51.Sah P, Leu ST, Cross PC, Hudson PJ, Bansal S. 2017. Unraveling the disease consequences and mechanisms of modular structure in animal social networks. Proc. Natl Acad. Sci. USA 114, 4165–4170. ( 10.1073/pnas.1613616114) [DOI] [PMC free article] [PubMed] [Google Scholar]
- 52.VanderWaal KL, Atwill ER, Hooper S, Buckle K, McCowan B. 2013. Network structure and prevalence of Cryptosporidium in Belding's ground squirrels. Behav. Ecol. Sociobiol. 67, 1951–1959. ( 10.1007/s00265-013-1602-x) [DOI] [Google Scholar]
- 53.MacIntosh AJJ, Jacobs A, Garcia C, Shimizu K, Mouri K, Huffman MA, Hernandez AD. 2012. Monkeys in the middle: parasite transmission through the social network of a wild primate. PLoS ONE 7, e51144 ( 10.1371/journal.pone.0051144) [DOI] [PMC free article] [PubMed] [Google Scholar]
- 54.Davis S, Klassovskiy N, Ageyev V, Suleimenov B, Atshabar B, Klassovskaya A, Bennet M, Leirs H, Begon M. 2007. Plague metapopulation dynamics in a natural reservoir: the burrow system as the unit of study. Epidemiol. Infect. 135, 740–748. ( 10.1017/S095026880600759X) [DOI] [PMC free article] [PubMed] [Google Scholar]
- 55.Bennett G, et al. 2016. Host age, social group, and habitat type influence the gut microbiota of wild ring-tailed lemurs (Lemur catta). Am. J. Primatol. 892, 883–892. ( 10.1002/ajp.22555) [DOI] [PubMed] [Google Scholar]
- 56.Lax S, et al. 2014. Longitudinal analysis of microbial interaction between humans and the indoor environment. Science 345, 1048–1052. ( 10.1126/science.1254529) [DOI] [PMC free article] [PubMed] [Google Scholar]
- 57.Silk JB, Seyfarth RM, Cheney DL. 1999. The structure of social relationships among female savanna baboons in Moremi reserve. Behaviour 136, 679–703. ( 10.1163/156853999501522) [DOI] [Google Scholar]
- 58.Saunders CD. 1988. Ecological, Social, and evolutionary aspects of baboon grooming behavior. PhD dissertation, Cornell University, Ithaca, NY. [Google Scholar]
- 59.Dillon RJ, Vennard CT, Buckling A, Charnley AK. 2005. Diversity of locust gut bacteria protects against pathogen invasion. Ecol. Lett. 8, 1291–1298. ( 10.1111/j.1461-0248.2005.00828.x) [DOI] [Google Scholar]
- 60.McKenna P, et al. 2008. The macaque gut microbiome in health, lentiviral infection, and chronic enterocolitis. PLoS Pathog. 4, e20 ( 10.1371/journal.ppat.0040020) [DOI] [PMC free article] [PubMed] [Google Scholar]
- 61.Chang JY, Antonopoulos DA, Kalra A, Tonelli A, Khalife WT, Schmidt TM, Young VB. 2008. Decreased diversity of the fecal microbiome in recurrent Clostridium difficile-associated diarrhea. J. Infect. Dis. 197, 435–438. ( 10.1086/525047) [DOI] [PubMed] [Google Scholar]
- 62.Abt MC, Pamer EG. 2014. Commensal bacteria mediated defenses against pathogens. Curr. Opin. Immunol. 29, 16–22. ( 10.1016/j.coi.2014.03.003) [DOI] [PMC free article] [PubMed] [Google Scholar]
- 63.Koenig JE, Spor A, Scalfone N, Fricker AD, Stombaugh J, Knight R, Angenent LT, Ley RE. 2011. Succession of microbial consortia in the developing infant gut microbiome. Proc. Natl Acad. Sci. USA 108, 4578–4585. ( 10.1073/pnas.1000081107) [DOI] [PMC free article] [PubMed] [Google Scholar]
- 64.Ren T, Grieneisen LE, Alberts SC, Archie EA, Wu M. 2015. Development, diet and dynamism: Longitudinal and cross-sectional predictors of gut microbial communities in wild baboons. Environ. Microbiol. 18, 1312–1325. ( 10.1111/1462-2920.12852) [DOI] [PMC free article] [PubMed] [Google Scholar]
- 65.Rimbach R, Bisanzio D, Galvis N, Link A, Di Fiore A, Gillespie TR. 2015. Brown spider monkeys (Ateles hybridus): a model for differentiating the role of social networks and physical contact on parasite transmission dynamics. Phil. Trans. R. Soc. B 370, 20140110 ( 10.1098/rstb.2014.0110) [DOI] [PMC free article] [PubMed] [Google Scholar]
- 66.Barton R. 1985. Grooming site preferences in primates and their functional implications. Int. J. Primatol. 6, 519–532. ( 10.1007/BF02735574) [DOI] [Google Scholar]
- 67.Zamma K. 2002. Grooming site preferences determined by lice infection among Japanese macaques in Arashiyama. Primates 43, 41–49. ( 10.1007/BF02629575) [DOI] [PubMed] [Google Scholar]
- 68.Alexander Richard D. 1974. The evolution of social behavior. Annu. Rev. Ecol. Syst. 5, 325–383. ( 10.1111/j.1365-294X.2011.05232.x) [DOI] [Google Scholar]
- 69.Judge PG, de Waal FBM. 1994. Intergroup grooming relations between alpha females in a population of free-ranging rhesus macaques. Folia Primatol. 63, 63–70. ( 10.1017/CBO9781107415324.004) [DOI] [PubMed] [Google Scholar]
- 70.Buffie CG, et al. 2014. Precision microbiome reconstitution restores bile acid mediated resistance to Clostridium difficile. Nature 517, 205–208. ( 10.1038/nature13828) [DOI] [PMC free article] [PubMed] [Google Scholar]
- 71.Fraune S, Anton-Erxleben F, Augustin R, Franzenburg S, Knop M, Schröder K, Willoweit-Ohl D, Bosch TC. 2015. Bacteria–bacteria interactions within the microbiota of the ancestral metazoan Hydra contribute to fungal resistance. ISME J. 9, 1543–1556. ( 10.1038/ismej.2014.239) [DOI] [PMC free article] [PubMed] [Google Scholar]
- 72.Becker MH, et al. 2015. Composition of symbiotic bacteria predicts survival in Panamanian golden frogs infected with a lethal fungus. Proc. R. Soc. B 282, 20142881 ( 10.1098/rspb.2014.2881) [DOI] [PMC free article] [PubMed] [Google Scholar]
- 73.Perofsky AC, Lewis RJ, Abondano LA, Di Fiore A, Meyers LA. 2017. Data from: Hierarchical social networks shape gut microbial composition in wild Verreaux's sifaka Dryad Digital Repository. ( 10.5061/dryad.qf731) [DOI] [PMC free article] [PubMed]
Associated Data
This section collects any data citations, data availability statements, or supplementary materials included in this article.
Data Citations
- Perofsky AC, Lewis RJ, Abondano LA, Di Fiore A, Meyers LA. 2017. Data from: Hierarchical social networks shape gut microbial composition in wild Verreaux's sifaka Dryad Digital Repository. ( 10.5061/dryad.qf731) [DOI] [PMC free article] [PubMed]
Supplementary Materials
Data Availability Statement
All data and code have been deposited in the Dryad Digital Repository at https://doi.org/10.5061/dryad.qf731 [73].