

Abstract
Background
Human papillomavirus (HPV) vaccine was recommended in 2006 for routine vaccination of US females aged 11–12 years. Most vaccine used through 2014 was quadrivalent vaccine (4vHPV), which prevents HPV-6, -11, -16, and -18 infection. To evaluate vaccine impact, we measured HPV prevalence in the National Health and Nutrition Examination Survey (NHANES).
Methods
We analyzed HPV DNA types detected in self-collected cervicovaginal specimens and demographic, sexual behavior, and self-reported vaccination data from females 14–34 years old. We estimated HPV prevalence in the prevaccine (2003–2006) and vaccine eras (2007–2010 and 2011–2014).
Results
Among 14- to 19-year-olds, 4vHPV-type prevalence decreased from 11.5% (95% confidence interval [CI], 9.1%–14.4%) in 2003–2006 to 3.3% (95% CI, 1.9%–5.8%) in 2011–2014, when ≥1-dose coverage was 55%. Among 20- to 24-year-olds, prevalence decreased from 18.5% (95% CI, 14.9%–22.8%) in 2003–2006 to 7.2% (95% CI, 4.7%–11.1%) in 2011–2014, when ≥1-dose coverage was 43%. Compared to 2003–2006, 4vHPV prevalence in sexually active 14- to 24-year-olds in 2011–2014 decreased 89% among those vaccinated and 34% among those unvaccinated. Vaccine effectiveness was 83%.
Conclusions
Within 8 years of vaccine introduction, 4vHPV-type prevalence decreased 71% among 14- to 19-year-olds and 61% among 20- to 24-year-olds. Estimated vaccine effectiveness was high. The decrease in 4vHPV-type prevalence among unvaccinated females suggests herd protection.
Keywords: human papillomavirus, HPV vaccine, vaccine effectiveness, vaccine impact, prevalence
Persistent infection with human papillomavirus (HPV) can cause genital warts, cervical and other anogenital cancers, and head and neck cancers [1]. Three prophylactic vaccines are available that are highly effective against vaccine-type infections to prevent HPV-associated diseases [2, 3]. Routine vaccination has been recommended for females in the United States since mid-2006 and for males since 2011 [2, 4]. Vaccination is recommended for males and females at age 11 or 12 years, through age 26 years for females and through age 21 years for males who were not vaccinated previously. By 2014, almost all vaccine being used in the United States was quadrivalent (4vHPV) vaccine, which targets HPV types 6, 11, 16, and 18; during this time, vaccination was recommended in a 3-dose schedule [5].
Since HPV vaccine introduction in 2006, coverage has increased but has remained lower than other immunizations recommended for adolescents. In 2008, coverage of ≥1 and 3 doses of HPV vaccine among 13- to 17-year old girls was 37.2% and 17.9%, respectively; in 2015, ≥1 and 3-dose coverage increased to 62.8% and 41.9% [6].
One of the early measures of vaccine impact is declines in vaccine-type infection. HPV testing in self-collected cervicovaginal swabs was incorporated into the National Health and Nutrition Examination Survey (NHANES) prior to vaccine introduction in 2003 and has been monitored in the vaccine era. Declines in vaccine-type prevalence have been documented, first among 14- to 19-year-olds within 4 years of vaccine introduction, and later among 20- to 24-year-olds within 6 years of vaccine introduction [7, 8].
In addition to declines in vaccine-type infection, further impacts of vaccination have been monitored. Prelicensure clinical trials suggested potential protective effects for some non-vaccine types, specifically HPV-31, -33, and -45 [9, 10]. Some postlicensure monitoring studies have demonstrated decreases in nonvaccine types as well [11, 12], but previous NHANES analyses did not identify significant decreases among these specific HPV types [7, 8]. Additionally, assessing prevalence of specific nonvaccine types, to investigate potential type replacement, has been examined following vaccine introduction in different countries [13]. Finally, indirect protection for unvaccinated females, due to reduced prevalence of vaccine-preventable infections in the community, known as herd protection, has been evaluated and demonstrated in countries with high vaccine coverage [11, 14].
In the current analysis using NHANES data through 2014, we assessed type-specific HPV prevalence in the 8 years since vaccine introduction, compared to HPV prevalence prior to vaccine introduction. We also evaluated vaccine effectiveness, comparing HPV prevalence by self-reported vaccination status, as well as possible herd protection, type replacement, and cross-protection against related but non-4vHPV types.
METHODS
Study Design
NHANES is an ongoing series of cross-sectional surveys conducted by the National Center for Health Statistics (NCHS), Centers for Disease Control and Prevention (CDC). The surveys are designed to be nationally representative of the civilian, noninstitutionalized US population. Surveys are conducted in approximately 15 counties, which vary each year. Consenting participants undergo a household interview followed by a physical examination in a mobile examination center (MEC). To increase the precision of estimates, NHANES oversampled various subpopulations in each cycle [15–17]. For example, from 1999 to 2006, adolescents aged 12–19 years were oversampled. Informed consent or assent was obtained from all participants and consent was obtained from guardians of minors. Data for girls aged 14–17 years were obtained through the NCHS Research Data Center. This survey was approved by the NCHS/CDC Research Ethics Review Board.
Demographic, Behavioral, and HPV Vaccination History
Demographic information was ascertained during household interviews. Sexual history information was collected among participants aged 14–59 years by using audio computer-assisted self-interviews in a MEC. Respondents who reported ever having sex (described as vaginal, oral, or anal sex) were asked additional questions about their sexual history. HPV vaccination history was collected beginning in 2007. Persons aged ≥16 years and emancipated minors were interviewed directly. Parents/guardians were interviewed regarding vaccination history for those aged <16 years.
Specimen Collection and Laboratory Methods
Females aged 14–59 years who were examined in a MEC were asked to self-collect a cervicovaginal sample. Extractions and testing were performed at the CDC as previously described [18, 19]. In brief, extracted DNA was tested by using the Research Use Only Linear Array HPV Genotyping Test (Roche Molecular Diagnostics, Indianapolis, Indiana). The Linear Array assay uses L1 consensus polymerase chain reaction (PCR) followed by type-specific hybridization for qualitative detection of 37 HPV types (6, 11, 16, 18, 26, 31, 33, 35, 39, 40, 42, 45, 51, 52, 53, 54, 55, 56, 58, 59, 61, 62, 63, 66, 67, 68, 69, 70, 71, 72, 73, 81, 82, 83, 84, 89, and IS39) and β-globin (control for sample amplification). Samples that tested negative for both HPV and β-globin were considered inadequate. A supplementary HPV-52 PCR assay was performed, as previously described [18].
Data Analysis
We analyzed NHANES data from 2003 to 2014. Analyses were limited to participants aged 14–34 years with adequate self-collected cervicovaginal samples. From 2003 to 2014, a total of 8252 females aged 14–34 years were interviewed, and 6686 self-collected cervicovaginal swabs had adequate DNA for typing (Figure 1).
Figure 1.
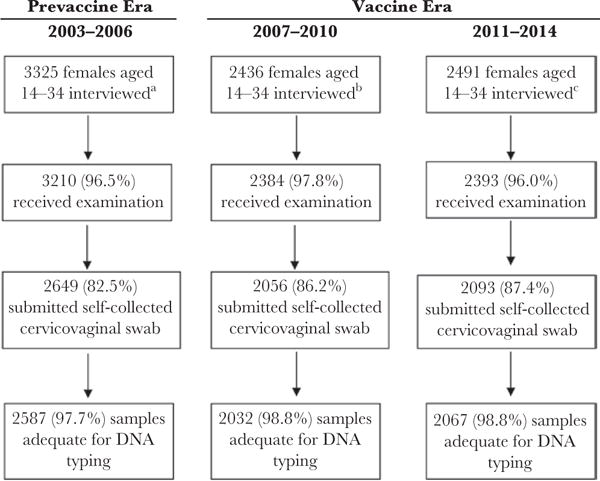
Participation and sample collection among females—National Health and Nutrition Examination Survey, 2003–2014. aThe response rate during 2003–2004 and 2005–2006 among females was 79.7% and 80.9% for the interview portion and 76.0% and 77.8% for the examination portion, respectively. bThe response rate during 2007–2008 and 2009–2010 among females was 78.6% and 79.7% for the interview portion and 75.5% and 77.4% for the examination portion, respectively. cThe response rate during 2011–2012 and 2013–2014 among females was 72.6% and 71.4% for the interview portion and 69.4% and 68.8% for the examination portion, respectively.
NHANES 2-year cycles were combined into 4-year eras to achieve stable estimates. For this analysis, cycles 2003–2004 and 2005–2006 were considered the prevaccine era because vaccination was first recommended in June 2006; 2007–2008 and 2009–2010 were combined for the early vaccine era; and 2011–2012 and 2013–2014 were combined for the later vaccine era. Ages of participants were analyzed in 5- or 6-year age groups (14–19, 20–24, 25–29, and 30–34). We analyzed self-reported receipt of ≥1 dose and 3 doses of HPV vaccine in 2007–2010 and 2011–2014; race/ethnicity, poverty index, and sexual behavior were compared across all 3 eras.
We defined sexually active females as females reporting any vaginal, oral, or anal sex, and defined vaccination as report of ≥1 HPV vaccine dose. Due to changes in race/ethnicity oversampling throughout the NHANES cycles, these categories were analyzed as non-Hispanic white, non-Hispanic black, and other. We analyzed the number of lifetime sexual partners as a 3-level variable: none, 1–2, and ≥3; when limited to sexually active females, this was analyzed as 1–2 or ≥3.
HPV prevalence was determined in each era, by age group. HPV type categories evaluated include any of the 37 HPV types, any non-4vHPV types, non-4vHPV high-risk (HR) types (31, 33, 35, 39, 45, 51, 52, 56, 58, 59, 66 and 68), 3 HR types with proposed cross-protection (31, 33, 45), and 4vHPV types (6, 11, 16, 18). Prevalence of HPV was compared from the prevaccine era (2003–2006) to 2011–2014.
We limited analyses of vaccine effectiveness to sexually active females aged 14–24 years, to ensure all females included had a chance of exposure to HPV. To determine if the vaccinated and unvaccinated populations were comparable, we evaluated characteristics (race/ethnicity, poverty index, and sexual behavior) by era and by vaccination status. We assessed HPV prevalence among sexually active females aged 14–24 years and compared HPV prevalence by vaccination status in 2011–2014 to the prevaccine era, and within 2011–2014. We measured herd protection by comparing 4vHPV-type prevalence among unvaccinated females in the vaccine era years 2011–2014 to the prevaccine years 2003–2006. We estimated vaccine effectiveness by comparing 4vHPV-type prevalence among vaccinated and unvaccinated females within the vaccine era years 2011–2014. While females who did not recall vaccination status (n = 57) were included in the analysis of all females aged 14–34 years, they were excluded from the analysis by vaccination history.
All estimates were generated by applying examination sample weights to account for unequal probabilities of selection and adjustment for nonresponse [20]. Variance estimates were calculated by using a Taylor series linearization to account for the complex survey design [21]. Logit confidence intervals (CIs) were calculated for prevalence estimates, with α = .05. Prevalence estimates with a relative standard error >30% are noted and are considered unstable. We calculated prevalence ratios (PRs) and adjusted prevalence ratios (aPRs) with 95% CIs, adjusting for race/ethnicity, poverty index, and number of lifetime sexual partners. The PR was the predicted probability calculated from the logistic regression model using the PREDMARG statement in SAS-callable SUDAAN [22]. Vaccine effectiveness was calculated as 100 × (1 − aPR). Statistical significance was defined as P < .05 or, when prevalence ratios are presented, a 95% CI that does not include 1. Statistical analyses were conducted in SAS version 9.4 software (SAS Institute, Cary, North Carolina) and SUDAAN version 11.0 software (Research Triangle Institute, Research Triangle Park, North Carolina).
RESULTS
Comparison of Prevaccine With Vaccine Eras by Age Group
Reported vaccination with ≥1 dose of HPV vaccine increased between 2007–2010 and 2011–2014 in the age groups 14–19, 20–24, and 25–29 years (Table 1). In 2011–2014, 54.7% of females aged 14–19 years, 43.0% aged 20–24 years, and 24.8% aged 25–29 years reported receipt of ≥1 dose. Compared with the prevaccine era, there was some variation in the distribution of race/ethnicity in the vaccine eras, but was only significant among the 14- to 19-year-old females. Additionally, there was a nonsignificant decrease in the percentage sexually active among 14- to 19-year-old females; however, the percentage with ≥3 lifetime partners remained stable. In females aged ≥20 years, >90% reported having had sex.
Table 1.
Reported Vaccination History, Demographic Characteristics, and Selected Sexual Behaviors in Females Aged 14–34 Years, According to Age Group—National Health and Nutrition Examination Survey, 2003–2014
| Age Group/Characteristic | Prevaccine Era (2003–2006) % (95% CI) |
Vaccine Era (2007–2010) % (95% CI) |
Vaccine Era (2011–2014) % (95% CI) |
|---|---|---|---|
| 14–19 y | n = 1363 | n = 740 | n = 797 |
| HPV vaccination history | |||
| ≥1 dose | … | 34.1 (28.4–40.3) | 54.7 (49.6–59.7)a |
| 3 doses | … | 21.1 (15.8–27.6) | 37.5 (32.7–42.6)a |
| Race/ethnicity | |||
| Non-Hispanic white | 65.5 (58.9–71.6) | 60.1 (54.4–65.6) | 57.7 (50.2–64.9)a |
| Non-Hispanic black | 14.8 (11.0–19.7) | 15.3 (12.1–19.0) | 14.5 (10.2–20.3) |
| Other | 19.7 (15.6–24.4) | 24.6 (20.1–29.8) | 27.8 (23.2–32.8) |
| Poverty index | |||
| Below poverty | 23.0 (18.7–27.9) | 24.1 (19.6–29.3) | 25.4 (20.0–31.6) |
| Sexual behavior | |||
| Ever had sex | 54.0 (50.9–57.0) | 50.3 (45.0–55.6) | 48.2 (43.0–53.3) |
| ≥3 lifetime sex partners | 25.6 (22.5–29.0) | 22.6 (19.9–25.5) | 23.4 (19.4–27.9) |
|
| |||
| 20–24 y | n = 432 | n = 445 | n = 442 |
| HPV vaccination history | |||
| ≥1 dose | … | 17.8 (12.4–24.9) | 43.0 (36.0–50.4)a |
| 3 doses | … | 9.2 (5.4–15.2) | 25.4 (19.5–32.3)a |
| Race/ethnicity | |||
| Non-Hispanic white | 61.6 (54.6–68.2) | 56.7 (49.0–64.2) | 55.7 (46.9–64.1) |
| Non-Hispanic black | 15.7 (11.1–21.9) | 15.9 (12.3–20.5) | 16.6 (11.4–23.6) |
| Other | 22.6 (17.5–28.7) | 27.3 (21.1–34.5) | 27.7 (21.8–34.5) |
| Poverty index | |||
| Below poverty | 25.7 (19.8–32.7) | 31.8 (25.6–38.7) | 35.7 (28.0–44.3) |
| Sexual behavior | |||
| Ever had sex | 91.4 (86.1–94.8) | 91.9 (88.3–94.5) | 91.4 (86.9–94.5) |
| ≥3 lifetime sex partners | 60.7 (53.7–67.2) | 71.8 (66.1–77.0) | 68.4 (63.9–72.5) |
|
| |||
| 25–29 y | n = 403 | n = 414 | n = 395 |
| HPV vaccination history | |||
| ≥1 dose | … | 7.8 (5.5–11.1) | 24.8 (19.7–30.7)a |
| 3 doses | … | 3.8 (2.2–6.3) | 17.1 (12.3–23.2)a |
| Race/ethnicity | |||
| Non-Hispanic white | 65.0 (57.9–71.6) | 63.6 (56.0–70.5) | 56.4 (47.8–64.7) |
| Non-Hispanic black | 12.5 (8.9–17.4) | 12.3 (8.7–17.2) | 11.9 (8.6–16.2) |
| Other | 22.4 (17.3–28.6) | 24.1 (19.6–29.3) | 31.7 (25.4–38.8) |
| Poverty index | |||
| Below poverty | 16.3 (12.5–21.0) | 19.2 (16.3–22.5) | 21.2 (16.9–26.1) |
| Sexual behavior | |||
| Ever had sex | 95.0 (91.7–97.1) | 95.6 (92.0–97.7) | 95.4 (92.5–97.2) |
| ≥3 lifetime sex partners | 73.2 (66.4–79.0) | 71.9 (66.7–76.6) | 71.8 (64.9–77.8) |
|
| |||
| 30–34 y | n = 389 | n = 433 | n = 433 |
| HPV vaccination history | |||
| ≥1 dose | … | 3.7 (2.0–6.7) | 7.0 (4.6–10.4) |
| 3 doses | … | 1.3 (.6–3.0)b | 4.2 (2.4–7.2)a |
| Race/ethnicity | |||
| Non-Hispanic white | 61.8 (55.6–67.7) | 58.1 (48.5–67.0) | 59.7 (53.1–66.0) |
| Non-Hispanic black | 15.8 (11.6–21.2) | 14.4 (9.9–20.5) | 13.6 (10.2–18.0) |
| Other | 22.4 (17.7–27.8) | 27.5 (20.9–35.4) | 26.7 (21.1–33.1) |
| Poverty index | |||
| Below poverty | 16.0 (12.7–20.1) | 18.2 (13.9–23.4) | 21.0 (16.6–26.2) |
| Sexual behavior | |||
| Ever had sex | 98.4 (95.4–99.4) | 97.4 (93.0–99.1) | 99.1 (97.8–99.7) |
| ≥3 lifetime sex partners | 73.6 (68.2–78.4) | 69.3 (63.5–74.6) | 75.9 (70.0–81.0) |
All prevalence estimates and 95% CIs are weighted.
Abbbreviations: CI, confidence interval; HPV, human papillomavirus.
P < .05, comparing 2011–2014 to 2003–2006, except vaccination history compared 2011–2014 to 2007–2010; race/ethnicity compared as a 3-level variable.
Relative standard error >30%.
To assess the impact of vaccination on HPV prevalence, the prevalence of 4vHPV types was determined by age group. Among females aged 14–19 years, the prevalence of 4vHPV types decreased from 11.5% in 2003–2006, to 5.0% in 2007–2010, and 3.3% in 2011–2014 (aPR, 0.29 [95% CI, .16–.53], comparing 2011–2014 to 2003–2006) (Table 2). There was also a decrease among females aged 20–24 years, from 18.5% in 2003–2006 to 7.2% in 2011–2014 (aPR, 0.35 [95% CI, .21–.58]). No significant decreases were observed in 4vHPV types among older age groups. Some decreases were noted in any HPV, non-4vHPV, and non-4vHPV HR types among 14- to 19-year-olds in 2011–2014, compared with 2003–2006, but these were attenuated when adjusted for race/ethnicity, poverty index, and number of lifetime partners. No statistically significant decreases were found in any group for the combined measure of any HPV-31, -33, and -45 types, for which cross-protection has been suggested in other studies.
Table 2.
Human Papillomavirus Prevalence Among Females Aged 14–34 Years, According to Age Group—National Health and Nutrition Examination Survey, 2003–2014
| Prevaccine Era (2003–2006) | Vaccine Era (2007–2010) | Vaccine Era (2011–2014) | Comparison of 2011–2014 to 2003–2006 | ||
|---|---|---|---|---|---|
|
|
|||||
| Age Group and HPV Typesa % | (95% CI) | (95% CI) | (95% CI) | PR (95% CI) | aPR (95% CI)b |
| 14–19 y | |||||
| Any HPV | 32.9 (29.5–36.5) | 26.1 (22.3–30.3) | 25.9 (21.7–30.6) | 0.79 (.65–.96) | 0.84 (.71–.99) |
| Non-4vHPV | 31.2 (27.9–34.8) | 25.3 (21.4–29.5) | 25.5 (21.3–30.2) | 0.82 (.67–1.00) | 0.88 (.74–1.04) |
| Non-4vHPV HR | 20.7 (17.8–24.0) | 16.4 (12.9–20.7) | 15.4 (11.5–20.2) | 0.74 (.54–1.01) | 0.83 (.64–1.09) |
| HPV types 31, 33, 45 | 4.3 (3.1–6.1) | 1.7 (.9–3.2) | 2.4 (1.1–5.4)c | 0.56 (.24–1.33) | 0.71 (.29–1.77) |
| 4vHPV | 11.5 (9.1–14.4) | 5.0 (3.8–6.6) | 3.3 (1.9–5.8) | 0.29 (.16–.52) | 0.29 (.16–.53) |
|
| |||||
| 20–24 y | |||||
| Any HPV | 53.7 (45.9–61.4) | 59.7 (53.9–65.4) | 56.7 (50.9–62.3) | 1.05 (.89–1.26) | 1.00 (.86–1.16) |
| Non-4vHPV | 50.7 (43.3–58.0) | 57.4 (51.3–63.3) | 55.8 (49.9–61.6) | 1.10 (.92–1.31) | 1.05 (.90–1.23) |
| Non-4vHPV HR | 32.9 (26.7–39.7) | 37.4 (32.4–42.7) | 34.5 (27.7–42.0) | 1.05 (.79–1.39) | 1.04 (.78–1.39) |
| HPV types 31, 33, 45 | 7.8 (5.0–12.1) | 6.4 (4.3–9.4) | 4.7 (2.6–8.3) | 0.60 (.29–1.24) | 0.60 (.26–1.38) |
| 4vHPV | 18.5 (14.9–22.8) | 19.9 (15.4–25.3) | 7.2 (4.7–11.1) | 0.39 (.24–.63) | 0.35 (.21–.58) |
|
| |||||
| 25–29 y | |||||
| Any HPV | 46.8 (42.9–50.8) | 50.8 (45.9–55.6) | 44.7 (38.9–50.6) | 0.96 (.82–1.11) | 0.96 (.82–1.13) |
| Non-4vHPV | 43.8 (38.9–48.9) | 48.6 (43.7–53.6) | 43.7 (37.7–49.9) | 1.00 (.84–1.19) | 1.02 (.85–1.22) |
| Non-4vHPV HR | 24.6 (19.0–31.2) | 28.4 (23.2–34.3) | 25.5 (21.3–30.3) | 1.04 (.77–1.40) | 0.98 (.71–1.34) |
| HPV types 31, 33, 45 | 5.8 (3.6–9.0) | 6.3 (4.0–9.8) | 6.0 (3.7–9.7) | 1.04 (.54–2.00) | 1.24 (.60–2.56) |
| 4vHPV | 11.8 (8.8–15.6) | 13.1 (10.0–17.2) | 8.8 (6.3–12.1) | 0.75 (.49–1.14) | 0.76 (.51–1.15) |
|
| |||||
| 30–34 y | |||||
| Any HPV | 47.9 (42.3–53.5) | 40.1 (33.8–46.7) | 41.3 (35.8–47.0) | 0.86 (.72–1.03) | 0.78 (.66–.93) |
| Non-4vHPV | 44.5 (39.1–50.1) | 37.8 (31.6–44.5) | 39.2 (33.6–45.0) | 0.88 (.73–1.06) | 0.80 (.67–.97) |
| Non-4vHPV HR | 21.0 (15.5–27.8) | 20.1 (15.6–25.6) | 18.3 (15.1–21.9) | 0.87 (.62–1.22) | 0.80 (.54–1.18) |
| HPV types 31, 33, 45 | 4.1 (2.2–7.6)c | 4.0 (2.5–6.4) | 4.1 (2.4–6.8) | 1.00 (.45–2.21) | 0.74 (.33–1.66) |
| 4vHPV | 9.5 (6.7–13.2) | 8.9 (6.5–11.9) | 7.1 (5.1–9.9) | 0.75 (.47–1.19) | 0.71 (.44–1.15) |
All prevalence estimates and 95% CIs are weighted.
Abbreviations: 4vHPV, quadrivalent human papillomavirus; aPR, adjusted prevalence ratio; CI, confidence interval; HPV, human papillomavirus; HR, high risk; PR, prevalence ratio.
Any HPV: HPV types 6, 11, 16, 18, 26, 31, 33, 35, 39, 40, 42, 45, 51, 52, 53, 54, 55, 56, 58, 59, 61, 62, 63, 66, 67, 68, 69, 70, 71, 72, 73, 81, 82, 83, 84, 89, IS39. Non-4vHPV: HPV types 26, 31, 33, 35, 39, 40, 42, 45, 51, 52, 53, 54, 55, 56, 58, 59, 61, 62, 63, 66, 67, 68, 69, 70, 71, 72, 73, 81, 82, 83, 84, 89, IS39. Non-4vHPV HR: HPV types 31, 33, 35, 39, 45, 51, 52, 56, 58, 59, 66, 68. 4vHPV: HPV types 6, 11, 16, 18.
Adjusted for race/ethnicity, poverty index, and number of lifetime partners.
Relative standard error >30%.
Prevalence of individual HPV types among females aged 14–19 and 20–24 years was assessed, comparing 2011–2014 to 2003–2006 (Figure 2; Supplementary Table 1). For individual 4vHPV types, the prevalence estimates were lower in 2011–2014, compared with 2003–2006, among both age groups. No significant increases of non-4vHPV types were observed among those 14–19 years of age; the prevalence of 4 non-4vHPV types (HPV-33, -40, -56, -84) decreased in 2011–2014, compared with 2003–2006. Among 20- to 24-year-old females, there were no significant increases or decreases in any non-4vHPV HR types; a significant increase was noted among 1 non-4vHPV type (HPV-73).
Figure 2.
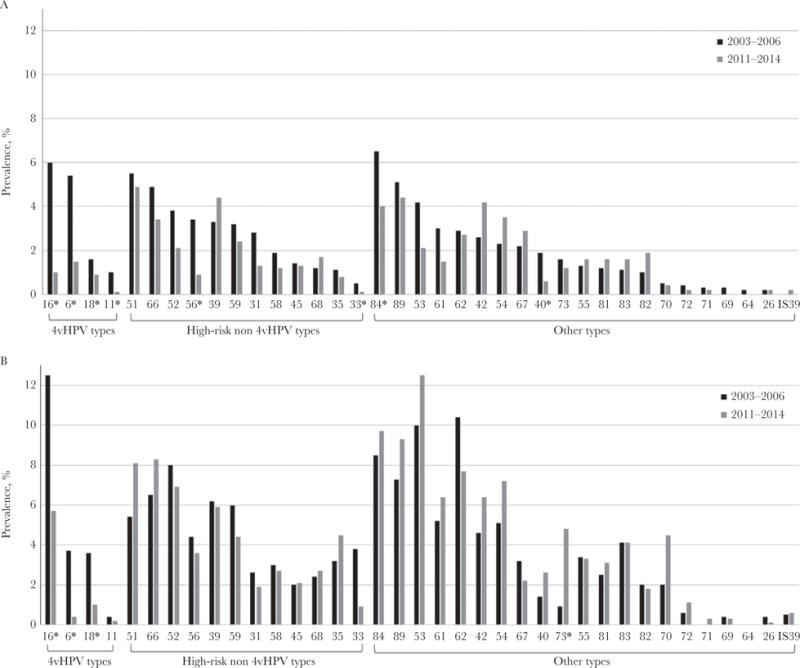
Prevalence of individual human papillomavirus (HPV) types among females aged 14–19 years (A) and 20–24 years (B), National Health and Nutrition Examination Survey, 2003–2006 and 2011–2014. *P < .05 based on Wald χ2 test, comparing 2011–2014 to 2003–2006. HPV types ordered from highest to lowest prevalence among 14- to 19-year-old females in 2003–2006 within each HPV type category. Estimates with a relative standard error (RSE) of >30% to 50% are as follows: 14- to 19-year-old females: 2003–2006: HPV-11, -26, -33, -64, -71, -82; 2011–2014: HPV-6, -18, -31, -45, -53, -54, -55, -56, -61, -62, -68, -70, -73, -81, -82, -83. 20- to 24-year-old females: 2003–2006: HPV-31, -33, -35, -45, -55, -56, -67, -68, -73, -81, -82, -83; 2011–2014: HPV-18, -31, -40, -45, -58, -67, -70, -81, -82. Estimates with an RSE of >50% are as follows: 14- to 19-year-old females: 2003–2006: HPV-69, -72, -IS39; 2011–2014: HPV-11, -16, -26, -33, -35, -40, -71, -72, -IS39. 20- to 24-year-old females: 2003–2006: HPV-11, -26, -40, -69, -71, -72, -IS39; 2011–2014: HPV-6, -11, -26, -33, -69, -71, -72, -IS39.
HPV Prevalence Among Sexually Active Females Aged 14–24 Years
Further analyses were limited to sexually active females aged 14–24 years, comparing 2011–2014 to 2003–2006. Among this population, coverage of ≥1 HPV vaccine dose was 50.8% (95% CI, 40.1%–61.4%) in 2011–2014.
To assess potential population changes that could impact HPV prevalence, we evaluated age, race/ethnicity, poverty, and number of partners among sexually active females, comparing 2011–2014 to 2003–2006 (Table 3). Overall, these characteristics did not differ significantly between the 2 time periods, except that sexually active females in 2011–2014 had a higher proportion with ≥3 sex partners. Vaccinated females in 2011–2014 did not differ significantly from females in the prevaccine era. However, compared to females in 2003–2006, a higher proportion of unvaccinated females in 2011–2014 were nonwhite, older, and reported ≥3 sex partners. To assess the potential contribution of these characteristics to estimates of vaccine effectiveness, vaccinated and unvaccinated females within 2011–2014 were compared. Compared with unvaccinated females, a higher proportion of vaccinated females in 2011–2014 were non-Hispanic white, and a lower proportion were below the poverty index and aged 20–24 years; no differences in sexual behavior were noted.
Table 3.
Characteristics of Sexually Active Females Aged 14–24 Years, Overall and According to Vaccination History—National Health and Nutrition Examination Survey, 2003–2006 and 2011–2014
| Characteristics | Prevaccine Era (2003–2006), % (95% CI) | Vaccine Era (2011–2014), % (95% CI)
|
||
|---|---|---|---|---|
| Overall | Vaccinated | Unvaccinated | ||
|
| ||||
| n = 1095 | n = 707 | n = 347 | n = 360 | |
| Race/ethnicity | ||||
| Non-Hispanic white | 64.0 (56.7–70.7) | 56.6 (48.9–64.0) | 63.2 (55.5–70.3)a | 52.1 (42.3–61.8)b |
| Non-Hispanic black | 15.8 (11.4–21.4) | 17.0 (11.7–24.1) | 16.0 (11.0–22.7) | 18.0 (11.8–26.4) |
| Other | 20.2 (15.9–25.4) | 26.4 (21.8–31.7) | 20.8 (15.8–26.9)a | 29.9 (24.3–36.3)b |
|
| ||||
| Poverty index | ||||
| Below poverty | 27.5 (22.3–33.3) | 33.0 (25.6–41.4) | 27.4 (19.6–36.7)a | 37.6 (28.9–47.1) |
|
| ||||
| Sexual behavior | ||||
| ≥3 lifetime sex partners | 58.4 (54.9–61.7) | 65.3 (60.9–69.5)b | 63.9 (56.8–70.4) | 67.0 (59.3–73.9)b |
|
| ||||
| Age, y | ||||
| 20–24 | 57.1 (53.7–60.6) | 63.7 (57.5–69.5) | 58.1 (50.5–65.2)a | 69.3 (61.8–75.9)b |
All prevalence estimates and 95% CIs are weighted.
Abbreviation: CI, confidence interval.
Comparison of vaccinated with unvaccinated, within 2011–2014, P < .05.
Comparison of 2011–2014 to 2003–2006, P < .05.
Compared to 2003–2006, there was no significant increase or decrease in prevalence of any HPV, non-4vHPV types, non-4vHPV HR types, or proposed cross-protective types, overall or by vaccination status in 2011–2014 (Table 4). In the prevaccine era, 4vHPV-type prevalence was 18.5% among sexually active females aged 14–24 years. This was significantly lower among vaccinated females in 2011–2014, with a prevalence of 2.0% (aPR, 0.09 [95% CI, .04–.20]). Additionally, 4vHPV-type prevalence decreased to 12.2% among unvaccinated females in 2011–2014 (aPR, 0.60 [95% CI, .37–.98]).
Table 4.
Human Papillomavirus Prevalence Among Sexually Active Females Aged 14–24 Years, Overall and According to Vaccination History—National Health and Nutrition Examination Survey, 2003–2006 and 2011–2014
| Prevaccine Era (2003–2006) | Vaccine Era (2011–2014) | Comparison of 2011–2014 to 2003–2006 | Comparison Within 2011–2014 | ||
|---|---|---|---|---|---|
|
|
|||||
| HPV Typesa/Vaccination Status | % (95% CI) | % (95% CI) | aPR (95% CI)b | aPR (95% CI)b | |
| Any HPV | |||||
| Overall | 54.3 (49.4–59.1) | 57.0 (52.1–61.8) | 0.99 (.89–1.11) | … | |
| Vaccinated | … | 58.4 (51.6–64.9) | 1.04 (.92–1.19) | 1.07 (.90–1.28) | |
| Unvaccinated | … | 57.1 (49.9–64.0) | 0.97 (.83–1.13) | Ref | |
|
| |||||
| Non-4vHPV | |||||
| Overall | 51.1 (46.4–55.8) | 56.4 (51.5–61.2) | 1.04 (.93–1.17) | … | |
| Vaccinated | … | 58.2 (51.3–64.8) | 1.11 (.97–1.27) | 1.09 (.91–1.30) | |
| Unvaccinated | … | 56.1 (48.9–63.0) | 1.01 (.85–1.19) | Ref | |
|
| |||||
| Non-4vHPV HR | |||||
| Overall | 32.7 (28.9–36.9) | 35.1 (29.3–41.4) | 1.02 (.84–1.24) | … | |
| Vaccinated | … | 34.2 (26.9–42.4) | 1.01 (.79–1.30) | 0.95 (.68–1.33) | |
| Unvaccinated | … | 36.7 (28.5–45.8) | 1.05 (.80–1.39) | Ref | |
|
| |||||
| HPV types 31, 33, 45 | |||||
| Overall | 6.6 (4.7–9.2) | 4.9 (3.1–7.6) | 0.75 (.42–1.32) | … | |
| Vaccinated | … | 4.9 (2.9–8.2) | 0.70 (.36–1.37) | 0.86 (.43–1.74) | |
| Unvaccinated | … | 5.0 (2.7–9.1) | 0.82 (.41–1.64) | Ref | |
|
| |||||
| 4vHPV | |||||
| Overall | 18.5 (16.1–21.2) | 7.1 (4.7–10.5) | 0.33 (.23–.49) | … | |
| Vaccinated | … | 2.0 (1.0–3.9)c | 0.09 (.04–.20) | 0.17 (.06–.50) | |
| Unvaccinated | … | 12.2 (7.6–19.2) | 0.60 (.37–.98) | Ref | |
All prevalence estimates and 95% CIs are weighted.
Abbreviations: 4vHPV, quadrivalent human papillomavirus; aPR, adjusted prevalence ratio; CI, confidence interval; HPV, human papillomavirus; PR, prevalence ratio.
Any HPV: HPV types 6, 11, 16, 18, 26, 31, 33, 35, 39, 40, 42, 45, 51, 52, 53, 54, 55, 56, 58, 59, 61, 62, 63, 66, 67, 68, 69, 70, 71, 72, 73, 81, 82, 83, 84, 89, IS39. Non-4vHPV: HPV types 26, 31, 33, 35, 39, 40, 42, 45, 51, 52, 53, 54, 55, 56, 58, 59, 61, 62, 63, 66, 67, 68, 69, 70, 71, 72, 73, 81, 82, 83, 84, 89, IS39. Non-4vHPV HR: HPV types 31, 33, 35, 39, 45, 51, 52, 56, 58, 59, 66, 68. 4vHPV: HPV types 6, 11, 16, 18.
Adjusted for race/ethnicity, poverty index, and number of lifetime partners.
Relative standard error >30%.
Within the vaccine era years 2011–2014, no differences in prevalence were noted in vaccinated compared with unvaccinated females for any HPV, non-4vHPV, or non-4vHPV HR types. The 4vHPV-type prevalence was lower among vaccinated compared with unvaccinated females: 2.0% vs 12.2% (aPR, 0.17 [95% CI, .06–.50]). This corresponds to a vaccine effectiveness of 83%.
DISCUSSION
Within 8 years after HPV vaccine introduction in the United States, 4vHPV-type prevalence in cervicovaginal specimens decreased 71% among females aged 14–19 years and 61% among females aged 20–24 years, compared with the prevaccine era. There was no statistically significant decline in 4vHPV types among females aged 25–29 or 30–34 years. In an analysis of NHANES data within 4 years of HPV vaccine introduction, a 56% decline was observed among 14- to 19-year-olds [7]. In a subsequent analysis, within 6 years of vaccine introduction, in addition to a decline among 14- to 19-year-olds, a 34% decline was observed in 20- to 24-year-olds [8]. In the current analyses, larger decreases were observed in both 14- to 19-year-olds and 20- to 24-year-olds compared with past analyses, consistent with increasing vaccination coverage in these age groups.
We evaluated a variety of characteristics and behaviors of young women that, along with the HPV vaccination program, could have impacted trends in HPV prevalence. We noted some variation in race/ethnicity composition and poverty since 2003, similar to what has been observed in US census data [23, 24]. We also noted a slight decrease in the proportion of females aged 14–19 who report sexual activity; however, this was not statistically significant. Another study evaluating changes in adolescent sexual behavior found no decreases in adolescents reporting ever having sexual intercourse over the same time frame [25]. In our analysis, reductions in 4vHPV-type prevalence remained significant after multivariable adjustment for both demographics and sexual behaviors. Our findings of declining prevalence of 4vHPV types among females aged 14–19 years and 20–24 years are consistent with ecologic studies that have documented declines in genital warts and precancer lesions among women in their early 20s; however, these prior studies did not adjust for possible changes in sexual behavior [26, 27]. The specificity of declines to 4vHPV types in our adjusted analyses further supports the conclusion that the vaccination program is primarily responsible for the observed declines in HPV prevalence.
We investigated herd effects of vaccination by evaluating prevalence among unvaccinated females aged 14–24 years in 2011–2014, compared with the prevaccine era. There was a 34% decrease in 4vHPV-type prevalence among unvaccinated females. While herd protection from HPV vaccines has been demonstrated in other populations [11, 14, 28], this is the first NHANES analysis to show a statistically significant decline in 4vHPV-type prevalence among unvaccinated females. Herd protection can be affected by vaccine coverage; the population-level vaccine coverage required for herd protection varies by infectious agent [29, 30]. HPV prevalence studies reporting herd protection in other countries were conducted when vaccine coverage was >80% [11, 14], while studies in the United States reported herd protection with ≥1 dose HPV vaccine coverage of 60%–70% [28, 31]. In our analysis, herd protection is suggested with ≥1 dose coverage of 50%. Herd protection has also been suggested among males in a recent analysis of NHANES [32]. Vaccination of US males was not a routine recommendation until 2011, and ≥1 dose coverage among adolescent males was lower than for females during the study period. The herd effects suggested in the recent NHANES analysis among males are likely due, at least in part, to the female vaccination program.
Previous investigations of herd protection using NHANES data were impacted by differences in characteristics of women in the vaccine era by vaccination status compared with the pre-vaccine era, making it difficult to interpret changes in the prevalence among unvaccinated women [7]. In this analysis, we also found some differences, with a higher proportion of sexually active unvaccinated females in 2011–2014 having ≥3 sexual partners, compared to sexually active females in the prevaccine era. In spite of the greater number of partners in unvaccinated females, we observed a lower prevalence of 4vHPV types but not other HPV types in this group, which we interpret as evidence of herd protection in 2011–2014.
This study estimated a vaccine effectiveness with ≥1 dose of HPV vaccine of 83%. This is lower than the >96% vaccine efficacy against vaccine-type precancer endpoints in the per protocol analyses reported in the clinical trials [33, 34]. However, our vaccine effectiveness estimate includes females who were likely infected prior to vaccination and some who did not receive the full vaccine series. As vaccine effectiveness compares infection or disease prevalence among vaccinated persons to unvaccinated persons, vaccine effectiveness could become difficult to accurately measure as herd effects decrease HPV prevalence in the unvaccinated population.
Clinical trials and some postlicensure monitoring studies demonstrated decreases in some non-4vHPV types, suggesting possible cross-protection [9–12]. However, significant decreases of non-4vHPV HR types have not been identified in previous NHANES analyses [7, 8]. In a meta-analysis by Drolet et al, data from 20 studies in 9 high-income countries were combined to evaluate effectiveness against vaccine types and potential cross-protection for HPV types 31, 33, or 45. They found evidence of reduced prevalence of the combined prevalence of HPV-31, -33, and -45 among females aged ≤19 years, but not among females aged 20–24 years [35]. In this analysis, we did not find a statistically significant decline in the combined measure of HPV-31, -33, or -45 prevalence, but there was a significant decrease in HPV-33 among females 14–19 years of age. In studies to date, evidence of cross-protection has varied by vaccine type, age group, and study population. In the future, it might be more difficult to assess cross-protection using future cycles of NHANES, as these 3 types are targeted by the 9-valent HPV vaccine, introduced in the United States in 2015.
While type replacement is thought to be unlikely with HPV vaccination, studies in several countries have been monitoring type-specific HPV prevalence since vaccine introduction for increases in any non-4vHPV HR types. A meta-analysis of 9 studies of HPV prevalence reported increases in some non-4vHPV types, but these were inconsistent across studies for the 2 age groups examined [13]. No consistent increases in non-4vHPV types have been observed in prior NHANES analyses [7, 8]. In this analysis, at a period of higher vaccine coverage in the United States, there were no increases in non-4vHPV HR–type categories or individual non-4vHPV HR types. Overall, no increases were noted among any non-4vHPV types among females aged 14–19 years, and 1 non-high-risk non-4vHPV type increased among females aged 20–24 years; the clinical significance of this increase is unknown.
This analysis is subject to several limitations. First, vaccination history in NHANES is self-reported; over or under-reporting could impact our vaccine effectiveness and herd protection estimates. Overall, however, HPV vaccine coverage estimates in our analysis are similar to nationwide estimates using vaccine provider–confirmed vaccination information [6]. Second, there were changes in the way some racial groups were sampled over time, and adolescents were not oversampled in all survey years. While this could impact precision, oversampling should not greatly impact our prevalence estimates over the survey years due to the weighted analysis. And finally, this study evaluated the prevalence of HPV from cervicovaginal infections at one time point, and therefore could not assess persistent infections or HPV-associated disease. The strengths of this study, including population-based sampling, stable HPV testing methods used in all survey years, as well as demographic and behavioral data linked to laboratory data, allow for trends in HPV prevalence to be compared across multiple cycles, while controlling for population changes in sexual behaviors.
Since HPV vaccine was licensed and recommended, cervicovaginal 4vHPV-type prevalence has decreased in both 14- to 19-year-olds and 20- to 24-year-olds. High vaccine effectiveness was demonstrated in this analysis, and there was evidence of herd protection, with a decrease in HPV prevalence among unvaccinated females. Continued monitoring in NHANES will be important to evaluate the impact of a national vaccine program, including further herd protection and potential type replacement. Over time, we expect to observe decreases in prevalence among older age groups, as persons vaccinated at the recommended ages reach their late 20s and 30s. Monitoring will also allow evaluation of recent changes in recommendations. In 2015, a 9-valent HPV vaccine was introduced in the United States [3], and future analyses of NHANES will allow evaluation of changes in the 5 additional types targeted by that vaccine. In 2016, a 2-dose HPV vaccination schedule was recommended for persons initiating vaccination at ages 9–14 years [36]. Continued efforts are needed to increase HPV vaccination coverage in the United States, and further impact can be anticipated with increased coverage among the targeted population.
Supplementary Material
Acknowledgments
We thank Mariela Scarbrough, Sonya Patel, and Juanita Onyekwuluje, Division of High-Consequence Pathogens and Pathology, National Center for Emerging and Zoonotic Infectious Diseases, CDC, for exceptional work in the HPV laboratory.
Financial support. This study was funded by the Division of Viral Diseases, National Center for Immunization and Respiratory Diseases, and the National Center for Health Statistics, CDC.
Footnotes
Presented in part: 2017 Pediatric Academic Societies Meeting, San Francisco, California, 8 May 2017.
Supplementary Data
Supplementary materials are available at The Journal of Infectious Diseases online. Consisting of data provided by the authors to benefit the reader, the posted materials are not copyedited and are the sole responsibility of the authors, so questions or comments should be addressed to the corresponding author.
Disclaimer. The findings and conclusions in this report are those of the authors and do not necessarily represent the official position of the CDC.
Potential conflicts of interest. All authors: No reported conflicts of interest. All authors have submitted the ICMJE Form for Disclosure of Potential Conflicts of Interest. Conflicts that the editors consider relevant to the content of the manuscript have been disclosed.
References
- 1.Jemal A, Simard EP, Dorell C, et al. Annual Report to the Nation on the Status of Cancer, 1975–2009, featuring the burden and trends in human papillomavirus (HPV)-associated cancers and HPV vaccination coverage levels. J Natl Cancer Inst. 2013;105:175–201. doi: 10.1093/jnci/djs491. [DOI] [PMC free article] [PubMed] [Google Scholar]
- 2.Markowitz LE, Dunne EF, Saraiya M, et al. Centers for Disease Control and Prevention (CDC) Human papillomavirus vaccination: recommendations of the Advisory Committee on Immunization Practices (ACIP) MMWR Recomm Rep. 2014;63:1–30. [PubMed] [Google Scholar]
- 3.Petrosky E, Bocchini JA, Jr, Hariri S, et al. Centers for Disease Control and Prevention (CDC) Use of 9-valent human papillomavirus (HPV) vaccine: updated HPV vaccination recommendations of the Advisory Committee on Immunization Practices. MMWR Morb Mortal Wkly Rep. 2015;64:300–4. [PMC free article] [PubMed] [Google Scholar]
- 4.Centers for Disease Control and Prevention (CDC) Recommendations on the use of quadrivalent human papillomavirus vaccine in males—Advisory Committee on Immunization Practices (ACIP), 2011. MMWR Morb Mortal Wkly Rep. 2011;60:1705–8. [PubMed] [Google Scholar]
- 5.Stokley S, Jeyarajah J, Yankey D, et al. Centers for Disease Control and Prevention (CDC) Human papillomavirus vaccination coverage among adolescents, 2007–2014—United States. MMWR Morb Mortal Wkly Rep. 2014;63:620–4. [PMC free article] [PubMed] [Google Scholar]
- 6.Reagan-Steiner S, Yankey D, Jeyarajah J, et al. National, regional, state and selected local area vaccination coverage among adolescents aged 13–17 years—United States, 2015. MMWR Morb Mortal Wkly Rep. 2016;65:850–8. doi: 10.15585/mmwr.mm6533a4. [DOI] [PubMed] [Google Scholar]
- 7.Markowitz LE, Hariri S, Lin C, et al. Reduction in human papillomavirus (HPV) prevalence among young women following HPV vaccine introduction in the United States, National Health and Nutrition Examination Surveys, 2003–2010. J Infect Dis. 2013;208:385–93. doi: 10.1093/infdis/jit192. [DOI] [PubMed] [Google Scholar]
- 8.Markowitz LE, Liu G, Hariri S, Steinau M, Dunne EF, Unger ER. Prevalence of HPV after introduction of the vaccination program in the United States. Pediatrics. 2016;137:e20151968. doi: 10.1542/peds.2015-1968. [DOI] [PubMed] [Google Scholar]
- 9.Brown DR, Kjaer SK, Sigurdsson K, et al. The impact of quadrivalent human papillomavirus (HPV; types 6, 11, 16, and 18) L1 virus-like particle vaccine on infection and disease due to oncogenic nonvaccine HPV types in generally HPV-naive women aged 16–26 years. J Infect Dis. 2009;199:926–35. doi: 10.1086/597307. [DOI] [PubMed] [Google Scholar]
- 10.Wheeler CM, Castellsagué X, Garland SM, et al. HPV PATRICIA Study Group Cross-protective efficacy of HPV-16/18 AS04-adjuvanted vaccine against cervical infection and precancer caused by non-vaccine oncogenic HPV types: 4-year end-of-study analysis of the randomised, double-blind PATRICIA trial. Lancet Oncol. 2012;13:100–10. doi: 10.1016/S1470-2045(11)70287-X. [DOI] [PubMed] [Google Scholar]
- 11.Tabrizi SN, Brotherton JM, Kaldor JM, et al. Assessment of herd immunity and cross-protection after a human papillomavirus vaccination programme in Australia: a repeat cross-sectional study. Lancet Infect Dis. 2014;14:958–66. doi: 10.1016/S1473-3099(14)70841-2. [DOI] [PubMed] [Google Scholar]
- 12.Kavanagh K, Pollock KG, Potts A, et al. Introduction and sustained high coverage of the HPV bivalent vaccine leads to a reduction in prevalence of HPV 16/18 and closely related HPV types. Br J Cancer. 2014;110:2804–11. doi: 10.1038/bjc.2014.198. [DOI] [PMC free article] [PubMed] [Google Scholar]
- 13.Mesher D, Soldan K, Lehtinen M, et al. Population-level effects of human papillomavirus vaccination programs on infections with nonvaccine genotypes. Emerg Infect Dis. 2016;22:1732–40. doi: 10.3201/eid2210.160675. [DOI] [PMC free article] [PubMed] [Google Scholar]
- 14.Cameron RL, Kavanagh K, Pan J, et al. Human papillomavirus prevalence and herd immunity after introduction of vaccination program, Scotland, 2009–2013. Emerg Infect Dis. 2016;22:56–64. doi: 10.3201/eid2201.150736. [DOI] [PMC free article] [PubMed] [Google Scholar]
- 15.Curtin LR, Mohadjer L, Dohrmann S, et al. The National Health and Nutrition Examination Survey: sample design, 1999–2006. National Center for Health Statistics. Vital Health Stat. 2012;2:1–39. [PubMed] [Google Scholar]
- 16.Curtin LR, Mohadjer L, Dohrmann S, et al. The National Health and Nutrition Examination Survey: sample design, 2007–2010. National Center for Health Statistics. Vital Health Stat. 2013;2:1–23. [PubMed] [Google Scholar]
- 17.Johnson CL, Dohrmann SM, Burt VL, Mohadjer LK, et al. The National Health and Nutrition Examination Survey: sample design, 2011–2014. National Center for Health Statistics. Vital Health Stat. 2014;2:1–33. [PubMed] [Google Scholar]
- 18.Hariri S, Unger ER, Sternberg M, et al. Prevalence of genital human papilloma-virus among females in the United States, the National Health And Nutrition Examination Survey, 2003–2006. J Infect Dis. 2011;204:566–73. doi: 10.1093/infdis/jir341. [DOI] [PubMed] [Google Scholar]
- 19.Onyekwuluje JM, Steinau M, Swan DC, Unger ER. A real-time PCR assay for HPV52 detection and viral load quantification. Clin Lab. 2012;58:61–6. [PubMed] [Google Scholar]
- 20.Design and estimation for the National Health Interview Survey, 1995–2004. Vital Health Stat. 2000;2:1–31. [PubMed] [Google Scholar]
- 21.Korn EL, Graubard BI. Epidemiologic studies utilizing surveys: accounting for the sampling design. Am J Public Health. 1991;81:1166–73. doi: 10.2105/ajph.81.9.1166. [DOI] [PMC free article] [PubMed] [Google Scholar]
- 22.Bieler GS, Brown GG, Williams RL, Brogan DJ. Estimating model-adjusted risks, risk differences, and risk ratios from complex survey data. Am J Epidemiol. 2010;171:618–23. doi: 10.1093/aje/kwp440. [DOI] [PubMed] [Google Scholar]
- 23.Proctor BD, Semega JL, Kollar MA, US Census Bureau . Income and poverty in the United States: 2015. Washington, DC: US Government Printing Office; 2016. Current population reports; pp. P60–256(RV). [Google Scholar]
- 24.Hixon L, Hepler BB, Kim MO, US Census Bureau The white population: 2010. 2010 census briefs, C2010BR-05. http://census.gov/content/dam/Census/library/publications/2011/dec/c2010br-05.pdf. Accessed 12 January 2017.
- 25.Martinez GM, Abama JC. NCHS data brief, no 209. Hyattsville, MD: National Center for Health Statistics; 2015. Sexual activity, contraceptive use, and childbearing of teenagers aged 15–19 in the United States. [PubMed] [Google Scholar]
- 26.Flagg EW, Schwartz R, Weinstock H. Prevalence of anogenital warts among participants in private health plans in the United States, 2003–2010: potential impact of human papillomavirus vaccination. Am J Public Health. 2013;103:1428–35. doi: 10.2105/AJPH.2012.301182. [DOI] [PMC free article] [PubMed] [Google Scholar]
- 27.Flagg EW, Torrone EA, Weinstock H. Ecological association of human papilloma-virus vaccination with cervical dysplasia prevalence in the United States, 2007–2014. Am J Public Health. 2016;106:2211–8. doi: 10.2105/AJPH.2016.303472. [DOI] [PMC free article] [PubMed] [Google Scholar]
- 28.Kahn JA, Widdice LE, Ding L, et al. Substantial decline in vaccine-type human papillomavirus (HPV) among vaccinated young women during the first 8 years after HPV vaccine introduction in a community. Clin Infect Dis. 2016;63:1281–7. doi: 10.1093/cid/ciw533. [DOI] [PMC free article] [PubMed] [Google Scholar]
- 29.Fine P, Eames K, Heymann DL. “Herd immunity”: a rough guide. Clin Infect Dis. 2011;52:911–6. doi: 10.1093/cid/cir007. [DOI] [PubMed] [Google Scholar]
- 30.Anderson RM, May RM. Vaccination and herd immunity to infectious diseases. Nature. 1985;318:323–9. doi: 10.1038/318323a0. [DOI] [PubMed] [Google Scholar]
- 31.Kahn JA, Brown DR, Ding L, et al. Vaccine-type human papillomavirus and evidence of herd protection after vaccine introduction. Pediatrics. 2012;130:e249–56. doi: 10.1542/peds.2011-3587. [DOI] [PMC free article] [PubMed] [Google Scholar]
- 32.Gargano J, Unger ER, Liu G, et al. Prevalence of genital human papillomavirus in males, United States, 2013–2014. J Infect Dis. 2017;215:1070–9. doi: 10.1093/infdis/jix057. [DOI] [PubMed] [Google Scholar]
- 33.Paavonen J, Naud P, Salmerón J, et al. HPV PATRICIA Study Group Efficacy of human papillomavirus (HPV)-16/18 AS04-adjuvanted vaccine against cervical infection and precancer caused by oncogenic HPV types (PATRICIA): final analysis of a double-blind, randomised study in young women. Lancet. 2009;374:301–14. doi: 10.1016/S0140-6736(09)61248-4. [DOI] [PubMed] [Google Scholar]
- 34.Garland SM, Hernandez-Avila M, Wheeler CM, et al. Females United to Unilaterally Reduce Endo/Ectocervical Disease (FUTURE) I Investigators Quadrivalent vaccine against human papillomavirus to prevent anogenital diseases. N Engl J Med. 2007;356:1928–43. doi: 10.1056/NEJMoa061760. [DOI] [PubMed] [Google Scholar]
- 35.Drolet M, Bénard É, Boily MC, et al. Population-level impact and herd effects following human papillomavirus vaccination programmes: a systematic review and meta-analysis. Lancet Infect Dis. 2015;15:565–80. doi: 10.1016/S1473-3099(14)71073-4. [DOI] [PMC free article] [PubMed] [Google Scholar]
- 36.Meites E, Kempe A, Markowitz LE. Use of a 2-dose schedule for human papillomavirus vaccination—updated recommendations of the Advisory Committee on Immunization Practices. MMWR Morb Mortal Wkly Rep. 2016;65:1405–8. doi: 10.15585/mmwr.mm6549a5. [DOI] [PubMed] [Google Scholar]
Associated Data
This section collects any data citations, data availability statements, or supplementary materials included in this article.