

SUMMARY
Signaling receptors are internalized and regulated by clathrin-mediated endocytosis (CME). Two clathrin light chain isoforms, CLCa and CLCb, are integral components of the endocytic machinery whose differential functions remain unknown. We report that CLCb is specifically upregulated in non-small-cell lung cancer (NSCLC) cells and is associated with poor patient prognosis. Engineered single CLCb-expressing NSCLC cells, as well as “switched” cells that predominantly express CLCb, exhibit increased rates of CME and altered clathrin-coated pit dynamics. This “adaptive CME” resulted from upregulation of dynamin-1 (Dyn1) and its activation through a positive feedback loop involving enhanced epidermal growth factor (EGF)-dependent Akt/GSK3β phosphorylation. CLCb/Dyn1-dependent adaptive CME selectively altered EGF receptor trafficking, enhanced cell migration in vitro, and increased the metastatic efficiency of NSCLC cells in vivo. We define molecular mechanisms for adaptive CME in cancer cells and a role for the reciprocal crosstalk between signaling and CME in cancer progression.
In Brief
Signaling downstream of receptor tyrosine kinases is regulated by their trafficking. Chen et al. show that isoform-specific upregulation of clathrin light chain b and dynamin-1 in cancer cells, coupled to reciprocal crosstalk with Akt/ GSK3β signaling, leads to adaptive clathrin-mediated endocytosis that alters EGFR trafficking and signaling and increases metastasis.
INTRODUCTION
Many properties of the aggressive cancer cell (i.e., proliferation, angiogenesis, survival, and migration) are driven by altered signaling downstream of receptor tyrosine kinases (RTKs). Endocytic trafficking of RTKs can either inhibit or enhance their signaling, typically dependent on sorting in endosomal compartments (Barbieri et al., 2016; Di Fiore and von Zastrow, 2014; McMahon and Boucrot, 2011). In cancer cells, RTK signaling can be altered by changes in endocytic trafficking that either enhance receptor recycling from early “signaling” endosomes or inhibit their targeting to degradative lysosomes (Mellman and Yarden, 2013; Paul et al., 2015; Sigismund et al., 2012). In addition, oncogenic mutations in epidermal growth factor receptor (EGFR) and cMet, which are the predominant oncogenic RTKs in non-small-cell lung cancer (NSCLC), prevent their degradation and enhance recycling (Joffre et al., 2011; Shtiegman et al., 2007; Tomas et al., 2014).
CME is the major pathway for uptake of RTKs (Barbieri et al., 2016; Di Fiore and von Zastrow, 2014; McMahon and Boucrot, 2011). Once thought to be a constitutive process, more recent studies have shown that CME can be regulated (Di Fiore and von Zastrow, 2014; Loerke et al., 2009; Reis et al., 2015). Although there are many reports of altered trafficking post CME, whether and how CME itself is altered during cancer cell progression has been less studied.
Clathrin, the major coat protein, functions together with numerous endocytic accessory proteins to spatially and temporally regulate CME (Merrifield and Kaksonen, 2014; Mettlen et al., 2009). Clathrin-coated vesicles (CCVs) with their concentrated cargo/receptors pinch off from the plasma membrane by the scission activity of dynamin (Dyn), a guanosine triphosphatase that is also involved in early stages of CME (Ferguson and De Camilli, 2012; Mettlen et al., 2009; Schmid and Frolov, 2011). Vertebrates express three dynamin isoforms: Dyn2 is ubiquitously expressed, whereas Dyn1 and Dyn3 exhibit tissue specific expression (Cao et al., 1998; Urrutia et al., 1997). Dyn1, a phosphoprotein previously assumed to be neuron specific (Clayton et al., 2010), is upregulated in a number of cancers (Haferlach et al., 2010; Hong et al., 2010) and was recently shown to be activated downstream of Akt/GSK3β signaling to modulate CME in H1299 NSCLC cells (Reis et al., 2015). Dyn1 activation in non-neuronal cells regulates CME by increasing the rates of clathrin-coated pit (CCP) initiation and altering CCP maturation (Reis et al., 2015). Interestingly, a pathway-based gene signature analysis showed that altered expression of genes involved in CME (e.g., AP2, eps15, DAB2, HIP1, PICALM) strongly correlates with poor prognosis of lung adenocarcinoma (Chang et al., 2015). Altered regulation of CME in cancer cells, which we refer to as “adaptive” CME, could alter RTK trafficking and signaling to drive cancer progression.
Clathrin triskelia are composed of three clathrin heavy chains (CHC) and three clathrin light chains (CLC) (Brodsky, 2012; Kirchhausen and Toyoda, 1993), which are reported to be randomly distributed among triskelia (Kirchhausen et al., 1983). Vertebrates express two CLC isoforms, CLCa and CLCb, with unknown functional differences (Acton and Brodsky, 1990). The two CLC isoforms share 60% amino acid sequence identity and are expressed in different proportions in different cell types (Brodsky, 2012). In addition to their structural role in stabilizing clathrin triskelia, CLCs share functions in regulating HSC70, the uncoating ATPase, to disassemble clathrin cages (Schmid et al., 1984; Young et al., 2013), and interacting with HIP1 to link CCVs to the actin cytoskeleton (Chen and Brodsky, 2005; Legendre-Guillemin et al., 2005). A recent study showed that CLCs also modulate a gyrating clathrin structure that mediates the rapid recycling of transferrin receptors (TfnRs) and β1-integrin (Majeed et al., 2014) from early endosomes. Identifying CLC isoform-specific functions has been difficult given their apparently random association with triskelia (Kirchhausen et al., 1983) and substoichiometry with CHC in non-neuronal cells (Borner et al., 2012; Girard et al., 2005). Moreover, small interfering RNA (siRNA)-mediated knockdown of CLCb is often compensated by increased expression of CLCa, whereas knockdown of CLCa is often accompanied by decreases in CHC expression (Majeed et al., 2014).
We noted that CLCb, but not CLCa, is preferentially upregulated in NSCLC. Therefore, to elucidate functional differences between CLCa and CLCb that might contribute to adaptive CME in cancer, we generated single CLC isoform-expressing NSCLC cells, as well as H1299 cells with upregulated CLCb expression, and analyzed the effects on CME, EGFR trafficking, cell migration, and metastasis. Our studies revealed an isoform-specific role for CLCb in adaptive CME, leading to altered EGFR trafficking and signaling in a Dyn1-dependent manner. Upregulation of CLCb in H1299 cells leads to enhanced metastatic activity in a mouse model, supporting a role for CLCb/Dyn1-dependent adaptive CME in cancer progression.
RESULTS
CLCb Expression Is Increased in NSCLC
Previous studies have reported that CLCa is the predominant isoform in most tissues, whereas CLCb predominates in cells with high secretory activities (Acton and Brodsky, 1990) and in migratory trophoblasts (Majeed et al., 2014). These data suggest isoform-specific roles related to cell physiology. Analysis of the NCI 60 proteome data (http://129.187.44.58:7070/NCI60/) revealed that CLCb protein levels vary markedly across cells derived from different types of cancers (Figure 1A), whereas CLCa levels are more uniform (Figure S1A) (Gholami et al., 2013). This result is consistent with increased staining of CLCb in numerous types of cancers relative to normal tissue in the Human Protein Atlas (www.proteinatlas.org/ENSG00000175416-CLTB/cancer). We confirmed by immunohistochemical (IHC) staining of tissue microarrays that CLCb expression is increased in NSCLCs compared with normal lung tissue. Moreover, CLCb expression levels positively correlated with more aggressive tumor stages and metastases (Figure 1B). CLCa expression also appeared to increase in late-stage and metastatic tumors, but to a much lesser degree (Figure S1B). We confirmed that higher levels of CLCb protein expressions correspond to higher levels of mRNA by western blotting of NCI 60 NSCLC cell lines with high CLCb mRNA levels (e.g., H522, H226, and EKVX cells) compared with A549 cells, a cell line with lower CLCb mRNA (Figures 1C and S1C). H1299 cells, a widely used NSCLC cell line with rapid migratory ability, also expressed higher CLCb protein compared with A549 cells (Figure 1C). In contrast, the protein levels of CLCa, which are more subject to post-translational control (Acton and Brodsky, 1990), did not correlate well with the mRNA levels, and CLCa was uniformly expressed in these NSCLC cell lines (Figures 1C and S1C). The differential expression of CLCs in NSCLC motivated us to test for CLC isoform-specific functions in CME.
Figure 1. CLCb Is Upregulated in NSCLC.

(A) Protein levels of CLCb in NCI 60 cell lines (http://129.187.44.58:7070/NCI60/protein/show/3943).
(B) Images of low and high immunohistochemistry (IHC) of CLCb levels in representative tumor tissues. Scale bar, 50 µm. Quantification of CLCb expression according to low and high IHC levels in normal (n = 15), stage I tumor (I, n = 23), stage II tumor (II, n = 14), stage III tumor (III, n = 13) and metastatic tumor tissues (n = 10).
(C) Representative western blot of CLCs in H1299, A549, H522, H226, and EKVX cells.
Differential Rates of CME, CCP Initiation, and Maturation in Single CLCa- versus CLCb-Expressing Cells
Previous attempts to study differential functions of CLC isoforms by siRNA-mediated knockdown were plagued by compensating changes in expression levels of the other isoform and/or destabilization of CHC, thereby complicating interpretation. Therefore, to more directly test for potential differences of CLC isoform functions, we applied CRISPR/Cas9 technology coupled to retroviral-mediated expression to knock out one isoform and then used FACS (fluorescence-activated cell sorting) to select for cells expressing saturating levels of the second (see STAR Methods). In this way we established single CLCa and single CLCb cells (sCLCa and sCLCb, respectively) in two commonly used NSCLC cell lines, H1299 cells (Figure 2A) and A549 cells (Figure S2A).
Figure 2. Differential Rates of CME, CCP Initiation, and Maturation in Single CLCa- versus CLCb-Expressing Cells.

(A) Representative western blot of CLCs and CHC in parental H1299 cells and single CLC H1299 cells engineered to express saturating levels of either CLCa (sCLCa) or CLCb (sCLCb).
(B) The CLC binding to CHC was examined by immunoprecipitation of CHC followed by western blotting using CHC or CLC antibodies. One hundred percent of input and immunoprecipitated pellets were loaded.
(C) Endocytosis and recycling of TfnR were measured in parental, sCLCa, and sCLCb H1299 cells. Percentage of internalized TfnR was calculated relative to the initial surface TfnR. Percentage of recycled biotinylated-Tfn was calculated relative to the initial loading (10 min).
(D) Endocytosis and recycling of biotinylated EGF (20 ng/mL) were measured in parental, sCLCa, and sCLCb H1299 cells. Percentage of internalized biotinylated EGF was calculated relative to the initial surface bound. Percentage of recycled biotinylated EGF was calculated relative to the initial loading (10 min).
(E) Average CCP lifetime distribution in sCLCa and sCLCb H1299 cells.
(F) Rate of initiation (# CCP/µ2/min) of bona fide CCPs in sCLCa (0.088 ± 0.006 CCP/µm2/min) and sCLCb (0.151 ± 0.010 CCP/µm2/min) H1299 cells.
Data in (C) and (D) are presented as mean ± SEM, n = 3. Data in (E) and (F) are from n = 3 independent experiments, 20 cells in total. Statistical significance was analyzed by Student’s t test (**p < 0.05, ***p < 0.01).
As an engineered model system, single CLCa and CLCb cell lines are useful tools to unambiguously distinguish the differential effects of CLC isoforms. We selected sCLCa and sCLCb cells with similar CLC and CHC expression levels (Figures 2A and S2A). We also verified by co-immunoprecipitation with CHC that both CLC isoforms bound to an equal extent to CHC, with no significant differences compared with parental cells expressing both isoforms (Figure 2B), indicating that expression of only one isoform does not affect clathrin triskelion stability. Interestingly, despite efficient precipitation of CHC, only a fraction of CLC co-precipitated, suggesting that in these cells CLCs might be expressed in excess of CHC, and thus that, in these cells, CHC is fully occupied by CLCs, as previously suggested (Hoffman et al., 2010).
We first looked for differential effects of CLCa and CLCb on the endocytosis and recycling of TfnRs, an archetypical CME marker, in single CLC cells. TfnR endocytosis was accelerated in sCLCb H1299 relative to parental and sCLCa H1299 cells (Figure 2C). The same was true for sCLCb A549 cells (Figure S2B). There were no differences in the rates of TfnR recycling (Figures 2C and S2C). The increase of TfnR endocytosis is mostly manifested between 5 and 10 min, which is likely the result of low signal-to-noise ratio and poor sensitivity in biochemical uptake assay at early time points. These data indicate that TfnR endocytosis is differentially regulated in sCLCb-expressing cells.
Aberrant EGFR signaling contributes to oncogenesis and is crucial in NSCLC progression and drug resistance (Arteaga and Engelman, 2014). The differential effects of CLC isoforms on CME prompted us to examine the effect of CLCs on EGFR endocytosis and recycling in single CLC cells. Unlike the TfnR, both endocytosis and recycling of EGFRs were accelerated in sCLCb H1299 relative to parental and sCLCa H1299 (Figure 2D). Similar results were obtained with sCLCa and sCLCb A549 cells (Figures S2B and S2C). Thus, early endocytic trafficking of EGFRs is differentially regulated in sCLCb-expressing cells.
CLCs regulate clathrin lattice assembly (Wilbur et al., 2010) and thereby likely influence CME efficiency. Given that the increased endocytosis in sCLCb cells might be a consequence of altered CCP dynamics, we established H1299 and A549 cell lines expressing single CLCa/b fused N-terminally to EGFP (Figures S2D and S2E). These cells were then imaged by total internal reflection fluorescence microscopy (TIR-FM), followed by computer-based image analysis (Aguet et al., 2013; Loerke et al., 2009; Mettlen et al., 2009). Single CLCa cells showed a broad CCP lifetime distribution (Figures 2E and S2F), indicative of a multi-step regulated process (Aguet et al., 2013; Reis et al., 2015). However, sCLCb cells displayed a quasi-exponential decay curve, indicative of altered regulation and more rapid maturation of CCPs. The rate of CCP initiation events was also significantly increased in sCLCb cells relative to sCLCa cells (Figures 2F and S2G). These data indicate that CCP initiation and maturation are differentially regulated in sCLCb-expressing cells, leading to accelerated rates of CME.
CLCb Upregulation Alters EGFR Trafficking in a Dyn1-Dependent Manner
Although sCLCa- and sCLCb-expressing cells are optimal for revealing differences in CME, most cells express both CLC isoforms, albeit at different ratios (Acton and Brodsky, 1990). Therefore, to study the consequences of upregulation of CLCb in a more physiological context, we generated “switched” CLCb (swCLCb) H1299 cells by retroviral expression of CLCb and FACS sorting in parental H1299 cells (see STAR Methods). We selected cells expressing similar total levels of CLCs and CHCs compared with parental cells. In these cells, overexpression of CLCb resulted in downregulation of CLCa so that CLCb became the predominant isoform (the ratio of CLCa to CLCb is approximately 60:40 in parental H1299 cells and 30:70 in swCLCb cells) (Figure 3A). We confirmed by co-immunoprecipitation with CHC that the CLC isoforms were equally incorporated into triskelia in both parental and swCLCb H1299 cells (Figure 3B). As observed for sCLCb cells, swCLCb cells also exhibited higher rates of EGFR endocytosis and recycling than parental H1299 cells (Figure 3C).
Figure 3. CLCb Upregulation Alters EGFR Trafficking in a Dynamin-1-Dependent Manner.

(A) Representative western blot of CLCs and CHC in parental and H1299 cells overexpressing CLCb to switch CLC isoform distribution (swCLCb).
(B) CLC binding to CHC was examined by immunoprecipitation of CHC followed by western blotting using CHC or CLC antibodies. One hundred percent of input and immunoprecipitated pellets were loaded.
(C) Endocytosis and recycling (10-min pulse) of biotinylated EGF measured in parental, swCLCb, D1KO, and D1KO/swCLCb H1299 cells. Percentage of internalized biotinylated EGF relative to the initial surface binding is shown. Percentage of recycled biotinylated EGF was calculated relative to the initial loading (10 min).
(D and E) Endocytosis (D) and recycling (E) of biotinylated EGF (20 ng/mL) were measured in control and CLCb siRNA-treated H226 and EKVX cells, as described in (C).
(F) Surface levels of EGFR in control and CLCb siRNA-treated H226 and EKVX cells.
(G) Representative western blots of CLCb knockdown efficiency in control and CLCb siRNA-treated H226 and EKVX cells.
(H) Representative western blot of Dyn1 and Dyn2 expression in parental and swCLCb H1299 cells.
Data in (C)–(F) are presented as mean ± SEM, n = 3. Statistical significance was analyzed by Student’s t test (*p < 0.1, **p < 0.05, ***p < 0.01; n.s., not significant).
We also performed the reciprocal experiments by siRNA-mediated knockdown of CLCb in H226 and EKVX NSCLC cell lines that express high levels of CLCb. As predicted, siRNA-mediated depletion of CLCb in these cells decreased their rate of EGFR endocytosis and recycling (Figures 3D–3G).
The increased rates of CME and altered CCP dynamics seen in sCLCb and swCLCb cells were reminiscent of our previous finding that activation of Dyn1 in non-neuronal cells accelerated CME by altering CCP initiation and maturation rates (Reis et al., 2015). Surprisingly, we observed increased levels of Dyn1 expression in swCLCb cells (Figure 3H), which was even more dramatic in sCLCb cells (Figure S3A) compared with parental H1299 or A549 cells. In contrast, sCLCa cells showed reduced levels of Dyn1 expression relative to parental controls (Figure S3A). The activity of Dyn1 can be modulated by changing expression levels or by phosphorylation at Ser774 by GSK3β, which inhibits Dyn1 activity (Clayton et al., 2010; Reis et al., 2015). We examined the levels of Dyn1 expression and the degree of phosphorylation on Ser774 in the NSCLC cell lines we used. Most NSCLC cells expressed relatively high levels of Dyn1 and showed less phosphorylation at serine 774 (Figure S3B), consistent with increased Dyn1 activity.
To test whether the stimulatory effects of CLCb on early trafficking of EGFR were Dyn1 dependent, we generated Dyn1 knockout (KO)/CLCb switched (Dyn1 KO/swCLCb) H1299 cells by retroviral expression of CLCb in Dyn1 KO H1299 cells (Figure S4A). The accelerated endocytosis and recycling of EGFR in swCLCb cells were both dependent on Dyn1 expression, as these changes were abrogated in Dyn1 KO cells (Figure 3C).
CLCb Upregulation Increased Akt/GSK3β Phosphorylation, Leading to Altered EGFR Trafficking
We previously showed that Dyn1 is activated downstream of an Akt/GSK3β kinase cascade in non-neuronal cells (Reis et al., 2015). GSK3β phosphorylates and inactivates Dyn1, and GSK3β, in turn, is phosphorylated and inactivated by Akt (Clayton et al., 2010; Liberali et al., 2014; Reis et al., 2015). Therefore, we examined the effect of CLCb expression on Akt/GSK3β phosphorylation, which might activate Dyn1. EGF treatment induced prolonged and stronger Akt and GSK3β phosphorylation in swCLCb cells compared with parental H1299 cells (Figures 4A, S4B, and S4C). In contrast, ERK and TSC2 phosphorylation were unaffected (Figures S4B and S4C). Together these data suggest that signaling downstream of EGFR might activate Dyn1 through an Akt/GSK3β kinase cascade to alter its endocytosis and recycling in swCLCb cells. We tested this by treating swCLCb H1299 cells with a specific Akt inhibitor (Akt inhibitor X). As predicted, Akt inhibition reversed the increased rates of endocytosis and recycling of EGFR to levels similar to those in solvent control and Akt inhibitor-treated parental H1299 cells (Figure 4B).
Figure 4. CLCb Upregulation Increased Akt/GSK3β Phosphorylation, Leading to Altered EGFR Trafficking.

(A) Quantification of the extent of Akt (Ser473) and GSK3β (Ser9) phosphorylation at the indicated times after treatment of parental or swCLCb H1299 cells with EGF (20 ng/mL).
(B) Endocytosis and recycling of biotinylated EGF in parental and swCLCb H1299 cells with or without treatment with the specific Akt inhibitor, X (10 µM).
(C) Quantification of Akt (Ser473) and GSK3β (Ser9) phosphorylation in parental, swCLCb, Dyn1KO, and Dyn1KO/swCLCb H1299 cells 10 min after addition of EGF (20 ng/mL).
Values are presented as mean ± SEM, n = 3. Statistical significance was analyzed by Student’s t test (*p < 0.1, **p < 0.05, ***p < 0.01; n.s., not significant).
We next tested the role of Dyn1 in altered Akt/GSK3β signaling in swCLCb cells. Interestingly, the increased Akt and GSK3β phosphorylation observed in swCLCb cells was abrogated in Dyn1 KO cells (Figures 4C, S4B, and S4C), whereas ERK and TSC2 phosphorylation were unaffected (Figures S4B and S4C). Surface levels of EGFR did not significantly change in any of the cells we tested, indicating that the increased Akt/GSK3β phosphorylation was not a consequence of altered surface EGFR (Figure S4D). Thus, Dyn1 is both upstream and downstream of Akt activation, creating a positive feedback loop. From this we conclude that CLCb-dependent alterations in early endocytic trafficking of EGFRs are a consequence of a reciprocal crosstalk between signaling and altered endocytosis.
An Increase in APPL1-Positive Endosomes in swCLCb Cells Leads to Increased Akt/GSK3β Phosphorylation
APPL1 (adaptor protein, phosphotyrosine interacting with PH domain and leucine zipper 1) was identified as an early endosome-associated, Akt-interacting partner in a yeast two-hybrid screen (Mitsuuchi et al., 1999). APPL1 orchestrates the activation and substrate specificity of Akt to modulate GSK3β, but not TSC2 phosphorylation (Cheng et al., 2009; Schenck et al., 2008). Therefore, we next examined the expression and distribution of APPL1 by western blotting and immunofluorescence (IF) staining. Although there was no detectable change in APPL1 protein levels (Figure S5A), IF staining revealed that the number of peripheral APPL1-positive endosomes (Figure 5A), but not APPL1 staining intensity per endosome (Figure S5B), was increased in swCLCb H1299 cells relative to parental H1299 cells. Thus, upregulation of CLCb appears to alter trafficking through and/or maturation/expansion of APPL1 endosomes to contribute to increased Akt/GSK3β phosphorylation.
Figure 5. An Increase in APPL1-Positive Endosomes in swCLCb Cells Leads to Increased Akt/GSK3β Phosphorylation.

(A) Representative IF staining image and quantification of APPL1-positive endosomes in parental and swCLCb H1299 cells. Scale bar, 10 µm.
(B) Quantification of effect of siRNA-mediated knockdown of APPL1 on phosphorylation of Akt (Ser473) and GSK3β (Ser9) in response to treatment with EGF (20 ng/mL) in parental and swCLCb H1299 cells. Controls were transfected with a non-specific siRNA. Values are presented as mean ± SEM, n = 3.
(C) Representative IF staining image and quantification of APPL1-positive endosomes in Dyn1 KO and Dyn1 KO/swCLCb H1299 cells. Scale bar, 10 µm.
Values are presented as mean ± SEM, n = 20 cells. Statistical significance was analyzed by Student’s t test (***p < 0.01; n.s., not significant).
We next tested whether APPL1 is required for Akt/GSK3β phosphorylation in swCLCb H1299 cells. siRNA-mediated knockdown of APPL1 in swCLCb H1299 cells reversed the EGF-dependent increase in Akt and GSK3β phosphorylation to levels similar to those in control siRNA-treated H1299 cells (Figures 5B, S5C, and S5D). In contrast, APPL1 depletion did not alter Akt and GSK3β phosphorylation in control siRNA-treated parental H1299 cells (Figures 5B, S5C, and S5D). Taken together, these data indicate that upregulation of CLCb increases the number of APPL1-positive endosomes to selectively enhance Akt/GSK3β phosphorylation.
Reciprocally, we also verified the effect of CLCb on APPL1 endosomes in H226 and EKVX cells. Thus, siRNA-mediated knockdown of CLCb in both cells reduced the number of APPL1-positive endosomes (Figures S5E and S5F).
Finally, we found that the increase in peripheral APPL1 endosomes induced by upregulation of CLCb was also suppressed in the Dyn1 KO H1299 cells (Figure 5C). Together, these data suggest that upregulated CLCb accelerates EGFR endocytosis and recycling in a Dyn1-dependent manner, which prolongs Akt signaling from APPL1-positive endosomes to further activate Dyn1 in a positive feedback loop that reflects crosstalk between signaling and endocytic trafficking.
Upregulation of CLCb Enhances Cancer Cell Migration and Metastasis
Previous microarray and tissue expression analysis suggested a role for CLCb in invasive villous trophoblast cell migration (Majeed et al., 2014). Since EGF modulates both cell proliferation and migration, we tested whether CLCb upregulation might alter EGF-dependent cell migration. Epithelial cells tend to form multi-cellular foci in two-dimensional culture; however, compared with parental and sCLCa H1299 cells, we observed increased scattering in sCLCb H1299 cells (Figure S6A). Hence, we examined the effect of CLCb on cell migration by scattering assays in the presence of EGF. In response to EGF, swCLCb H1299 cells showed increased speed of migration (Figure 6A) compared with parental H1299, whereas the scattering directionality did not change (Figures 6A and S6B). The CLCb-dependent, increased migration phenotypes were abolished in Dyn1 KO/swCLCb H1299 cells (Figure 6A).
Figure 6. Upregulation of CLCb Enhances Cancer Cell Migration and Metastasis.

(A) Average migration speed and directionality of EGF-treated (20 ng/mL) parental, swCLCb, D1KO, and D1KO/swCLCb H1299 cells.
(B) Representative gross view of lungs from mice euthanized 8 weeks after injection of parental and swCLCb H1299 cells into the left lung. Yellow arrows indicate tumor nodules on orthogonal, right lung. Scale bar, 1 cm.
(C) Average number of metastatic tumor nodules developed in right lung lobes from mice euthanized 8 weeks after orthogonal lung injection.
(D) Representative H&E-stained histological image of metastatic nodules on right lungs from mice receiving swCLCb H1299 cells. Yellow arrow indicates tumor site. Scale bar, 100 µm.
Values in (A) and (C) are mean ± SEM, n = 6 mice. Statistical significance was analyzed by Student’s t test (*p < 0.1, **p < 0.05).
Increased recycling of EGFR was shown to enhance cancer cell migration, invasion, and metastasis (Ben-Chetrit et al., 2015; Muller et al., 2009). The increased migration and altered EGFR trafficking in swCLCb cells prompted us to evaluate the effect of CLCb upregulation on metastasis in vivo using an orthotopic lung cancer model (Onn et al., 2003). Tumor cells were injected into the left lung, and the tumor nodules formed on the right lung were counted as a measure of metastatic ability. Strikingly, the number of metastatic nodules formed on the right lung in mice receiving swCLCb H1299 cells was 2-fold higher than in mice receiving parental H1299 cells (Figures 6B and 6C). Although highly metastatic, the swCLCb cells formed much smaller primary tumors on the left lung compared with mice receiving parental H1299 cells (Figures 6B, 6D, and S6C). The lack of correlation between primary tumor size and metastatic potential has also been reported for lung metastasis of rat mammary adenocarcinoma cells (Wyckoff et al., 2000) as well as for human colon cancers (Matsuda et al., 2009). Altogether, these data indicate that CLCb upregulation in NSCLC cells increases their migration and metastatic ability.
High CLCb and Dyn1 Expression Correlates with Poor Survival in Patients
Growing evidence suggests that altered endosomal sorting can profoundly affect cancer cell behavior and aggressiveness (Mellman and Yarden, 2013). Changes in the expression of endosomal markers can have prognostic value in prostate cancers (Johnson et al., 2015). Here, we have shown that adaptive CME in NSCLC cells, resulting from upregulation of CLCb, increases cell migration and metastasis through a Dyn1-dependent mechanism. Metastasis is the major cause of cancer-induced death. Therefore, we examined the relationship of upregulation of CLCb and Dyn1 to survival by mining lung cancer patient data from the Kaplan-Meier plotter database (Gyorffy et al., 2013). Patients with relatively high CLCb expression had significantly worse survival rates than those in the low-expression group (Figure 7A). The same was true for patients in the high-Dyn1-expression group relative to those in the low-expression group (Figure 7B). In contrast, there were no significant differences in survival rates between high- and low-expression groups for either CLCa, Dyn2, or Dyn3 (Figure S7A). We further stratified the patients according to their tumor stages before performing the survival analysis. Patients in stage I with high CLCb or Dyn1 expression had significantly poorer survival rates than those in the low-expression group (Figures S7B and S7C). However, we could not detect the same correlation in stage II–III patients, which could reflect the lower sample number in late tumor stages. High expression of early-stage-associated metastatic genes, such as MALAT-1 (Metastasis associated in lung adenocarcinoma transcript 1), has been reported to correlate well with NSCLC metastasis and prognosis (Ji et al., 2003). The above clinical data suggest that upregulation of either CLCb or Dyn1 are risk factors in early-stage NSCLC patients. Our data provide mechanistic insight into these isoform-specific effects on cancer aggressiveness and suggest that selective upregulation of CLCb and Dyn1 contributes to adaptive CME and altered signaling downstream of RTKs.
Figure 7. CLCb and Dyn1 are Predicted as High-Risk Factors in NSCLC.

(A and B) Kaplan-Meier survival analysis of NSCLC patients was performed in CLCb (A) and Dyn1 (B) high- and low-expression cohorts.
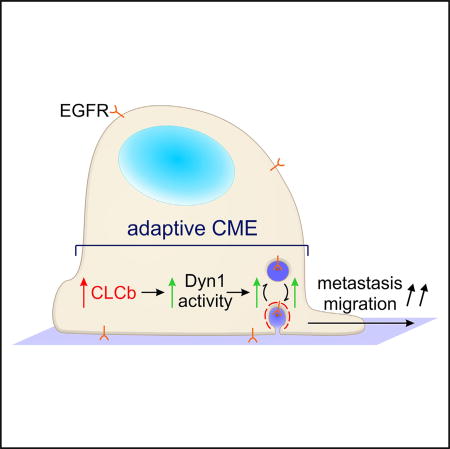
(C) Model of CLCb/Dyn1-dependent adaptive CME. Upregulation of CLCb leads to increased activation of Dyn1 through a positive feedback loop involving APPL1-positive endosomes and increased Akt/ GSK3β phosphorylation. Prolonged Akt signaling from APPL1-positive endosomes activates Dyn1 that contributes to abnormal EGFR trafficking and signaling, leading to increased migration and metastasis.
DISCUSSION
The intimate relationship between signaling and endocytic membrane trafficking contributes to a complex network modulating diverse biological functions (Palfy et al., 2012; Sorkin and von Zastrow, 2009). This is especially relevant to cancer biology, where increasing evidence points to cancer-specific adaptations in endocytic trafficking that affect signaling, cell survival, proliferation, polarity, and migration (Mellman and Yarden, 2013; Mosesson et al., 2008), thereby contributing to cancer progression (Parachoniak and Park, 2012). Here we show that NSCLC cells upregulate normally synapse-enriched isoforms, CLCb and Dyn1, which exhibit isoform-specific functions that alter CME, early endosomal trafficking, and EGFR signaling. This “adaptive” CME in H1299 NSCLC cells overexpressing CLCb contributes to increased metastatic activity. This study, together with our previous finding that Dyn1 is activated downstream of Akt in H1299 NSCLC cells to alter CME (Reis et al., 2015), strongly supports the concept of adaptive CME and suggests that Dyn1 is a key protein mediating reciprocal regulation of signaling and CME in cancer cells. Moreover, our finding of increased metastatic activity resulting from CLCb/Dyn1-dependent adaptive CME supports its role in cancer progression.
Proteomic analyses and IHC provide evidence for the upregulation of CLCb and Dyn1 in cancer cells and tumors. Moreover, high levels of Dyn1 and CLCb expression correlate with reduced survival rates in human lung cancer patients. Together these results suggest that our findings have relevance to cancer progression. However, we were unable to demonstrate a correlation between CLCb expression and Dyn1 expression, at least at the mRNA level. This is in part a reflection of the fact that Dyn1 activity can be regulated either by changes in expression levels or changes in phosphorylation or dephosphorylation. It might also reflect the fact that Dyn1 is downstream of CLCb and can affect CME independently of changes in CLCb expression.
Previous studies, primarily based on siRNA knockdown, failed to identify functional differences between CLC isoforms. These negative results are, in part, due to their considerable homology and functional overlap (Ferreira et al., 2012; Majeed et al., 2014), but also to compensatory upregulation of the alternative CLC and/or destabilization of CHC, which obscured functional differences. We took an alternative approach by engineering single CLCa or CLCb cells that express equal levels of the CLC isoforms and, importantly, CHC, thus maximizing opportunities to detect functional differences. Using this approach we observed pronounced differences between sCLCa and sCLCb cells in the rates of initiation and maturation of CCPs, leading to altered rates of CME. We also found that EGFR, but not TfnR recycling, was increased in sCLCb and swCLCb cells, which might suggest a preferential role for CLCb in the rapid, gyrating clathrin-dependent recycling previously shown to be CLC dependent (Majeed et al., 2014). Our findings that APPL1-positive endosomes accumulate in swCLCb cells suggest a role for this subpopulation of signaling endosomes in the rapid recycling of RTKs. Interestingly, cancer cell-specific mechanisms have been reported to alter recycling of β-integrin and EGFR without affecting TfnR (Caswell et al., 2009).
Unexpectedly, we also observed an increase in expression of Dyn1 in both sCLCb and swCLCb cells, which we showed could account for the changes in CME activities. Importantly, the activity of Dyn1 can be regulated by changing expression levels or phosphorylation, dephosphorylation, or both. We previously showed that Dyn1 was activated in cells that were severely defective in CCP maturation due to a deletion mutation in the a subunit of AP2 (Aguet et al., 2013). In this case, while expression levels did not change, Dyn1 was activated downstream of Akt/ GSK3β as part of a compensatory mechanism to rescue perturbed CME (Reis et al., 2015). Thus, one interpretation is that the upregulation and/or increased activation of Dyn1 in sCLC or swCLCb cells occurs in response to a general perturbation of CME due to either loss of CLCa or gain of CLCb functions, or both. In addition, because we can detect free CLCs in H1299 cells, we cannot exclude the possibility of an, as yet, unknown isoform-specific function for free CLCs. Alternatively, we note that Dyn1 and CLCb are predominant isoforms in neuronal and neuroendocrine cells that undergo rapid stimulated endocytosis after regulated secretion. Thus, Dyn1 and CLCb may have selective functions in regulating “adaptive” CME and signaling. While much more work is needed to identify the defect and/or alterations in CME resulting from the selective loss of CLCa and/or the sole expression of CLCb, our data clearly reveal functional differences between the two isoforms. More detailed biochemical and structural analyses of the sCLCa and sCLCb cells will be needed to elucidate these functional differences.
The increased rates of CME in swCLCb cells correlated with increased numbers of APPL1-positive endosomes and increased Akt/GSK3β phosphorylation, both of which were shown to activate Dyn1 in non-neuronal, retinal pigment epithelial cells (Reis et al., 2015). In turn, the increase in APPL1 endosomes seen in swCLCb cells depends on Dyn1 expression. These data point to a positive feedback loop resulting from the crosstalk between signaling and early endocytic trafficking and impinging on Dyn1 activity. APPL1, a Rab5 effector, labels a sub-population of Rab5-positive signaling and sorting endosomes that can be regulated by EGFR through Grb2 (Kalaidzidis et al., 2015; Martinu et al., 2002; Miaczynska et al., 2004; Schenck et al., 2008). Grb2 interacts with dynamin’s proline/arginine-rich domain (Solomaha et al., 2005). Interestingly, recent data have suggested that a tri-gene signature of high levels of expression of the early endosomal markers APPL1, EEA1, and rab5 strongly correlates with reduced survival in prostate cancer patients (Johnson et al., 2015).
Together our findings suggest that in addition to alterations in endosomal sorting, changes in expression and/or activity of key components of the CME machinery can result in adaptive CME in cancer cells (Figure 7C). We also provide evidence for a positive feedback loop involving Akt/GSK3β signaling downstream of EGFR and APPL1-positive endosomes that acts through Dyn1 to alter EGFR trafficking and signaling (Figure 7C). Our results provide direct evidence for CLCb isoform-specific functions and identify the isoform-specific activation of Dyn1 as a mechanism for adaptive CME in cancer cells. Finally, we show that CLCb/Dyn1-dependent adaptive CME enhances the metastatic activity of H1299 cells, and hence may be a potential new therapeutic target.
STAR★METHODS
Detailed methods are provided in the online version of this paper and include the following:
- ●
-
●
CONTACT FOR REAGENT AND RESOURCE SHARING
-
●
EXPERIMENTAL MODEL AND SUBJECT DETAILS
-
○
Orthotopic Tumor Implantation
-
○
-
●
METHOD DETAILS
-
○
Cell Culture
-
○
Cell Engineering
-
○
Immunohistochemical Analysis
-
○
siRNA and Plasmids Transfection
-
○
Cell Scattering and Migration Assay
-
○
TIR-FM
-
○
Endocytosis Assay
-
○
Recycling Assay
-
○
Microarray Data Analysis
-
○
-
●
QUANTIFICATION AND STATISTICAL ANALYSIS
-
○
Analysis of IHC Staining Data
-
○
Analysis of Endocytosis and Recycling Data
-
○
Analysis of CCP Dynamics and Initiation Data (Live Cell TIR-FM)
-
○
Analysis of Western Blot Data
-
○
Analysis of APPL1 Positive Endosome Immunofluorescence Staining Data
-
○
Analysis of Cell Migration Speed and Directionality Data
-
○
Analysis of Orthotopic Tumor Metastasis Data
-
○
Analysis of NCI60 Microarray and Proteome Data and Kaplan-Meier Survival Data
-
○
KEY RESOURCES TABLE
| Reagent or Resource | Source | Identifier |
|---|---|---|
| Antibodies | ||
| TfnR | Schmid and Smythe (1991) | HTR-D65 |
| CLCa | Sigma; The Human Protein Atlas http://www.proteinatlas.org/ENSG00000122705-CLTA/cancer | Cat#HPA050918 (Sigma) |
| CLCb | Abnova; The Human Protein Atlas http://www.proteinatlas.org/ENSG00000175416-CLTB/cancer | Cat# H00001212-M01; RRID: AB_425372 |
| CLC | Rabbit antibody (Homemade) against CLC peptide (a.a.23–40, CEEDPAAAFLAQQESEIAG)-KLH conjugation | |
| CHC | Millpore, clone 6F10.1 | Cat#MABC580 |
| Dyn1 | Abcam | Cat#ab52852; RRID: AB_869530 |
| Dyn1 phospho-Ser 774 | Abcam | Cat#ab55324; RRID: AB_879828 |
| Dyn2 | Santa Cruz (C18) | Cat#sc-6400; RRID: AB_639943 |
| EGFR | Cell Signaling (D38B1) | Cat#4267; RRID:AB_2246311 |
| Phospho-Akt (Ser473) | Cell Signaling (D9E) | Cat#4060; RRID: AB_2315049 |
| Akt | Cell Signaling | Cat#9272; RRID: AB_329827 |
| Phospho-p44/p42 MAPK (Erk1/2) (Thr202/ Tyr204) | Cell Signaling (D13.14.4E) | Cat#4370; RRID: AB_2315112 |
| P44/p42 MAPK (Erk1/2) | Cell Signaling (137F5) | Cat#4695; RRID: AB_390779 |
| Phospho-GSK-3β (Ser9) | Cell Signaling (D85E12) | Cat#5558; RRID: AB_10013750 |
| GSK-3β | BD Transduction Laboratories (clone 7) | Cat#610201; RRID: AB_397600 |
| Phospho-Tuberin/TSC2 (Thr1462) | Cell Signaling | Cat#3611; RRID AB:329855 |
| Tuberin (TSC2) | Santa Cruz (C20) | Cat#sc-893; RRID: AB_632569 |
| APPL1 | Cell Signaling (D83H4) | Cat#3858; RRID:AB_2056989 |
| β-actin | Sigma (clone AC-15) | Cat#A1978; RRID: AB_476692 |
| Vinculin | Sigma (clone hVIN-1) | Cat#V9131; RRID: AB_477629 |
| Biological Samples | ||
| Lung disease spectrum tissue array | US Biomax | Cat#BC04002a |
| Chemicals, Peptides, and Recombinant Proteins | ||
| Human EGF | Invitrogen | Cat#PHG0311 |
| Biotin EGF | Invitrogen | Cat#E3477 |
| Holo-transferrin, human | Sigma | Cat#T4132 |
| Biotin transferrin, human | Invitrogen | Cat#T23363 |
| Akt inhibitor X | Calbiochem CAS 925681-41-0 | Cat#124020 |
| Matrigel | BD | Cat#356231 |
| Lipofectamine 2000 | Invitrogen | Cat#11668019 |
| Lipofectamine RNAiMAX | Invitrogen | Cat#13778150 |
| Recombinant human dynamin 1 | Laboratory of Sandra Schmid | Srinivasan et al., 2016 |
| Recombinant human dynamin 2 | Laboratory of Sandra Schmid | Srinivasan et al., 2016 |
| OptiMEM Reduced Serum Medium | ThermalFisher | Cat#31905070 |
| Experimental Models: Cell Lines | ||
| Human: H1299 cell line (NSCLC, derived from metastatic site: lymph node) | Dr. John Minna (The Hamon Center for Therapeutic Oncology, Depts. of Internal Medicine and Pharmacology, UTSW) | |
| Human: A549 cell line (NSCLC) | Dr. John Minna (The Hamon Center for Therapeutic Oncology, Depts. of Internal Medicine and Pharmacology, UTSW) | |
| Human: H522 cell line (NSCLC, adenocarcinoma) | Dr. John Minna (The Hamon Center for Therapeutic Oncology, Depts. of Internal Medicine and Pharmacology, UTSW) | |
| Human: H226 cell line (NSCLC) | Dr. John Minna (The Hamon Center for Therapeutic Oncology, Depts. of Internal Medicine and Pharmacology, UTSW) | |
| Human: EKVX cell line (NSCLC, adenocarcinoma) | Dr. John Minna (The Hamon Center for Therapeutic Oncology, Depts. of Internal Medicine and Pharmacology, UTSW) | |
| Experimental Models: Organisms/Strains | ||
| Mouse: NOD.CB17-Prkdcscid/NCrCrl (NOD SCID) | BioLASCO, Taiwan | From Charles River Laboratories |
| Recombinant DNA | ||
| pX335-U6-Chimeric_BB-CBh-hSpCas9n(D10A) | Cong et al., 2013 | Addgene plasmid #42335 |
| pMIG-IRES-BFP-human CLCb | This paper | Addgene plasmid #9044 |
| Sequence-Based Reagents | ||
| siRNA target sequence: APPL1 #1: 5’GAUCUGAGUCUACAAAUUU3’ | This paper | Sigma |
| siRNA target sequence: APPL1 #2: 5’GGAAAUGGACAGUGAUAUA3’ | This paper | Sigma |
| siRNA target sequence: APPL1 #3: 5’CAAAGUCGGUUGAUAGCUG3’ | This paper | Sigma |
| siRNA target sequence: APPL1 #4: 5’GAAACUAUGCGCCAAAUCU3’ | This paper | Sigma |
| Human CLCb guide sequence: positive strand: 5’TAGAGAACGACGAGGGCTTC3’ | This paper | IDT |
| Human CLCb guide sequence: negative strand: 5’CTGCAATCTCGCTCTCCTGC3’ | This paper | IDT |
| Human CLCa guide sequence: positive strand: 5’TGCGGGCATCGAGAACGACG3’ | This paper | IDT |
| Human CLCa guide sequence: negative strand: 5’CGCAGCCGGGTCTTCTTCGC3’ | This paper | IDT |
| Human Dyn1 guide sequence: positive strand: 5’CCGGCTGCCGCTAGCGCTCCCGG3’ | Reis et al., 2015 | IDT |
| Human Dyn1 guide sequence: negative strand: 5’ AGCCATGGGCAACCGCGGCATGG3’ | Reis et al., 2015 | IDT |
| Software and Algorithms | ||
| cmeAnalysisPackage | Aguet et al., 2013 | |
| ImageJ | https://imagej.nih.gov/ij/ | |
| Chemotaxis and Migration Tool | http://www.ibidi.de | |
CONTACT FOR REAGENT AND RESOURCE SHARING
Further information and requests for resources and reagents should be directed to and will be fulfilled by the Lead Contact (sandra.schmid@utsouthwestern.edu).
EXPERIMENTAL MODEL AND SUBJECT DETAILS
Orthotopic Tumor Implantation
2×10⁵ cells in 20 µl of PBS containing 10 ng of Matrigel (BD) were injected into the left lungs of 6-week-old female nude mice (n =6/group). Eight weeks after implantation, mice were sacrificed by anesthesia with carbon dioxide; whole lungs were removed, fixed in 10% formalin, and counted for metastatic nodules on the right lobes of lung under gross and microscopic examination. The representative lungs were embedded in paraffin, which were then sectioned into 4 µm layers and stained with hematoxylin and eosin (H&E) for histological analysis. Animal experiments were approved by Laboratory Animal Center, National Taiwan University College of Medicine (Chen et al., 2014).
METHOD DETAILS
Cell Culture
H1299, A549, H522, H229 and EKVX cells were kindly provided by Dr. John Minna (The Hamon Center for Therapeutic Oncology, Depts. of Internal Medicine and Pharmacology, UTSW) and maintained in RPMI 1640 medium supplemented with 5% of FBS, and 100 units/ml of penicillin and streptomycin.
Cell Engineering
Single CLCa H1299 and A549 cells were generated by expansion of CLCb-negative cells, as determined by Western blotting, after clonal selection by FACS sorting of single cells expressing Cas9 (D10A) nickase plasmids (Addgene plasmid #42335) harboring human CLCb guide sequence (Positive strand, 5TAGAGAACGACGAGGGCTTC3’; Negative strand, 5’CTGCAATCTCGCTC TCCTGC3’) (Cong et al., 2013). Because endogenous CLCb is expressed at low levels in parental cells, single CLCb H1299 and A549 cells were generated by first overexpressing CLCb and FACS selection for CLCb expression levels similar to that in sCLCa cells. Cells were then transfected with Cas9 (D10A) nickase plasmids harboring human CLCa guide sequence (Positive strand, 5TGCGGGCATCGAGAACGACG3’; Negative strand, 5’CGCAGCCGGGTCTTCTTCGC3’) and clonally selected after FACS sorting as for sCLCa cells. Switched CLCb H1299 cells were generated by retroviral-mediated expression of CLCb and an IRES-BFP marker. H1299 cells expressing different levels of CLCb were sorting by FACS based on BFP intensity. ‘Switched’ CLCb (swCLCb) H1299 cells that expressed similar total levels of CLCs and CHC compared to parental cells were selected for study. Dyn1 KO H1299 cells were generated by expansion of CLCb-negative cells, as determined by Western blotting, after clonal selection by FACS sorting of single cells expressing Cas9 (D10A) nickase plasmids (Addgene plasmid #42335) harboring human Dyn1 guide sequence (Positive strand, 5’CCGGCTGCCGCTAGCGCTCCCGG3’; Negative strand, 5’AGCCATGGGCAACCGCGGCATGG3’) as previously described (Reis et al., 2015).
Immunohistochemical Analysis
Immunohistochemistry was performed on a Dako Autostainer Link 48 system. Briefly, the slides were baked for 20 minutes at 60°C, then deparaffinized and dehydrated before the antigen retrieval step. Heat-induced antigen retrieval was performed at pH 6 for 20 minutes in a Dako PT Link. The tissue was incubated with a peroxidase block and then antibody incubation (1:2000 dilution for CLTA antibody, Sigma HPA050918; 1:4000 dilution for CLTB antibody, Abnova H00001212-M01) for 20 minutes. The staining was scanned at 40x resolution in brightfield mode by Nanozoomer 2.0-HT (Hamamatsu) and visualized using the NDP.view 2 viewing software (Hamamatsu). The IHC staining was scored by different people blinded to the sample identity and relative to representative images shown in Figures 1B and S1B and the results were presented as average percentage of low and high expression of indicated protein. Paraffin-embedded tissue microarrays (BC04002a) of lung cancer primary tumors, metastases, and normal tissues were obtained from US Biomax, inc. The tumors were classified according to the American Joint Committee on Cancer (AJCC) TNM system. Among them, twenty-three were classified as stage I, fourteen as stage II, thirteen as stage III, and ten were lymph node metastases from lung squamous cell carcinoma.
siRNA and Plasmids Transfection
Plasmids and siRNA were transfected according to the manufacturer’s recommendations using Lipofectamine 2000 and Lipofectamine RNAiMAX respectively (Invitrogen). Briefly, 110 pmol of the indicated siRNA and 6.5 µl of Lipofectamine RNAiMAX reagent were diluted in 100 µl of OptiMEM medium (ThermalFisher). Then, the diluted siRNA was added to diluted Lipofectamine RNAiMAX reagent and incubate for 5 minutes at room temperature. The mixed siRNA-lipid complex was added to each well of a 6-well plate containing cells for 4 hours. For plasmid transfections, 1 µg of the indicated plasmids and 10 µl of Lipofectamine 2000 reagent were diluted in 100 µl of OptiMEM medium (ThermalFisher). Then, the diluted plasmids were added to diluted Lipofectamine 2000 reagent and incubated for 5 minutes at room temperature. The mixed plasmid-lipid complex was added to each well of a 6-well plate containing cells for 4 hours. Cells were placed in original culture medium 4 hours after plasmid or siRNA transfection.
Cell Scattering and Migration Assay
Scattering and migration assays were performed using 12 well plates. 2×10⁴ cells/well were dispensed and 48 hours later, the complete medium was replaced with 1ml of FBS-free RPMI after extensive washes with PBS to remove any remaining fetal bovine serum (FBS). Cells were imaged by phase contrast using a 20× air objective (5×5 tiling covering ~80–90% of the well) with a frame rate of 1 image/15 minute on a Ti-Eclipse inverted microscope (Nikon) driven by NIS Elements V4.13 software. After one hour, we added 50µl from a 400ng/ml stock of EGF prepared in FBS-free RPMI (~20 ng/ml final) and continued imaging for another 7 hours. Cell migration directionality and speed were analyzed by ImageJ and Chemotaxis and Migration Tool (http://www.ibidi.de).
TIR-FM
Total internal reflection fluorescence microscopy (TIR-FM) was performed as previously described (Loerke et al., 2009). Briefly, sCLCa expressing GFP-CLCa and sCLCb expressing GFP-CLCb H1299 and A549 cells were imaged using a 100× 1.49 NA Apo TIRF objective (Nikon) mounted on a Ti-Eclipse inverted microscope with Perfect Focus System (Nikon). TIR-FM illumination was achieved using a Diskovery Platform (Andor Technology). During imaging, cells were maintained at 37°C in RPMI supplemented with 5% fetal calf serum. Time-lapse image sequences were acquired at a penetration depth of 90 nm and a frame rate of 1Hz using a sCMOS camera with 6.5µm pixel size (pco.edge).
Endocytosis Assay
Transferrin (Tfn) and EGFR internalization experiments were performed using anti-TfnR mAb (HTR-D65) (Schmid and Smythe, 1991) or biotinylated-EGF respectively. Cells were grown overnight in 96-well plates at a density of 2×10⁴ cells/well and incubated with 4 µg/ml of D65 or 20 ng/ml of biotinylated-EGF (Invitrogen) in assay buffer (PBS4+: PBS supplemented with 1 mM MgCl2, 1 mM CaCl2, 5 mM glucose and 0.2% bovine serum albumin) at 37°C for the indicated time points. Cells were then immediately cooled down (4°C) to stop internalization. The remaining surface-bound D65 or biotinylated-EGF was removed from the cells by an acid wash step (0.2 M acetic acid, 0.2 M NaCl, pH 2.5). Cells were then washed with cold PBS and then fixed in 4% paraformaldehyde (PFA) (Electron Microscopy Sciences) in PBS for 30 min and further permeabilized with 0.1% Triton X-100/PBS for 10 min. Internalized D65 was assessed using a goat anti-mouse HRP-conjugated antibody (Life Technologies), and internalized biotinylated-EGF was assessed by streptavidin-POD (Roche). The reaction was further developed with OPD (P1536, Sigma-Aldrich), and then stopped by addition of 50 µl of 5M of H2SO4. The absorbance was read at 490 nm (Biotek Synergy H1 Hybrid Reader). Internalized ligand was expressed as the percentage of the total surface-bound ligand at 4°C (i.e., without acid wash step), measured in parallel (Reis et al., 2015). Well-to-well variability in cell number was accounted for by normalizing the reading at 490 nm with a BCA readout at 560 nm.
Recycling Assay
Tfn and EGFR recycling experiments were performed using biotinylated-Tfn or EGF respectively. Cells were grown overnight in 96-well plates at a density of 2×10⁴ cells/well and pulsed with 5 µg/ml of biotinylated-Tfn or 20 ng/ml of biotinylated-EGF in PBS4+ buffer at 37°C for 10min. Cells were then immediately cooled down (4°C) to stop internalization. The remaining surface-bound biotinylated-Tfn or biotinylated-EGF was removed from the cells by acid wash (0.2 M acetic acid, 0.2 M NaCl, pH 2.5). Cells were washed with PBS and then incubated in PBS4+ containing 2mg/ml of holo-Tfn or 20ng/ml of EGF at 37°C for the indicated time points. Cells were then washed 0.2 M acetic acid/0.2 M NaCl (pH 2.5) again and PBS and then fixed in 4% paraformaldehyde (PFA) (Electron Microscopy Sciences) in PBS for 30 min and further permeabilized with 0.1% Triton X-100/PBS for 10 min. Internalized biotinylated ligand was assessed by streptavidin-POD (Roche). The reaction was further developed with OPD (P1536, Sigma-Aldrich), and then stopped by addition of 50 µl of 5M of H2SO4. The absorbance was read at 490 nm (Biotek Synergy H1 Hybrid Reader). Well-to-well variability in cell number was accounted for by normalizing the reading at 490 nm with a BCA readout at 560 nm. The decrease in intracellular biotinylated-Tfn or biotinylated-EGF (recycling) was calculated relative to the total internal pool of ligand internalized.
Microarray Data Analysis
NCI-60 gene transcript analysis was performed by CellMiner™ software generated by Genomics & Bioinformatics Group, LMP, CCR and NCI (Shankavaram et al., 2009). Probe intensity value is transformed to Z score. Each gene expression across the NCI-60, subtracts the mean intensity (to center the data), and then divides by the standard deviation of the measured intensities (to normalize the range) (Reinhold et al., 2012). Positive z-score represents gene expression in the particular cell line is above (greater than) the mean of all NCI60 cell lines, and negative z-score represents gene expression is below (less than) the mean.
QUANTIFICATION AND STATISTICAL ANALYSIS
Analysis of IHC Staining Data
The IHC staining was scored by different people who were blinded to the sample identity, relative to representative low and high expression groups (images shown in Figures 1B and S1B) and the result was presented as average percentage of low and high expression of indicated protein. Sample number: normal (n=15), stage I tumor (I, n=23), stage II tumor (II, n=14), stage III tumor (III, n=13) and metastatic tumor tissues (n=10).
Analysis of Endocytosis and Recycling Data
Endocytosis and recycling data (Figures 2C, 2D, 3D–3F, 4B, S2B, and S2C) were pooled and averaged from three independent experiments and presented as mean±SEM, n=3. The statistical significance was analyzed by Student’s t-test. *, p<0.1; **, p<0.05; ***, p<0.01.
Analysis of CCP Dynamics and Initiation Data (Live Cell TIR-FM)
CCP lifetime distribution and initiation density in Figures 2E, 2F, and S2F–S2G were from three independent experiments. More than 10,000 CCP events from 20× 10 minute live cell images (frame rate of 1Hz) were pooled and analyzed by cmeAnalysisPackage (Aguet et al., 2013). Initiation density of bona fide CCPs for the conditions indicated was presented as box plots show median, 25th, and 75th percentiles, and outermost data points. The statistical significance was analyzed by Student’s t-test. *, p<0.1; **, p<0.05; ***, p<0.01.
Analysis of Western Blot Data
The intensity of phosphorylated and total protein blots (Figures 4A, 4C, 5B, and S4B) were analyzed from three independent experiments by ImageJ and presented as mean±SEM, n=3. The statistical significance was analyzed by Student’s t-test. *, p<0.1; **, p<0.05; ***, p<0.01.
Analysis of APPL1 Positive Endosome Immunofluorescence Staining Data
The immunofluorescence staining of APPL1 positive endosomes (Figures 5A, 5C, S5B, S5E, and S5F) was quantified by ImageJ and presented as mean±SEM, n=20 (three independent experiments). The statistical significance was analyzed by Student’s t-test. *, p<0.1; **, p<0.05; ***, p<0.01.
Analysis of Cell Migration Speed and Directionality Data
Cell migration directionality and speed (Figures 6A and S6B) were analyzed by ImageJ and Chemotaxis and Migration Tool (www.ibidi.de). The data was pooled from 60 cells (three independent experiments) and presented as mean±SEM. The statistical significance was analyzed by Student’s t-test. *, p<0.1; **, p<0.05; ***, p<0.01.
Analysis of Orthotopic Tumor Metastasis Data
The data was presented as average number of metastatic tumor nodules developed in right lung lobes from mice sacrificed eight weeks after orthogonal lung injection. Values are mean±SEM, n=6 mice. The statistical significance was analyzed by Student’s t-test. *, p<0.1; **, p<0.05; ***, p<0.01.
Analysis of NCI60 Microarray and Proteome Data and Kaplan-Meier Survival Data
NCI-60 gene transcript analysis was performed by CellMiner™ software generated by Genomics & Bioinformatics Group, LMP, CCR and NCI (Shankavaram et al., 2009). Probe intensity value is transformed to Z score.
NCI-60 proteome data was downloaded from http://129.187.44.58:7070/NCI60/ (Gholami et al., 2013).
NSCLC patient survival data was downloaded from the Kaplan Meier plotter database (Gyorffy et al., 2013). Pre-stratifying NSCLC patients according to tumor stages was performed in CLCb and Dyn1 high and low expression cohort. P value was calculated by log-rank test (Gyorffy et al., 2013).
Supplementary Material
Highlights.
CLCb and Dyn1 contribute to adaptive clathrin-mediated endocytosis in cancer cells
CLCb modulates dynamin-1 via an APPL1/Akt/GSK3β signaling circuit
Upregulation of CLCb alters EGFR trafficking dependent on dynamin-1
Upregulation of CLCb increases tumor cell migration and metastasis
Acknowledgments
We are grateful to Dr. Saipraveen Srinivasan for discussion and generation of Dyn1 KO H1299 cells and the members of the Schmid laboratory for reagents and technical assistance. We thank the UTSW Tissue Management in the Simmons Cancer Center (supported by the National Cancer Institute of the NIH under award number 5P30CA142543) for assistance with IHC analysis, and we thank the UTSW Whole Brain Microscopy Facility (WBMF) in the Department of Neurology and Neurotherapeutics for assistance with slide scanning. WBMF is supported by the Texas Institute for Brain Injury and Repair (TIBIR). This research was supported by NIH grants R01 GM73165 (to Gaudenz Danuser and S.L.S.) and MH61345 and GM42455 (to S.L.S.). P.-H.C. was partly supported by Taiwan National Science Council Grant 103-2917-I-564-029.
Footnotes
SUPPLEMENTAL INFORMATION
Supplemental Information includes seven figures and can be found with this article online at http://dx.doi.org/10.1016/j.devcel.2017.01.007.
AUTHOR CONTRIBUTIONS
P.-H.C. and S.L.S. designed the project. P.-H.C. performed the experiments and analyzed the results. P.-H.C. and S.L.S. wrote the manuscript. N.B. performed the scattering/migration experiments. C.R.R. and M.M. assisted with IF experiments and image analysis. Y.-J.H., H.-Y.C., and S.-L.Y. performed the computational analysis of patient data and in vivo mouse experiments. All authors discussed the results and commented on the manuscript.
References
- Acton SL, Brodsky FM. Predominance of clathrin light chain LCb correlates with the presence of a regulated secretory pathway. J. Cell Biol. 1990;111:1419–1426. doi: 10.1083/jcb.111.4.1419. [DOI] [PMC free article] [PubMed] [Google Scholar]
- Aguet F, Antonescu CN, Mettlen M, Schmid SL, Danuser G. Advances in analysis of low signal-to-noise images link dynamin and AP2 to the functions of an endocytic checkpoint. Dev. Cell. 2013;26:279–291. doi: 10.1016/j.devcel.2013.06.019. [DOI] [PMC free article] [PubMed] [Google Scholar]
- Arteaga CL, Engelman JA. ERBB receptors: from oncogene discovery to basic science to mechanism-based cancer therapeutics. Cancer Cell. 2014;25:282–303. doi: 10.1016/j.ccr.2014.02.025. [DOI] [PMC free article] [PubMed] [Google Scholar]
- Barbieri E, Di Fiore PP, Sigismund S. Endocytic control of signaling at the plasma membrane. Curr. Opin. Cell Biol. 2016;39:21–27. doi: 10.1016/j.ceb.2016.01.012. [DOI] [PubMed] [Google Scholar]
- Ben-Chetrit N, Chetrit D, Russell R, Korner C, Mancini M, Abdul-Hai A, Itkin T, Carvalho S, Cohen-Dvashi H, Koestler WJ, et al. Synaptojanin 2 is a druggable mediator of metastasis and the gene is overexpressed and amplified in breast cancer. Sci. Signal. 2015;8 doi: 10.1126/scisignal.2005537. ra7. [DOI] [PubMed] [Google Scholar]
- Borner GH, Antrobus R, Hirst J, Bhumbra GS, Kozik P, Jackson LP, Sahlender DA, Robinson MS. Multivariate proteomic profiling identifies novel accessory proteins of coated vesicles. J. Cell Biol. 2012;197:141–160. doi: 10.1083/jcb.201111049. [DOI] [PMC free article] [PubMed] [Google Scholar]
- Brodsky FM. Diversity of clathrin function: new tricks for an old protein. Annu. Rev. Cell Dev. Biol. 2012;28:309–336. doi: 10.1146/annurev-cellbio-101011-155716. [DOI] [PubMed] [Google Scholar]
- Cao H, Garcia F, McNiven MA. Differential distribution of dynamin isoforms in mammalian cells. Mol. Biol. Cell. 1998;9:2595–2609. doi: 10.1091/mbc.9.9.2595. [DOI] [PMC free article] [PubMed] [Google Scholar]
- Caswell PT, Vadrevu S, Norman JC. Integrins: masters and slaves of endocytic transport. Nat. Rev. Mol. Cell Biol. 2009;10:843–853. doi: 10.1038/nrm2799. [DOI] [PubMed] [Google Scholar]
- Chang YH, Chen CM, Chen HY, Yang PC. Pathway-based gene signatures predicting clinical outcome of lung adenocarcinoma. Sci. Rep. 2015;5:10979. doi: 10.1038/srep10979. [DOI] [PMC free article] [PubMed] [Google Scholar]
- Chen CY, Brodsky FM. Huntingtin-interacting protein 1 (Hip1) and Hip1-related protein (Hip1R) bind the conserved sequence of clathrin light chains and thereby influence clathrin assembly in vitro and actin distribution in vivo. J. Biol. Chem. 2005;280:6109–6117. doi: 10.1074/jbc.M408454200. [DOI] [PubMed] [Google Scholar]
- Chen CC, Chen HY, Su KY, Hong QS, Yan BS, Chen CH, Pan SH, Chang YL, Wang CJ, Hung PF, et al. Shisa3 is associated with prolonged survival through promoting beta-catenin degradation in lung cancer. Am. J. Respir. Crit. Care Med. 2014;190:433–444. doi: 10.1164/rccm.201312-2256OC. [DOI] [PubMed] [Google Scholar]
- Cheng KK, Iglesias MA, Lam KS, Wang Y, Sweeney G, Zhu W, Vanhoutte PM, Kraegen EW, Xu A. APPL1 potentiates insulin-mediated inhibition of hepatic glucose production and alleviates diabetes via Akt activation in mice. Cell Metab. 2009;9:417–427. doi: 10.1016/j.cmet.2009.03.013. [DOI] [PubMed] [Google Scholar]
- Clayton EL, Sue N, Smillie KJ, O’Leary T, Bache N, Cheung G, Cole AR, Wyllie DJ, Sutherland C, Robinson PJ, Cousin MA. Dynamin I phosphorylation by GSK3 controls activity-dependent bulk endocytosis of synaptic vesicles. Nat. Neurosci. 2010;13:845–851. doi: 10.1038/nn.2571. [DOI] [PMC free article] [PubMed] [Google Scholar]
- Cong L, Ran FA, Cox D, Lin S, Barretto R, Habib N, Hsu PD, Wu X, Jiang W, Marraffini LA, Zhang F. Multiplex genome engineering using CRISPR/Cas systems. Science. 2013;339:819–823. doi: 10.1126/science.1231143. [DOI] [PMC free article] [PubMed] [Google Scholar]
- Di Fiore PP, von Zastrow M. Endocytosis, signaling, and beyond. Cold Spring Harb. Perspect. Biol. 2014;6:a016865. doi: 10.1101/cshperspect.a016865. [DOI] [PMC free article] [PubMed] [Google Scholar]
- Ferguson SM, De Camilli P. Dynamin, a membrane-remodelling GTPase. Nat. Rev. Mol. Cell Biol. 2012;13:75–88. doi: 10.1038/nrm3266. [DOI] [PMC free article] [PubMed] [Google Scholar]
- Ferreira F, Foley M, Cooke A, Cunningham M, Smith G, Woolley R, Henderson G, Kelly E, Mundell S, Smythe E. Endocytosis of G protein-coupled receptors is regulated by clathrin light chain phosphorylation. Curr. Biol. 2012;22:1361–1370. doi: 10.1016/j.cub.2012.05.034. [DOI] [PubMed] [Google Scholar]
- Gholami AM, Hahne H, Wu Z, Auer FJ, Meng C, Wilhelm M, Kuster B. Global proteome analysis of the NCI-60 cell line panel. Cell Rep. 2013;4:609–620. doi: 10.1016/j.celrep.2013.07.018. [DOI] [PubMed] [Google Scholar]
- Girard M, Allaire PD, McPherson PS, Blondeau F. Non-stoichiometric relationship between clathrin heavy and light chains revealed by quantitative comparative proteomics of clathrin-coated vesicles from brain and liver. Mol. Cell. Proteomics. 2005;4:1145–1154. doi: 10.1074/mcp.M500043-MCP200. [DOI] [PubMed] [Google Scholar]
- Gyorffy B, Surowiak P, Budczies J, Lanczky A. Online survival analysis software to assess the prognostic value of biomarkers using transcriptomic data in non-small-cell lung cancer. PLoS One. 2013;8:e82241. doi: 10.1371/journal.pone.0082241. [DOI] [PMC free article] [PubMed] [Google Scholar]
- Haferlach T, Kohlmann A, Wieczorek L, Basso G, Kronnie GT, Bene MC, De Vos J, Hernandez JM, Hofmann WK, Mills KI, et al. Clinical utility of microarray-based gene expression profiling in the diagnosis and subclassification of leukemia: report from the International Microarray Innovations in Leukemia Study Group. J. Clin. Oncol. 2010;28:2529–2537. doi: 10.1200/JCO.2009.23.4732. [DOI] [PMC free article] [PubMed] [Google Scholar]
- Hoffmann A, Dannhauser PN, Groos S, Hinrichsen L, Curth U, Ungewickell EJ. A comparison of GFP-tagged clathrin light chains with fluorochromated light chains in vivo and in vitro. Traffic. 2010;11:1129–1140. doi: 10.1111/j.1600-0854.2010.01084.x. [DOI] [PubMed] [Google Scholar]
- Hong Y, Downey T, Eu KW, Koh PK, Cheah PY. A ‘metastasis-prone’ signature for early-stage mismatch-repair proficient sporadic colorectal cancer patients and its implications for possible therapeutics. Clin. Exp. Metastasis. 2010;27:83–90. doi: 10.1007/s10585-010-9305-4. [DOI] [PubMed] [Google Scholar]
- Ji P, Diederichs S, Wang W, Boing S, Metzger R, Schneider PM, Tidow N, Brandt B, Buerger H, Bulk E, et al. MALAT-1, a novel noncoding RNA, and thymosin beta4 predict metastasis and survival in early-stage non-small cell lung cancer. Oncogene. 2003;22:8031–8041. doi: 10.1038/sj.onc.1206928. [DOI] [PubMed] [Google Scholar]
- Joffre C, Barrow R, Menard L, Calleja V, Hart IR, Kermorgant S. A direct role for Met endocytosis in tumorigenesis. Nat. Cell Biol. 2011;13:827–837. doi: 10.1038/ncb2257. [DOI] [PubMed] [Google Scholar]
- Johnson IR, Parkinson-Lawrence EJ, Keegan H, Spillane CD, Barry-O’Crowley J, Watson WR, Selemidis S, Butler LM, O’Leary JJ, Brooks DA. Endosomal gene expression: a new indicator for prostate cancer patient prognosis? Oncotarget. 2015;6:37919–37929. doi: 10.18632/oncotarget.6114. [DOI] [PMC free article] [PubMed] [Google Scholar]
- Kalaidzidis I, Miaczynska M, Brewinska-Olchowik M, Hupalowska A, Ferguson C, Parton RG, Kalaidzidis Y, Zerial M. APPL endosomes are not obligatory endocytic intermediates but act as stable cargo-sorting compartments. J. Cell Biol. 2015;211:123–144. doi: 10.1083/jcb.201311117. [DOI] [PMC free article] [PubMed] [Google Scholar]
- Kirchhausen T, Toyoda T. Immunoelectron microscopic evidence for the extended conformation of light chains in clathrin trimers. J. Biol. Chem. 1993;268:10268–10273. [PubMed] [Google Scholar]
- Kirchhausen T, Harrison SC, Parham P, Brodsky FM. Location and distribution of the light chains in clathrin trimers. Proc. Natl. Acad. Sci. USA. 1983;80:2481–2485. doi: 10.1073/pnas.80.9.2481. [DOI] [PMC free article] [PubMed] [Google Scholar]
- Legendre-Guillemin V, Metzler M, Lemaire JF, Philie J, Gan L, Hayden MR, McPherson PS. Huntingtin interacting protein 1 (HIP1) regulates clathrin assembly through direct binding to the regulatory region of the clathrin light chain. J. Biol. Chem. 2005;280:6101–6108. doi: 10.1074/jbc.M408430200. [DOI] [PubMed] [Google Scholar]
- Liberali P, Snijder B, Pelkmans L. A hierarchical map of regulatory genetic interactions in membrane trafficking. Cell. 2014;157:1473–1487. doi: 10.1016/j.cell.2014.04.029. [DOI] [PubMed] [Google Scholar]
- Loerke D, Mettlen M, Yarar D, Jaqaman K, Jaqaman H, Danuser G, Schmid SL. Cargo and dynamin regulate clathrin-coated pit maturation. PLoS Biol. 2009;7:e57. doi: 10.1371/journal.pbio.1000057. [DOI] [PMC free article] [PubMed] [Google Scholar]
- Majeed SR, Vasudevan L, Chen CY, Luo Y, Torres JA, Evans TM, Sharkey A, Foraker AB, Wong NM, Esk C, et al. Clathrin light chains are required for the gyrating-clathrin recycling pathway and thereby promote cell migration. Nat. Commun. 2014;5:3891. doi: 10.1038/ncomms4891. [DOI] [PMC free article] [PubMed] [Google Scholar]
- Martinu L, Santiago-Walker A, Qi H, Chou MM. Endocytosis of epidermal growth factor receptor regulated by Grb2-mediated recruitment of the Rab5 GTPase-activating protein RN-tre. J. Biol. Chem. 2002;277:50996–51002. doi: 10.1074/jbc.M204869200. [DOI] [PubMed] [Google Scholar]
- Matsuda T, Saito Y, Fujii T, Uraoka T, Nakajima T, Kobayashi N, Emura F, Ono A, Shimoda T, Ikematsu H, et al. Size does not determine the grade of malignancy of early invasive colorectal cancer. World J. Gastroenterol. 2009;15:2708–2713. doi: 10.3748/wjg.15.2708. [DOI] [PMC free article] [PubMed] [Google Scholar]
- McMahon HT, Boucrot E. Molecular mechanism and physiological functions of clathrin-mediated endocytosis. Nat. Rev. Mol. Cell Biol. 2011;12:517–533. doi: 10.1038/nrm3151. [DOI] [PubMed] [Google Scholar]
- Mellman I, Yarden Y. Endocytosis and cancer. Cold Spring Harb. Perspect. Biol. 2013;5:a016949. doi: 10.1101/cshperspect.a016949. [DOI] [PMC free article] [PubMed] [Google Scholar]
- Merrifield CJ, Kaksonen M. Endocytic accessory factors and regulation of clathrin-mediated endocytosis. Cold Spring Harb. Perspect. Biol. 2014;6:a016733. doi: 10.1101/cshperspect.a016733. [DOI] [PMC free article] [PubMed] [Google Scholar]
- Mettlen M, Stoeber M, Loerke D, Antonescu CN, Danuser G, Schmid SL. Endocytic accessory proteins are functionally distinguished by their differential effects on the maturation of clathrin-coated pits. Mol. Biol. Cell. 2009;20:3251–3260. doi: 10.1091/mbc.E09-03-0256. [DOI] [PMC free article] [PubMed] [Google Scholar]
- Miaczynska M, Christoforidis S, Giner A, Shevchenko A, Uttenweiler-Joseph S, Habermann B, Wilm M, Parton RG, Zerial M. APPL proteins link Rab5 to nuclear signal transduction via an endosomal compartment. Cell. 2004;116:445–456. doi: 10.1016/s0092-8674(04)00117-5. [DOI] [PubMed] [Google Scholar]
- Mitsuuchi Y, Johnson SW, Sonoda G, Tanno S, Golemis EA, Testa JR. Identification of a chromosome 3p14.3-21.1 gene, APPL, encoding an adaptor molecule that interacts with the oncoprotein-serine/threonine kinase AKT2. Oncogene. 1999;18:4891–4898. doi: 10.1038/sj.onc.1203080. [DOI] [PubMed] [Google Scholar]
- Mosesson Y, Mills GB, Yarden Y. Derailed endocytosis: an emerging feature of cancer. Nat. Rev. Cancer. 2008;8:835–850. doi: 10.1038/nrc2521. [DOI] [PubMed] [Google Scholar]
- Muller PA, Caswell PT, Doyle B, Iwanicki MP, Tan EH, Karim S, Lukashchuk N, Gillespie DA, Ludwig RL, Gosselin P, et al. Mutant p53 drives invasion by promoting integrin recycling. Cell. 2009;139:1327–1341. doi: 10.1016/j.cell.2009.11.026. [DOI] [PubMed] [Google Scholar]
- Onn A, Isobe T, Itasaka S, Wu W, O’Reilly MS, Ki Hong W, Fidler IJ, Herbst RS. Development of an orthotopic model to study the biology and therapy of primary human lung cancer in nude mice. Clin. Cancer Res. 2003;9:5532–5539. [PubMed] [Google Scholar]
- Palfy M, Remenyi A, Korcsmaros T. Endosomal crosstalk: meeting points for signaling pathways. Trends Cell Biol. 2012;22:447–456. doi: 10.1016/j.tcb.2012.06.004. [DOI] [PMC free article] [PubMed] [Google Scholar]
- Parachoniak CA, Park M. Dynamics of receptor trafficking in tumorigenicity. Trends Cell Biol. 2012;22:231–240. doi: 10.1016/j.tcb.2012.02.002. [DOI] [PubMed] [Google Scholar]
- Paul NR, Jacquemet G, Caswell PT. Endocytic trafficking of integrins in cell migration. Curr. Biol. 2015;25:R1092–R1105. doi: 10.1016/j.cub.2015.09.049. [DOI] [PubMed] [Google Scholar]
- Reinhold WC, Sunshine M, Liu H, Varma S, Kohn KW, Morris J, Doroshow J, Pommier Y. CellMiner: a web-based suite of genomic and pharmacologic tools to explore transcript and drug patterns in the NCI-60 cell line set. Cancer Res. 2012;72:3499–3511. doi: 10.1158/0008-5472.CAN-12-1370. [DOI] [PMC free article] [PubMed] [Google Scholar]
- Reis CR, Chen PH, Srinivasan S, Aguet F, Mettlen M, Schmid SL. Crosstalk between Akt/GSK3beta signaling and dynamin-1 regulates clathrin-mediated endocytosis. EMBO J. 2015;34:2132–2146. doi: 10.15252/embj.201591518. [DOI] [PMC free article] [PubMed] [Google Scholar]
- Schenck A, Goto-Silva L, Collinet C, Rhinn M, Giner A, Habermann B, Brand M, Zerial M. The endosomal protein Appl1 mediates Akt substrate specificity and cell survival in vertebrate development. Cell. 2008;133:486–497. doi: 10.1016/j.cell.2008.02.044. [DOI] [PubMed] [Google Scholar]
- Schmid SL, Frolov VA. Dynamin: functional design of a membrane fission catalyst. Annu. Rev. Cell Dev. Biol. 2011;27:79–105. doi: 10.1146/annurev-cellbio-100109-104016. [DOI] [PubMed] [Google Scholar]
- Schmid SL, Smythe E. Stage-specific assays for coated pit formation and coated vesicle budding in vitro. J. Cell Biol. 1991;114:869–880. doi: 10.1083/jcb.114.5.869. [DOI] [PMC free article] [PubMed] [Google Scholar]
- Schmid SL, Braell WA, Schlossman DM, Rothman JE. A role for clathrin light chains in the recognition of clathrin cages by ‘uncoating ATPase’. Nature. 1984;311:228–231. doi: 10.1038/311228a0. [DOI] [PubMed] [Google Scholar]
- Shankavaram UT, Varma S, Kane D, Sunshine M, Chary KK, Reinhold WC, Pommier Y, Weinstein JN. CellMiner:a relational database and query tool for the NCI-60 cancer cell lines. BMC Genomics. 2009;10:277. doi: 10.1186/1471-2164-10-277. [DOI] [PMC free article] [PubMed] [Google Scholar]
- Shtiegman K, Kochupurakkal BS, Zwang Y, Pines G, Starr A, Vexler A, Citri A, Katz M, Lavi S, Ben-Basat Y, et al. Defective ubiquitinylation of EGFR mutants of lung cancer confers prolonged signaling. Oncogene. 2007;26:6968–6978. doi: 10.1038/sj.onc.1210503. [DOI] [PubMed] [Google Scholar]
- Sigismund S, Confalonieri S, Ciliberto A, Polo S, Scita G, Di Fiore PP. Endocytosis and signaling: cell logistics shape the eukaryotic cell plan. Physiol. Rev. 2012;92:273–366. doi: 10.1152/physrev.00005.2011. [DOI] [PMC free article] [PubMed] [Google Scholar]
- Solomaha E, Szeto FL, Yousef MA, Palfrey HC. Kinetics of Src homology 3 domain association with the proline-rich domain of dynamins: specificity, occlusion, and the effects of phosphorylation. J. Biol. Chem. 2005;280:23147–23156. doi: 10.1074/jbc.M501745200. [DOI] [PubMed] [Google Scholar]
- Sorkin A, von Zastrow M. Endocytosis and signalling: intertwining molecular networks. Nat. Rev. Mol. Cell Biol. 2009;10:609–622. doi: 10.1038/nrm2748. [DOI] [PMC free article] [PubMed] [Google Scholar]
- Srinivasan S, Dharmarajan V, Reed DK, Griffin PR, Schmid SL. Identification and function of conformational dynamics in the multidomain GTPase dynamin. EMBO J. 2016;35:443–457. doi: 10.15252/embj.201593477. [DOI] [PMC free article] [PubMed] [Google Scholar]
- Tomas A, Futter CE, Eden ER. EGF receptor trafficking: consequences for signaling and cancer. Trends Cell Biol. 2014;24:26–34. doi: 10.1016/j.tcb.2013.11.002. [DOI] [PMC free article] [PubMed] [Google Scholar]
- Urrutia R, Henley JR, Cook T, McNiven MA. The dynamins: redundant or distinct functions for an expanding family of related GTPases? Proc. Natl. Acad. Sci. USA. 1997;94:377–384. doi: 10.1073/pnas.94.2.377. [DOI] [PMC free article] [PubMed] [Google Scholar]
- Wilbur JD, Hwang PK, Ybe JA, Lane M, Sellers BD, Jacobson MP, Fletterick RJ, Brodsky FM. Conformation switching of clathrin light chain regulates clathrin lattice assembly. Dev. Cell. 2010;18:841–848. doi: 10.1016/j.devcel.2010.04.007. [DOI] [PMC free article] [PubMed] [Google Scholar]
- Wyckoff JB, Jones JG, Condeelis JS, Segall JE. A critical step in metastasis: in vivo analysis of intravasation at the primary tumor. Cancer Res. 2000;60:2504–2511. [PubMed] [Google Scholar]
- Young A, Stoilova-McPhie S, Rothnie A, Vallis Y, Harvey-Smith P, Ranson N, Kent H, Brodsky FM, Pearse BM, Roseman A, Smith CJ. Hsc70-induced changes in clathrin-auxilin cage structure suggest a role for clathrin light chains in cage disassembly. Traffic. 2013;14:987–996. doi: 10.1111/tra.12085. [DOI] [PMC free article] [PubMed] [Google Scholar]
Associated Data
This section collects any data citations, data availability statements, or supplementary materials included in this article.