

SUMMARY
Fragile X Syndrome (FXS) is a leading genetic cause of intellectual disability and autism. FXS results from the loss of function of Fragile X Mental Retardation Protein (FMRP), which represses translation of target transcripts. Most of the well-characterized target transcripts of FMRP are synaptic proteins, yet targeting these proteins has not provided effective treatments. We examined a group of FMRP targets that encode transcriptional regulators, particularly chromatin-associated proteins. Loss of FMRP in mice results in widespread changes in chromatin regulation and aberrant gene expression. To determine if targeting epigenetic factors could reverse phenotypes associated with the disorder, we focused on Brd4, a BET protein and chromatin reader targeted by FMRP. Inhibition of Brd4 function alleviated many of the phenotypes associated with FXS. We conclude that loss of FMRP results in significant epigenetic misregulation and that targeting transcription via epigenetic regulators like Brd4 may provide new treatments for FXS.
INTRODUCTION
Fragile X Syndrome (FXS) is a neurodevelopmental disorder that causes intellectual disability, behavioral deficits, and is a leading genetic cause of autism spectrum disorder (ASD). FXS is caused by loss of the Fragile X Mental Retardation Protein (FMRP). The most well-established function of FMRP is its ability to bind to and repress translation of target RNA transcripts (Darnell et al., 2011). FMRP may also transport transcripts to dendrites and allow for regulated translation in response to extracellular signals in neurons, providing a high degree of positional and temporal control over target proteins. FMRP is clearly important in synaptic function and plasticity (Bassell and Warren, 2008; Bear et al., 2004; Niere et al., 2012). However, only a few of the synaptic targets of FMRP have shown substantial misregulation in Fmr1 KO neurons (Darnell et al., 2011; Niere et al., 2012) and despite several promising leads (Henderson et al., 2012), treatments based on synaptic targets have not yet provided significant improvements for the patient population.
Increasing evidence suggests that in addition to synaptic deficits, epigenetic regulation of transcription is critical in neuronal development and neurodevelopmental disorders. Such regulation occurs through many mechanisms in neurons, including through chromatin, a complex of DNA and associated histone proteins that package DNA into higher-order structures. Chromatin-associated proteins alter transcription of target genes, by binding to and altering a vast array of post-translational modifications of histones that include acetylation, methylation, phosphorylation, ubiquitination, and others. Proteins that add these modifications (‘writers’), or remove them (‘erasers’), dynamically regulate histone modifications to mediate binding of effector complexes (‘readers’) and downstream effects on transcription.
While much of the research into FXS and the targets of FMRP have focused on transcripts that encode synaptic proteins, intriguing links between FXS and epigenetic regulation indicate that FMRP may also regulate chromatin in neurons. A disproportionate number of FMRP target mRNAs identified by HITS-CLIP were previously found to encode transcription factors (Darnell et al., 2011, see Table S5) and chromatin modifiers (Darnell et al., 2011, see Table S2B). Interest in these targets was heightened when FMRP target transcripts were overlaid with autism candidate genes and many of these overlapping candidates were noted to be involved in either transcriptional regulation or chromatin remodeling (Iossifov et al., 2012). Subsequent analysis of molecular pathways linked to both autism and FMRP target transcripts found that one of three overlapping gene modules was made up of transcriptional regulators (Parikshak et al., 2013). Furthermore, FMRP can regulate the DNA damage response during gametogenesis (Alpatov et al., 2014). However, whether FMRP’s role in repressing translation in developing and mature neurons is also functionally linked to chromatin regulation has not yet been investigated. We hypothesize that FMRP targets are involved in epigenetic regulation, providing neurons with the ability to use regulation of translation to modify transcription.
Here we examined whether the chromatin-regulating proteins targeted by FMRP contribute to FXS. Fmr1 knockout (KO) mice show widespread changes in histone marks as well as transcriptional misregulation resulting in increased expression of many critical synaptic genes. Our data suggest that one chromatin target of FMRP, the reader protein Brd4, appears to be significantly involved in this transcriptional disruption and is well positioned as a therapeutic target for FXS. We examined Brd4 throughout development and found it is upregulated in KO mice. Furthermore, inhibition of Brd4 function alleviates transcriptional disruptions observed in Fmr1 KO neurons and reverses behavioral phenotypes observed in KO mice. This work demonstrates that loss of FMRP results in widespread epigenetic misregulation and that targeting transcription can alleviate deficits in FXS.
RESULTS
FMRP targets include chromatin activators
We sought new approaches to understand and treat the underlying causes of FXS by examining FMRP targets identified by HITS-CLIP (Darnell et al., 2011) beyond the synaptic proteins that have thus far been the main focus in FXS (Figure 1A). Consistent with previous findings (Darnell et al., 2011), we found that in addition to transcripts associated with synaptic functions, a disproportionate number of the direct FMRP targets encoded chromatin and transcriptional regulators (Figure 1B–C, S1A, Table S1). Similarly Gene Set Enrichment Analysis (GSEA) using a ranked list of targets based on binding to FMRP, identified functional groups involved in chromatin regulation and transcription (Figure S1B).
Figure 1. FMRP targets include chromatin-associated proteins.
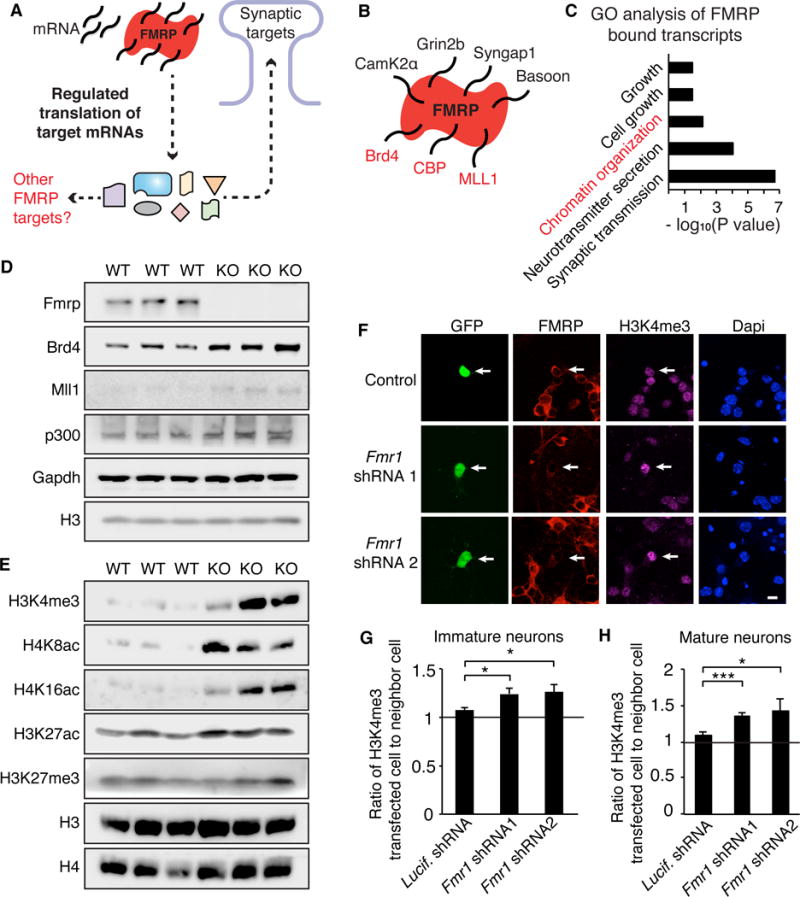
(A) Model of FMRP function in neurons. (B) Example of FMRP HITS-CLIP analysis and FMRP targets. (C) PANTHER gene ontology analysis of processes enriched in FMRP HITS-CLIP transcripts. (D) Western blot of chromatin-associated targets of FMRP from WT or Fmr1 KO cultured cortical neurons. (E) Western blot of histone modifications from WT or KO neurons. (F) H3K4me3 staining in neurons transfected with GFP and Fmr1 shRNA. (G, H) Quantification of H3K4me3 in transfected cell relative to the closest neighboring cell for immature (G) and mature neurons (H). For (G), n = 74, 41, and 51 neurons respectively for Luciferase shRNA, Fmr1 shRNA1, Fmr1 shRNA2 from 5 biological replicates. For (H), n = 47, 22, and 44 neurons from Luciferase, Fmr1 shRNA1, and Fmr1 shRNA2 from 4 biological replicates. *p<0.05, ***p<0.001, one-way ANOVA with post-hoc t-test. Scale bar is 10μm. Graphs show mean ± SEM. See also Figure S1, Table S1, and Table S4 for ANOVA values.
Curation of the 842 HITS-CLIP FMRP targets generated 110 targets that function in the nucleus, mainly to regulate transcription (Tables S1A–B). Of these, 44 are chromatin-associated proteins, primarily those related to histone acetylation and methylation (Table S1C). Using a gene ontology tool to examine known phenotype disruptions associated with these targets, we found that this subset is linked to abnormal nervous system development and brain morphology (Figure S1C). Furthermore, 25 of these chromatin-associated proteins have also been linked to ASD (Table S1C) (Darnell et al., 2011; Iossifov et al., 2012), suggesting they could contribute to the developmental deficits in FXS.
Because FMRP represses translation (Darnell et al., 2011), its loss can increase levels of target protein. Several chromatin-associated FMRP targets including Brd4, MLL1, and p300 are increased in cortical neurons cultured from Fmr1 knockout (KO) mice relative to wildtype (WT) (Figures 1D, S1D). We reasoned that if many such targets have converging functions in regulating histones, loss of FMRP could result in larger cumulative effects on histone modifications, particularly the methyl and acetyl marks regulated by multiple FMRP targets. Robust increases were detected in histone modifications associated with ‘active’ chromatin including H3 lysine 4 trimethylation (H3K4me3), H3 lysine 27 acetylation (H3K27ac), and H4 lysine 8 and 16 acetylation (H4K8ac and H4K16ac) (Figure 1E, S1E–F). In contrast, H3K27me3, associated with ‘repressive’ chromatin, was unchanged.
Because experiments were performed at 7 days in vitro (DIV) using young neurons lacking mature synapses, these changes are unlikely to be due to increased synaptic activation. However, to ensure these changes are not an indirect result of disruption of other FMRP functions such as network wide changes in secreted factors during neuronal maturation or FMRP’s function in regulating DNA damage repair early in development (Alpatov et al., 2014), we transfected a small percentage (<2%) of post-mitotic neurons with Fmr1 shRNAs. Neurons with transiently decreased FMRP have enhanced H3K4me3 compared to neighboring WT cells in both young and mature neurons (Figures 1F–H, S1G), demonstrating that this effect is cell-autonomous and not the result of developmental or network changes. Finally, we tested whether FMRP affects gross chromatin structure through FRAP of GFP-tagged linker histone 1 (H1). Knockdown of Fmr1 results in a small but significant increase in the mobile fraction of H1 (Figures S1H–I) suggestive of a more open chromatin structure and consistent with increases in modifications associated with active chromatin.
Widespread histone misregulation in Fmr1 knockout mice
We further explored aberrant chromatin regulation in FXS using chromatin immunoprecipitation and genome-wide sequencing (ChIP-sequencing) to examine gene occupancy of H3K4me3 (associated with active genes). In KO, H3K4me3 is increased at key neuronal genes including Nr4a1, an immediate early gene, and Shank2, which promotes spine formation and is linked to autism (Schmeisser et al., 2012), as well as throughout the whole genome with a two-fold increase in average abundance at transcription start sites (TSS) (Figures 2A–C). Both a second independent replicate and another mouse strain showed similar changes (Figures S2A–F). We similarly examined H3K27ac (associated with active or poised enhancers and genes) and we observed moderate increases in KO neurons (Figures S2G–L). KO neurons also had more genes with H3K4me3 peaks and H3K27ac peaks and genes with increases in both H3K4me3 and H3K27ac in KO were linked to nervous system development (Figures S2M–P) supporting a link between chromatin regulation and FXS.
Figure 2. ChIP-sequencing reveals increased H3K4me3 and H3K27ac in Fmr1 KO neurons.
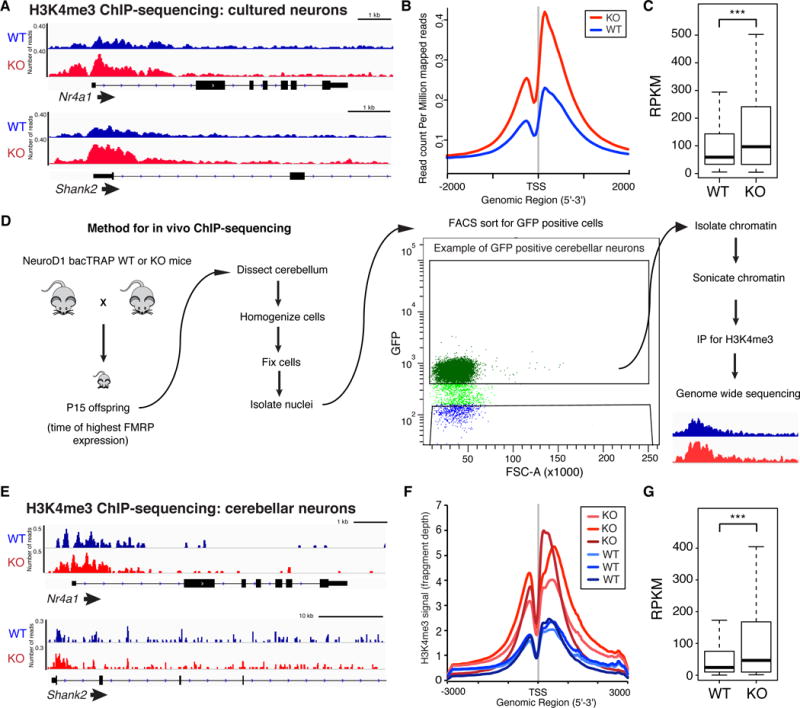
(A) H3K4me3 ChIP-sequencing gene tracks for WT and KO neurons. (B, C) H3K4me3 TSS occupancy (B) and RPKM values (C) for all genes in WT and KO neurons. (D) Method for in vivo ChIP-sequencing using cerebellar neurons from NeuroD1 bacTRAP mice. (E) H3K4me3 gene tracks for WT and Fmr1 KO mice. (F, G) H3K4me3 TSS occupancy (F) and RPKM values (G) for all genes in WT and KO cerebellar neurons from NeuroD1 bacTRAP mice. G is average of n = 3 replicates. ***p<0.001, two-sided paired t test. See also Figure S2.
We next examined whether these robust changes also occur in neurons in vivo using the bacTrap system (Heiman et al., 2014) (Figures 2D). We focused on H3K4me3, which showed greater disruption in KO, and, because of variability inherent between mice, repeated this for 3 independent replicates. Widespread increases in H3K4me3 were detected in KO, remarkably similar to cultured neurons (Figures 2E–G, Figures S2Q–R). Together these data (summarized in Table S2) reveal widespread increases in histone modifications associated with active transcription.
Aberrant transcription in FXS mice
Extensive changes in histone modifications imply that transcription may be also misregulated. Using RNA-sequencing, we observed robust changes in gene expression with more genes increased than decreased in KO neurons (Figures 3A–B). While this upregulation is consistent with increased histone modifications associated with open chromatin and active transcription, a concurrent decrease in other genes is also typically observed in response to global chromatin manipulations (Peart et al., 2005; Peixoto and Abel, 2013) likely due to downstream and compensatory effects of gene upregulation. As expected, gene expression was highly correlated with changes in H3K4me3 and H3K27ac levels (Figures S3A–F).
Figure 3. RNA-sequencing in Fmr1 KO neurons.
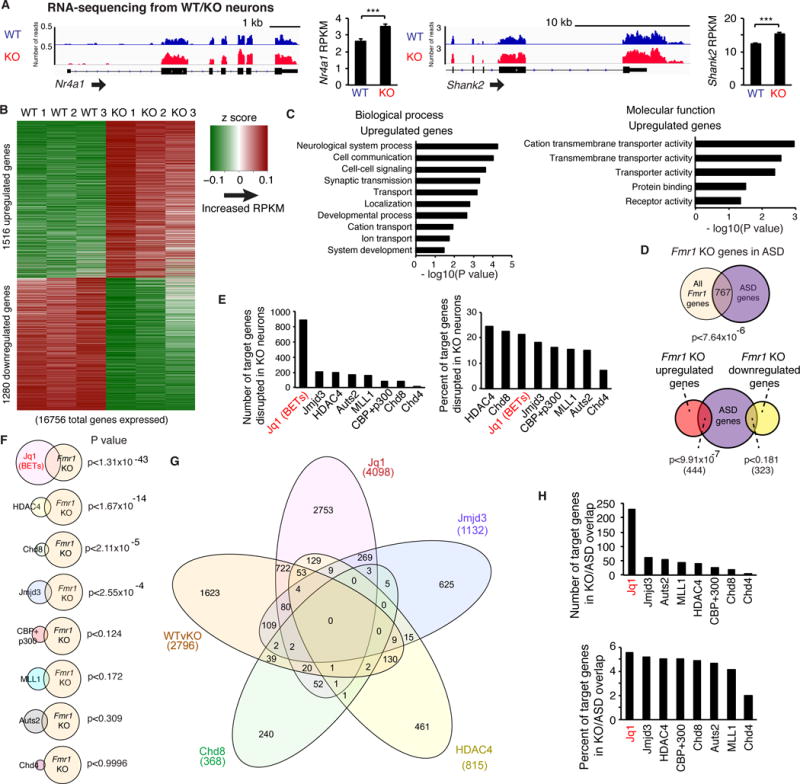
(A) Gene tracks and average RPKM for Nr4a1 and Shank2 in WT and Fmr1 KO cultured neurons. n = 3 replicates. (B) Z scores of significantly changed genes in Fmr1 KO neurons. (C) Gene ontology analysis of upregulated genes. (D) Overlap of KO misregulated genes with ASD linked genes. (E) Number and percentage of target genes of chromatin-associated proteins found in the FMRP HITS-CLIP analysis that overlap with KO misregulated genes. (F) Significance of the overlap. (G) Venn diagram of KO misregulated genes and target genes of all chromatin-associated proteins that show significant overlap with KO genes. (H) Number and percentage of target genes of chromatin-associated proteins that overlap with KO misregulated genes also linked to ASD. ***p < 0.001, DESeq adjusted p value. Overlap p values, hypergeometric test. Graphs in A show mean ± SEM. See also Figure S3 and Table S2.
Interestingly, upregulated genes include synaptic proteins and receptor proteins (Figure 3C). This suggests that aberrant expression of key neuronal genes could contribute to synaptic alterations underlying the disorder. In addition, genes that were upregulated in Fmr1 KO neurons were typically high expressers, demonstrating that highly expressed neuronal genes can be even further upregulated in KO (Figures S3G–I). Downregulated genes include transcriptional regulators which may indicate a compensatory cellular response to overactive transcription (Figure 3SJ). While variability is apparent between replicates, principle component analysis indicates greater differences between WT and KO neurons than within groups (Figure S3K). Finally, we asked whether genes that are misregulated in FXS mouse neurons are also linked to ASD. We observed a highly significant overlap between genes misregulated in FXS and autism susceptibility genes, particularly for FXS up-regulated genes (Figure 3D). This further suggests that gene misregulation, particularly gene expression increases resulting from the loss of FMRP regulation of epigenetic regulators, contributes to neuronal dysfunction.
To assess the contribution of the chromatin-associated targets of FMRP to misregulation of gene expression in KO neurons, we compared genes regulated by these chromatin proteins to genes disrupted in KO neurons. Using published datasets (described in Table S3C), we analyzed the number, percentage, and significance of the overlapping gene groups (Figure 3E–G). Notably, genes disrupted by the inhibitor JQ1, which inhibits Bromo- and Extra-Terminal domain (BET) proteins including the FMRP target Brd4 (rank 521/842; Darnell et al 2011), showed a high degree of overlap by all these measures. Similar results were obtained when specifically examining only the subset of misregulated KO genes that are also associated with autism (Figure 3H).
We repeated this analysis with many of the known transcription factor targets of FMRP and found that a subset of these transcription factors also targeted many of the genes disrupted in KO (Figures S3L–N). Together, these data indicate that FMRP regulates transcription by exerting translational control over transcriptional regulators. Furthermore, both chromatin-associated proteins and transcription factors that are targets of FMRP likely contribute to the aberrant transcription occurring in FXS, with some targets, such as Brd4, being key contributors.
Brd4 is increased in FXS mice
We next asked whether chromatin-associated proteins regulated by FMRP are viable targets for treating FXS, focusing on Brd4. As a transcriptional regulator, Brd4 is well positioned to be a major player and viable target in the context of FXS for several reasons. First, synaptic transcripts are increased in FXS (Figure 3C) and loss of Brd4 decreases expression of synaptic genes (Bagley et al., 2014; Korb et al., 2015). Second, JQ1 decreases seizure induction (Korb et al., 2015) and both FXS patients and mice have increased seizure activity (Musumeci et al., 2000). Third, Brd4 binds the acetylated histone marks that are increased in KOs (Figure 1E), and then recruits other proteins to promote transcriptional initiation (Jang et al., 2005; Liu et al., 2013), elongation (Kanno et al., 2014), and acetylation of additional histone residues (Devaiah et al., 2016). Fourth, BET inhibitors have particularly robust effects on the most highly expressed genes (Lovén et al., 2013) and FXS upregulated genes are mainly higher expressers (Figure S3G). Fifth, Brd4 interacts with numerous other chromatin-associated FMRP targets and their family members such as Chd4, Nsd3, Jmjd5 and Chd8 (Rahman et al., 2011; Shen et al., 2015). Thus, Brd4 can act as a hub for multiple FMRP targets and its inhibition has the potential to affect the function of multiple targets. Finally, even if multiple histone modifications are misregulated in FXS and cannot all be effectively corrected, inhibiting a ‘reader’ protein such as Brd4 that largely acts downstream of critically-important histone modifications could still effectively dampen the transcriptional output of misregulated genes.
We first sought to confirm that Brd4 is regulated by FMRP during neuronal development. In WT, Brd4 protein expression decreases as neurons mature (though still is abundant in adults (Korb et al., 2015)) while Brd4 mRNA changes only gradually (Figures 4A, S4A–B) suggesting a mechanism involving regulation of protein levels. Furthermore, the decrease in Brd4 protein occurs when FMRP expression peaks (Figure 4B). While Brd4 also decreases in KO neurons during development (Figure 4C, S4B), direct comparisons indicate that KO neurons have more Brd4 at early developmental time points (Figures 1D, 4D–E, S4C). Elevated Brd4 expression is also observed in KOs in vivo in young adult brains (Figures 4F–J, S4D–E) supporting a model in which FMRP inhibits translation of Brd4. To determine whether greater Brd4 levels correlate with increases in activated Brd4, we examined phosphorylated Brd4, which occurs in neurons in response to Casein Kinase 2 activation and results in increased targeting of Brd4 to chromatin (Korb et al., 2015). While little phosphorylated Brd4 is detected in WT neurons in the absence of exogenous stimulation, KO neurons exhibit robust phosphorylated Brd4 (Figures S4F–H). Finally, using Brd4 ChIP-qPCR we found increased promoter occupancy at Brd4 target genes in KO neurons (Figures S4I–L). Thus, we conclude that Brd4 is upregulated in FXS mice and shows increased binding to target genes in KO neurons, supporting the potential of Brd4 as a target for reversing transcriptional changes that occur in Fmr1 KO neurons.
Figure 4. Brd4 expression in WT and Fmr1 KO.
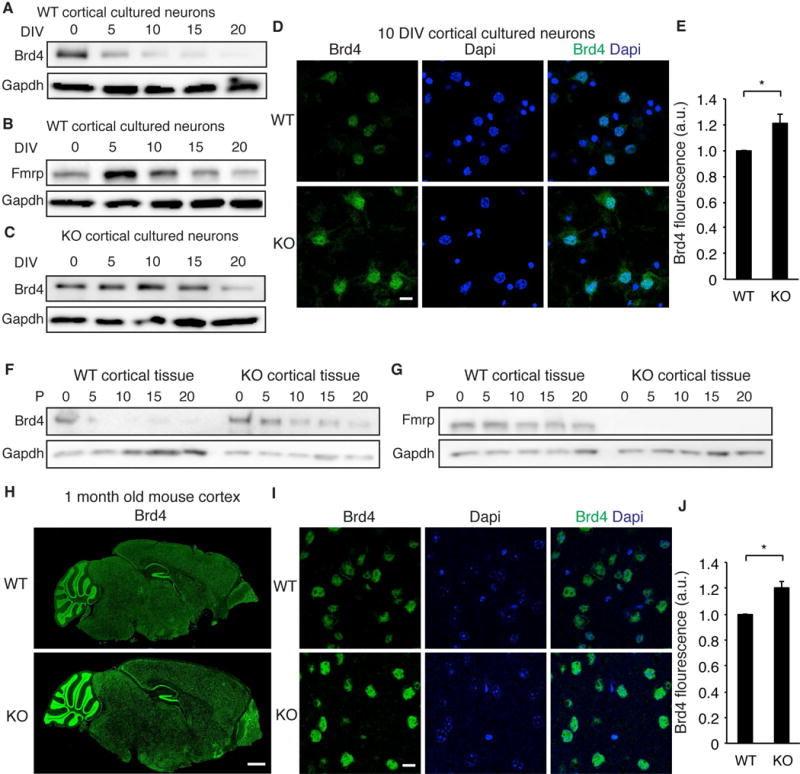
(A, B) Brd4 (A) or FMRP (B) protein expression at increasing days in vitro (DIV) in WT neurons. (C) Brd4 protein expression at increasing DIV in KO neurons. Blots are representative of 3 biological replicates. (D) Brd4 staining in WT and KO neurons at 10 DIV. (E) Quantification of Brd4 staining in WT and KO neurons. n = 87 and 69 neurons for WT and KO from 3 biological replicates. (F, G) Brd4 (F) and FMRP (G) protein expression in WT and KO cortical tissue. Representative of 3 biological replicates. (H) Brd4 staining of 1 month old WT and KO sagittal brain slices. (I, J) High magnification (I) and quantification (J) of Brd4 staining in cortex of WT and KO mouse brains. n = 137 and 176 neurons for WT and KO from 3 brains each. Scale bars are 10μm in D and I, and 1mm in H. ***p < 0.001, unpaired t test. a.u., arbitrary units. Graphs show mean ± SEM. See also Figure S4.
Effects of JQ1 on Fmr1 KO neurons
To determine if inhibition of Brd4 is a viable means of alleviating epigenetic misregulation in FXS, we used RNA-sequencing to examine the effects of JQ1 in KO neurons. As expected, JQ1 caused widespread changes in gene expression (Figures 5A–B, S5A). Remarkably, every significantly enriched gene group that is upregulated in KO neurons was downregulated by JQ1 (Figure 5C). JQ1 upregulated fewer functional groups but these similarly corresponded to KO downregulated genes (Figure 5C, full analysis in Table S3D–E). In addition, the specific genes downregulated by JQ1 significantly overlapped with KO-upregulated genes and vice versa (Figure 5D). JQ1 downregulated genes show little overlap with FMRP target proteins indicating JQ1 has a greater effect on gene expression changes occurring downstream of FMRP chromatin-associated targets than it does on the targets themselves (Figure 5E, S5B).
Figure. 5. Effects of JQ1 on KO neurons.
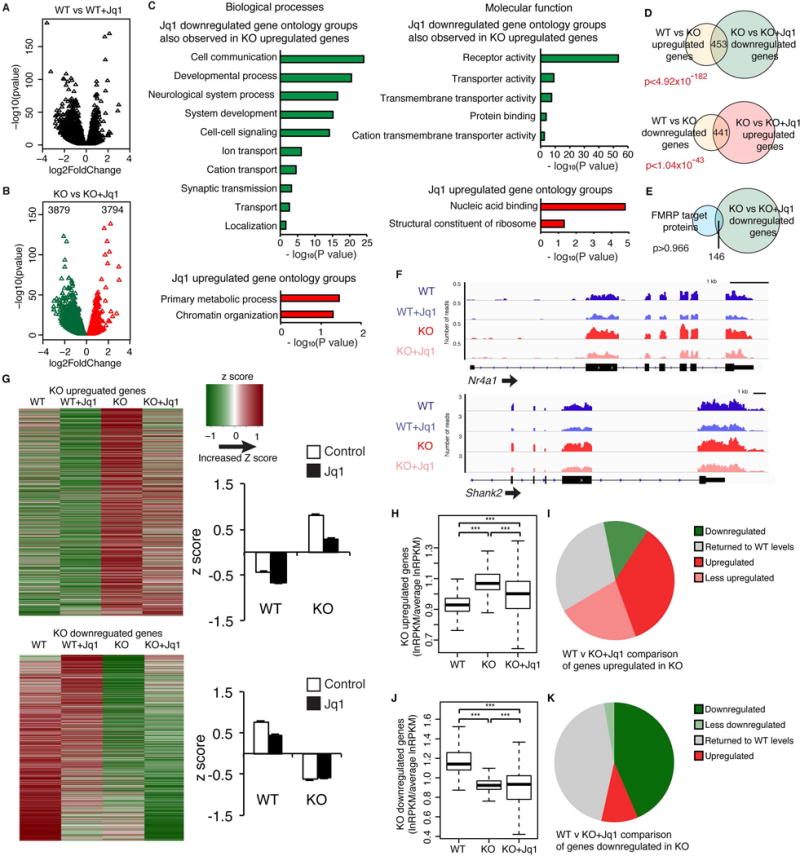
(A, B) Volcano plot of JQ1-regulated genes in WT (A) and KO (B) neurons. (C) Gene ontology groups disrupted in KO that are oppositely regulated after JQ1 treatment of KO. (D) JQ1 downregulated genes significantly overlap with KO upregulated genes and vice versa. (E) JQ1 downregulated genes do not significantly overlap with FMRP target genes. (F) Gene tracks in WT and KO neurons with JQ1 treatment. (G) Heat map and box plot of z scores of up and downregulated KO genes with JQ1 treatment. (H, J) Box plot of the effects of JQ1 on the relative RPKM values of genes that are up (H) and down (J) in KO neurons. (I, K) JQ1-induced changes in KO neurons for genes that are up (I) and down (K) in KO neurons. n = 3 biological replicates. ***p > 0.001, ANOVA with post hoc paired two-sided t-test. Overlap p values, hypergeometric test. Graphs in G show mean ± SEM. See also Figure S5, Table S3, and Table S4 for ANOVA values.
To further investigate the extent to which JQ1 reverses changes occurring in KO neurons, we examined specific gene tracks (Figure 5F) and confirmed by western blot and qRT-PCR that JQ1 treatment decreased the expression of Brd4 target genes (Figures S5B–F). Expanding our analysis to all genes disrupted in KO demonstrated that JQ1 decreases expression of many genes upregulated in KO neurons, by examining Z scores and relative changes in RPKM values (Figure 5G–H). We further categorized KO-upregulated genes after JQ1 treatment as returning to WT levels, increased compared to WT, still increased but less so than without JQ1, or downregulated relative to WT. While many of the misregulated genes were still differentially expressed after JQ1 treatment, the majority of genes were downregulated to some degree (Figure 5I). Many KO downregulated genes also return to normal levels after JQ1 treatment though others were further decreased (Figure 5J–K).
We next sought to confirm that the changes in gene expression in KO (and reversals seen with JQ1) were due to FMRP’s chromatin-associated targets rather than long-term disruptions to neurodevelopmental processes or DNA-repair mechanisms (Alpatov et al., 2014). We therefore acutely infected post-mitotic neurons with viruses carrying Fmr1 shRNA. We found similar increases in expression of target genes to those seen in KO neurons (Figures S5G–K) and JQ1 again reversed these changes (Figures 5L–O). Interestingly, we found that within 24 hours of JQ1 washout, several target genes partly or fully returned to untreated levels (Figures S5P–S) indicating that JQ1 blocks BET action on transcription while present but does not cause irreversible changes in neurons.
To determine whether similar effects occur with another drug that decreases transcription, we tested THZ1, an inhibitor of CDK7 (Kwiatkowski et al., 2014), which, like Brd4, is involved in transcription initiation. While THZ1 treatment lead to decreased expression of some KO upregulated genes, it also had unexpected opposing effects on important neuronal genes including Shank2 and Nr4a1 (Figures S6T). Notably, the functional gene groups significantly regulated by THZ1 showed little overlap with KO misregulated gene groups demonstrating that, as expected, the effects of THZ1 were not specific to the transcriptional changes occurring in Fmr1 KO neurons (Table S3F). While THZ1-downregulated genes significantly overlapped with KO-upregulated genes, unlike JQ1, THZ1-upregulated genes did not significantly overlap with KO-downregulated genes (Figures S5U). GSEA mapping of the KO gene signature onto a ranked list of JQ1 or THZ1 regulated genes shows that genes upregulated in Fmr1 KO mainly fall in the region with the greatest fold change decrease after JQ1 treatment (Figures S5V). Conversely, they fall in regions of both increased and decreased expression after THZ1 treatment. The KO downregulated genes map to both increased and decreased JQ1 expression, in accordance with our analysis that JQ1 is less effective in reversing the misregulation of these genes (Figure 5G). However, the KO downregulated genes are seen mainly in THZ1 downregulated genes, indicating their expression is even more disrupted after THZ1 treatment. These analyses and qRT-PCR confirming these results (Figures S5W–Z) indicate less specificity with THZ1 treatment.
Effects of JQ1 on mouse behavior
Given that JQ1 reverses transcriptional changes in KO, we reasoned that it may reverse some of the functional deficits observed in FXS if the transcriptional changes are important for the underlying disease mechanism and phenotype. We therefore tested the effects of JQ1 on cellular deficits in FXS by examining the well-known phenotype of FXS increased spine number. While this phenotype may be assay-dependent (He and Portera-Cailliau, 2013), we observed enhanced spine number after allowing KO neurons to mature in culture and found that JQ1 reduced this to WT levels (Figures 6A–B).
Figure 6. Effects of JQ1 on FXS phenotypes.
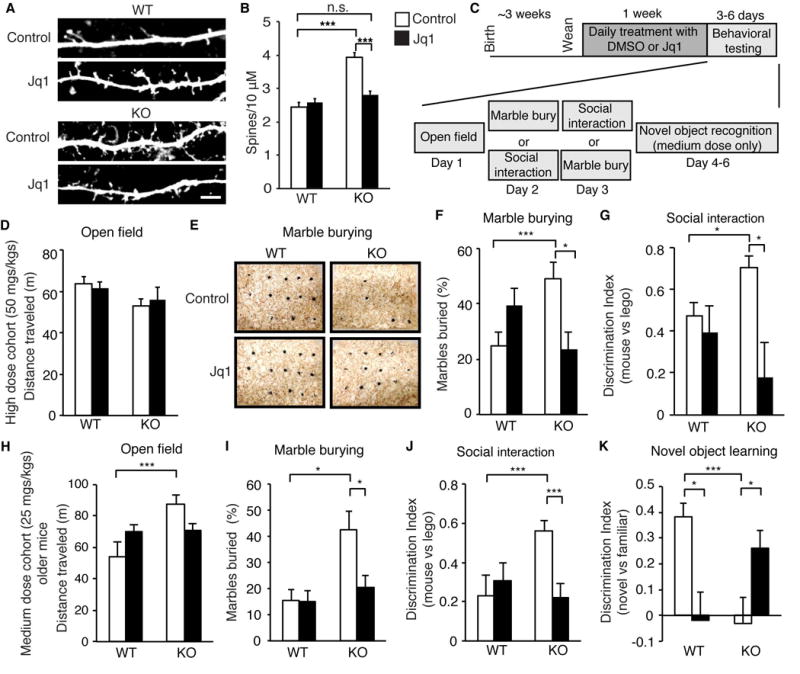
(A, B) Dendrites (A) and spine number (B) of WT or KO neurons transfected with GFP and treated with JQ1 for 24 hours. n = 68, 66, 80, 77 for WT, KO, WT+JQ1, KO+JQ1 from 2 biological replicates. (C) Behavioral testing paradigm. (D, H) Total distance traveled over 1 hour in open field for high dose cohort (D) or medium dose older cohort (H). (E) Examples of marble burying assay. (F and I) Number of marbles fully buried in 15 minutes for high dose cohort (E) or medium dose older cohort (H). (G and J) Social interaction testing as measured by the relative preference for a mouse or Lego for high dose (G) or medium dose older cohort (J). (K) Novel object recognition testing one day after initial exposure to objects. For high dose cohort n = 8 to 10 mice per condition. For medium dose older cohort older subset n = 6 to 8 mice per condition. Scale bar is 10μm. *p < 0.05, ***p < 0.001, two-way ANOVA with post hoc paired two-sided Student’s t-test. Graphs show mean ± SEM. See also Figure S6 and Table S4 for ANOVA values.
We next tested the effects of JQ1 on behavior after one week of treatment (by I.P. injection of 50 mgs/kgs) (Figure 6C). No changes were observed in open field activity (Figure 6D, S6A). Using marble burying to measure perseverative and repetitive behavior, we found that KO mice buried more marbles than WT mice but JQ1 treatment reversed this phenotype, returning the number to WT levels (Figure 6E–F). We also examined social behavior and found that KO mice showed an enhanced preference for a mouse relative to an object, similar to previous findings (Spencer et al., 2005). JQ1 treatment reduced KO preference to WT levels without affecting overall movement and exploratory time (Figure 6G, S6B–C). In some tests (Figure 6F), we observed nonsignificant trends toward behavior changes in WT mice treated with JQ1. This is consistent with recent work suggesting that BET-inhibition can cause autism-like phenotypes in WT mice (Sullivan et al., 2015) and supports a model in which the ‘correct’ amount of Brd4 is needed for optimal neuronal function with potential deficits arising from altered levels of Brd4. In addition, RNA isolated from cortical tissue after behavioral testing confirmed that genes overexpressed in KO neurons returned to WT levels with JQ1 treatment (Figures S6D–G).
Because high doses of JQ1 can disrupt processes such as immune system function and memory formation (Belkina and Denis, 2012; Korb et al., 2015) and total loss of Brd4 function causes widespread toxicities (Bolden et al., 2014), we performed a more extensive tissue analysis to determine whether such side effects occurred after our JQ1 treatment prardigm. We found that this high dosage of JQ1 disrupted immune cell development and caused epithelial hyperplasia but did not appear to affect morphology of the intestine (Figure S6H–P).
We therefore sought to determine if a lower dose of JQ1 (25 mg/kg) has similar beneficial effects in FXS mice and expanded the ages tested (to 4–8 weeks) to determine the necessity of treating mice early in development to achieve behavioral changes. The moderate dose of JQ1 recapitulated effects observed with the higher dose for the full cohort (Figures S6Q–V) and the subset of older mice (aged 6–8 weeks) (Figures 6H–J), including increased distance traveled by older KO mice. However, the side effects observed in non-neuronal tissues in response to the high dosage of JQ1 were greatly reduced with this moderate dosage (Figures S6H–P). Finally, we used a novel object recognition test to assess learning and memory deficits limiting this test to the medium-dose cohort because previous findings showed that high doses of JQ1 resulted in memory deficits in WT mice (Korb et al., 2015). We found that even this dose of JQ1 blocked object recognition in WT and, as expected, KO mice also cannot perform this task. Remarkably, JQ1 reversed this deficit in Fmr1 KOs without affecting overall movement and exploratory activity (Figures 6K, Figures S6W–Y). This suggests that JQ1 may restore physiologically relevant aspects of neuronal function in KO mice, which have overactive transcription and neuronal hyperexcitability. In contrast, in WT mice with normal levels of Brd4 and transcription, JQ1 has deleterious effects such as blocking memory formation. Together these data indicate that JQ1 can reverse neuronal deficits and behavioral phenotypes in FXS.
Combined low dose targeting of Brd4 reverses FXS deficits
In addition to inhibiting Brd4, JQ1 also inhibits the other BET family members potentially present in neurons, Brd2 and Brd3. We expect that Brd4 is the most relevant target in treating FXS as it is the only BET family member found to be a high confidence target of FMRP. However, we sought to confirm that targeting Brd4 alone is sufficient to recapitulate the effects of JQ1 and examined the extent to which Brd4 is sufficient to reproduce deficits present in FXS. We used two shRNA viruses to knock down Brd4 and found they recapitulated the effects of JQ1 in KO neurons (Figures S7A–E).
To demonstrate that Brd4 misregulation is a major contributor to the deficits underlying FXS in addition to the known synaptic targets, we overexpressed Brd4 in cultured WT neurons as well as a phospho-mimic form of Brd4 (Brd4-SSS492ESE), a constitutively active form of Brd4 highly associated with chromatin (Korb et al., 2015). Examination of FACS-sorted transfected neurons revealed that Brd4-SSS492ESE increased expression of key genes that are increased in Fmr1 KO neurons while Brd4 showed a trend toward increased expression (Figures 7A–B). In addition, the number of spines was increased in neurons with Brd4 and even more robustly increased with Brd4-SSS492ESE indicating that overexpression of Brd4, particularly activated Brd4, can recapitulate known phenotypes of FXS (Figure 7C–D, S7F–H). As overly active synapses are a hallmark of FXS, and synaptic activation increases Brd4 phosphorylation, these findings suggest that loss of FMRP has the potential to result in a feedback loop in which overabundant and active synapses in Fmr1 KO neurons result in over activation of the already highly abundant Brd4, which, in turn, increases transcription of key synaptic proteins further enhancing the deficit.
Figure 7. Combinatorial treatment targeting active Brd4 alleviates FXS phenotypes.
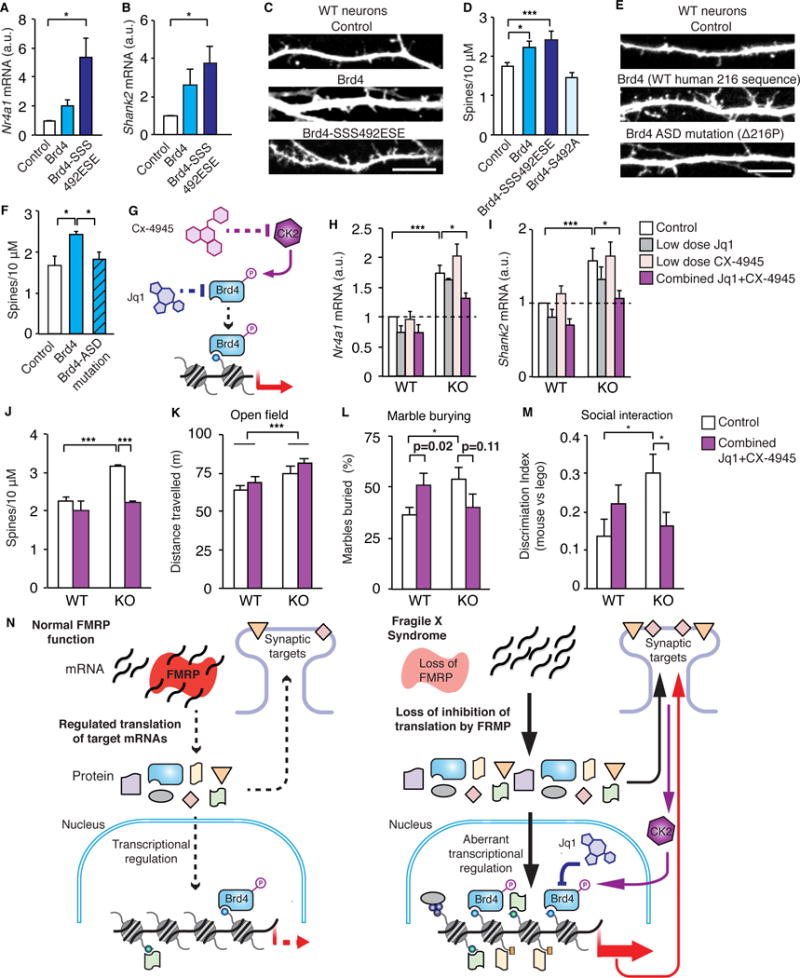
(A, B) Nr4a1 (A) and Shank2 (B) transcripts in sorted neurons transfected with Brd4 or Brd4-SSS492ESE. n = 5. (C, D) Dendrites (C) and spine number (D) of WT neurons transfected with GFP and Brd4, a phospho-mimic Brd4 (Brd4-SSS492ESE), or a phospho-mutant form of Brd4 (Brd4-S492A). n = 3 to 12 biological replicates with 5 to 10 neurons counted per replicate. (E, F) Dendrites (E) and spine number (F) of WT neurons transfected with GFP and Brd4 with either the WT human sequence surrounding amino acid 116 or the autism mutation of a proline deletion at position 116. n = 7 biological replicates per construct with 5 to 10 neurons counted per replicate. (G) Model of Brd4 activation and drug targets. (H, I) Nr4a1 (H) and Shank2 (I) transcript levels are decreased in response to combined low dose JQ1 and CX-4945, but not with either drug alone at low doses. n = 3 to 5 replicates per condition. (J) Low dose JQ1 + CX-4945 reverses the increase in spine number in KO neurons. N = 2 to 5 biological replicates. (K) Total distance over 1 hour in open field. (L) Number of marbles buried in 15 minutes. (M) Social interaction testing as measured by the relative preference for a mouse or Lego. N = 16 to 26 mice per condition. (N) Model of FMRP function in transcriptional regulation in neurons. FMRP targets include chromatin-associated proteins in addition to synaptic proteins. Loss of FMRP in FXS results in misregulation of chromatin-associated proteins, histone modifications, and transcriptional output. Brd4 inhibition alleviates transcriptional and phenotypic changes in FXS. Scale bar is 10μm. *p < 0.05, ***p < 0.001. For A-F: one-way ANOVA, for H-M: two-way ANOVA, with post hoc paired two-sided Student’s t-test. a.u., arbitrary units. Graphs show mean ± SEM. See also Figure S7 and Table S4 for ANOVA values.
We also examined the effect of an autism-susceptibility mutation in Brd4 (Iossifov et al., 2012). We expressed Brd4 containing either the normal human amino acid sequence in the region surrounding the mutation site or Brd4 containing a proline deletion associated with ASD. We found that the ASD mutation blocked the Brd4 induced increase in spine formation indicating that it prevents Brd4 function in regulating neuronal synapses (Figures 7E–F). These data suggest that an overabundance and over-activation of Brd4 (in FXS) or mutations in Brd4 (in an ASD patient) can result in neuronal dysfunction.
Based on these findings, we hypothesized that by combining inhibition of both Brd4 and the kinase that activates Brd4, Casein Kinase 2 (CK2), we could more specifically target active Brd4. This treatment is unlikely to affect Brd2 or Brd3 as we previously found that unlike Brd4, neither of these BET proteins are targeted to chromatin in response to synaptic stimulation via CK2 (Korb et al., 2015). Furthermore, we speculated that it may be possible to use very low concentrations of these drugs such that neither would have significant effects alone but a synergistic effect could be observed specifically where the two pathways intersect and are most active (Figure 7G), namely in cells such as Fmr1 KO neurons that have both over abundant and over activation of Brd4. This approach, recently shown to be promising in cancer cells (Lian et al., 2017), has the potential to limit effects in non-target tissues and decrease potential toxic side effects of either drug.
To determine if such inhibitors could potentially act synergistically, we determined the concentrations of JQ1 and the CK2 inhibitor CX-4945 that had minimal effects on targeted genes (Figures 7SI–J). While neither drug had major effects alone at these concentrations, together they were able to significantly decrease expression of key genes that are increased in FXS (Figures 7H–I, S7K–L). Furthermore, the combination decreased spine density in KO neurons (Figures 7J). To ensure that this combination is acting on phosphorylated Brd4, we tested its effects on the phospho-mimic form of Brd4 which cannot be deactivated and found that unlike a high dose of JQ1, this treatment could not reverse the effects of Brd4-492ESE on spine density (Figures S7M–N).
Finally, we examined behavior using these inhibitors. We first performed a small pilot experiment to test very low doses of JQ1 or CX-4945 (similar to doses that had minimal effects in culture) and found that when used alone, neither drug had discernible effects on behavior in WT or KO mice at this dosage (Figures S7O–R). We next tested them in combination and found that while KO hyperactivity was unaffected (Figure 7K), this treatment reversed the abnormalities in social interactions and returned marble burying in KO mice to WT levels (although the decrease in marble burying was not significant compared to DMSO treated KO mice) (Figures 7L–M, S7S–U). We found no evidence of toxic effects of this treatment paradigm in other tissues (Figure S6H–P). Together, these data indicate that targeting Brd4 or the phosphorylated form of Brd4 reverses some of the deficits observed in FXS.
DISCUSSION
Our study documents that FMRP regulates chromatin-modifying proteins in addition to synaptic proteins and that this action is physiologically important in FXS and potentially a clinically relevant pharmacological target. Fmr1 KO neurons have an overabundance of histone marks associated with active chromatin such as H3K4me3 in vitro and in vivo. Corresponding widespread changes in transcription occur in Fmr1 KO neurons, with more genes increasing in expression than decreasing. These observations suggest a normal role for FMRP in regulating transcription via specific actions on chromatin modifiers. In particular, Brd4 is overexpressed in Fmr1 KO mice and using JQ1 to inhibit Brd4 reduced gene expression of critical genes in Fmr1 KO neurons. JQ1 also reversed behavioral phenotypes of KO mice, as did a combination of JQ1 and CX-4945 to inhibit activated Brd4, demonstrating that decreasing transcription by targeting chromatin associated proteins may be beneficial in treating FXS. Our working model indicates that, in addition to FMRP’s known role in targeting key synaptic proteins, it also plays a direct and physiologically relevant role in regulation of chromatin-associated proteins. This points toward a cooperative effect on FXS phenotypes at the transcriptional and synaptic levels and reveals an unprecedented translational and transcriptional synergy underlying and enhancing the impact of FMRP loss.
In Fmr1 KO neurons, we observe surprisingly robust increases in a range of histone modifications that we propose result from misregulation of FMRP target proteins. Alternatively, the synaptic dysfunction and resulting hyperexcitability that occurs in FXS (Gibson et al., 2008) could lead to increases in activity-responsive histone modifications such as H4K8ac, H4K16ac and H3K27ac (Peixoto and Abel, 2013). However, we do not expect that changes in synaptic activation account for the majority of the observed changes in these marks because robust increases were detected in immature neurons that lack extensive synaptic connectivity. Another alternative explanation is a role for FMRP in regulating chromatin during the DNA damage response (Alpatov et al., 2014). However, this function appears to be more important in gametogenesis and specific to γH2A.X regulation whereas changes in histone modifications we observed in KO neurons occurred even transient loss of Fmr1 in post-mitotic neurons. Thus, this role of FMRP is unlikely to explain the widespread epigenetic misregulation we observed. Finally, while we observed changes in KO genes expression by RNA-sequencing, these data do not distinguish between changes in transcription and changes on transcript stability which may result from possible interactions between FMRP and Argonaute (Caudy et al., 2002; Jin et al., 2004; Kenny et al., 2014). However, given the correlation between gene expression changes and changes in histone modifications at those genes, as well as the ability of JQ1 to reverse changes in transcript expression, chromatin regulation is likely a key player in these alterations.
The effects of JQ1 on Fmr1 KO neurons are reminiscent of several of the other notable reversals of phenotypes in FXS. When Fmr1 KO mice are mated with Tsc2+/−, Cpeb−/−, or mGluR+/− mice, all of which have opposite synaptic or functional deficits of FXS mice, the mice that carry both mutations appear normal (Auerbach et al., 2011; Thomas et al., 2011; Udagawa et al., 2013). Another promising therapy involved activating the inhibitory GABAB receptor to correct the imbalance between excitatory and inhibitory signaling (Henderson et al., 2012). These studies suggest that by counteracting the problems that result in neuronal deficits, it is possible to effectively rebalance the neuron and restore normal function. Instead of targeting translation or synaptic signaling, we sought to rebalance the system at the level of gene transcription. While epigenetic targets have previously been used in FXS with the aim of reactivating the methylated Fmr1 locus to restore FMRP expression, such attempts have generally been unsuccessful at reactivating the Fmr1 gene. Based on our model, this approach could potentially worsen the underlying problem of overabundant transcription occurring in FXS as it relies on drugs that will likely enhance transcription. Our model suggests that both synaptic and transcriptional misregulation likely contribute to deficits in FXS and create a feedback loop exacerbating neuronal dysfunction (Figure 7N). Thus, we favor the view that is a cooperative effect on the phenotype at the transcriptional and translational level and that breaking this feed-forward signaling may be crucial in treating the disorder.
The success of our approach using a drug that dampens transcriptional output may provide new avenues of treatment, as there are numerous drugs that target transcriptional regulators and some, including analogs of JQ1 and CK2 inhibitors, are currently in clinical trials for cancer. This approach also raises the possibility of using epigenetic regulating drugs in autism. Many of the chromatin regulating proteins that are targets of FMRP are also autism susceptibility genes. However, while these proteins are most likely upregulated in FXS, the mutations found in some ASD patients could result in either increased or decreased expression or function. In support of this concept, we find that an ASD-susceptibility mutation in Brd4 prevented normal Brd4 function (Figure 7E–F). In addition, in cases where neuronal dysfunction results from loss of a chromatin-associated protein that typically promotes transcription, or from causes unrelated to transcriptional regulation, JQ1 could potentially worsen neuronal function. In fact, our work supports a model in which neurons require highly regulated epigenetic control of gene expression and any perturbations from such tight transcriptional homeostasis could be detrimental. However, it is possible that for a subset of ASD patients, aberrant transcriptional upregulation may contribute to the disorder and treatments using inhibitors that target transcription may be beneficial. For a disorder as heterogeneous as ASD, it will be necessary to identify and understand the underlying cause for a specific patient before considering such treatments.
While analogs of JQ1 are currently in clinical trials for cancer, using these drugs in a young patient population may present particular challenges. We found that higher doses of JQ1 that correspond to doses used for cancer studies cause defects in non-neuronal systems in immune cells and the epidermis. Brd4 is particularly critical in dividing cells so its use early in development may result in more side effects than treatment in adults. Alternatively, mouse studies indicate that if FMRP expression is rescued even later in development, deficits are at least partly alleviated (Gantois et al., 2001; Peier et al., 2000). Our study found that JQ1 treatment was effective in young adult mice so it may also be possible to begin treatment later and still achieve some benefits. Our studies sought to determine a dosage with fewer systemic side effects that still targeted the overabundant transcription occurring in the brain, suggesting a possible therapeutic window that could have beneficial effects without major toxicities. To that end, we also demonstrate that a low dosage of JQ1 given in combination with a low dose of a CK2 inhibitor, successfully reversed phenotypes of FXS without any observable side effects. Our study underscores the importance of proper chromatin regulation in neurodevelopment and reveals that widespread epigenetic misregulation is an important factor in understanding and treating FXS.
STAR Methods
LEAD CONTACT FOR REAGENT AND RESOURCE SHARING
Further information and requests for resources and reagents should be directed to and will be fulfilled by the Lead Contact, C. David Allis (alliscd@rockefeller.edu).
EXPERIMENTAL MODEL AND SUBJECT DETAILS
Cortical neurons were dissected from embryonic WT or KO (Fmr1tm1Cgr) mice at E16.5, dissociated in Optimem media with 20mM glucose and plated on poly-D-lysine (Millipore, A-003-E, 50μg/mL) coated plates at 600,000 cells per mL. After one hour, media was replaced with Neurobasal media (Gibco) supplemented with Pen/Strep, Glutamax, and B27 supplement. Cells were grown at 37° C and AraC was added to the media at 3 DIV to prevent glial cell growth. C57BL/6 mice were used for most experiments except for ChIP-sequencing from cultured neurons for which FVB mice were used to test strain differences. Neurons from multiple mouse embryos from a single pregnant female mouse (including both male and female embryos) were combined for experiments. Neurons were typically used at 7 DIV for experiments. When mature neurons were required, 12 DIV neurons were used.
For ChIP-seq experiments from cerebellar tissue, C57B/6 Fmr1tm1Cgr mice and NeuroD1 bacTRAP (ND1-BT) were used to generate Fmr1 KO ND1-BT mice. Briefly, Fmr1−/− mice were bred with ND1-BT+/− mice. (ND1-BTs don’t breed well as homozygotes). The Fmr1−/+ ND1-BT−/+ female mice were then bred with Fmr1−/y male mice to generate Fmr1−/− ND1-BT−/+ mice which are used for experiments.
All animal experiments were approved by the Institutional Animal Care and Use Committee of the Rockefeller University. WT or KO (Fmr1tm1Cgr) male mice on a C57BL/6 background were used for all behavioral testing and mice were housed up to 5 mice per cage in a 12 hour light/dark cycle. Mice were used for treatments and testing between 3 and 8 weeks of age.
METHOD DETAILS
Treatments, transfections and DNA constructs
Neurons were treated for 24 hours (unless otherwise stated) with (+)JQ1 (Caymen Chemical 11187, 250 nM unless otherwise stated, low dose JQ1 is 50nM, (-)JQ1 (Caymen Chemical 11232, 250 nM), THZ1 (chemscene CS-3168, 250nM), and CX-4945 (APExBIO A8330, 50nM unless otherwise stated). When JQ1 and CX-4945 were used in combination in culture, both were used at 50nM.
Transfections were performed using Lipofectamine 2000 (Life Technologies). Neurons were put in a 1mM kynurenic acid solution during transfection to prevent excitotoxicity. Lipofectamine and DNA complexes were left on neurons for 15 minutes. All constructs used for transfections were previously described (Korb et al., 2015). For FACS experiments, transfections were performed at 6 DIV and sorted 5 days later.
The GFP-Brd4 construct was a gift from Dr. K. Ozato. The Brd4-SSS492ESE and Brd4-S492A mutations were previously described (Korb et al., 2015). To examine the autism susceptibility mutation in Brd4, we used this construct to create a form of Brd4 that contains the WT Brd4 human sequence surrounded the mutation site at amino acid 116 (including a P113Q change and deletion of one proline at 116). The autism mutation was then added which involved deletion of an additional proline at 116. These constructs were transfected at 5 to 7 DIV and neurons were fixed 5 days after transfection. For experiments involving drug treatments of WT and KO neurons, neurons were transfected at 12 DIV, treated with JQ1 or JQ1+CX-4945 one day after transfection and then fixed one day later for visualization.
shRNA plasmids in the pLKO.1 vector were ordered from Sigma (Fmr1 Sigma MISSION shRNA Plasmid DNA TRCN0000308675 and TRCN0000308741, and Brd4 Sigma MISSION shRNA Plasmid DNA TRCN0000311976 and TRCN0000088480). Viruses were generated in HEK293T cells and purified with PEG-it Virus precipitation solution (System Bioscience, LV810A-1). Viruses were added to neurons at 3 DIV for 16 hours and then cells were washed and returned to media. Experiments were performed 4 days after infection. shRNA sequences are:
Luciferase shRNA: CCGGCGCTGAGTACTTCGAAATGTCCTCGAGGACATTTCGAAGTACTCAGCGTTTTT
Fmr1 shRNA1: CCGGCGCACCAAGTTGTCTCTTATACTCGAGTATAAGAGACAACTTGGTGCGTTTTTG
Fmr1 shRNA2: CCGGCCACCACCAAATCGTACAGATCTCGAGATCTGTACGATTTGGTGGTGGTTTTTG
Brd4 shRNA1: CCGGGATGTGTTTGAAATGCGCTTTCTCGAGAAAGCGCATTTCAAACACATCTTTTTG
Brd4 shRNA2: CCGGGCGGCAGCTAAGTCTAGATATCTCGAGATATCTAGACTTAGCTGCCGCTTTTTG
Western blotting
Cells were lysed in RIPA buffer and lysates were separated by SDS-PAGE and transferred to PVDF paper. Antibodies used were FMRP (Cell signaling 4317S, 1:1000), Brd4 (Bethyl A301-985A, 1:1000), phospho-Brd4 (developed with Millipore, described in (Korb et al., 2015), 1:500), p300 (sc-585, 1:300), MLL1 (Bethyl A300-374, 1:500), Gapdh (Abcam ab8245, 1:500), GluA1 (Millipore MAB2263, 1:500), Shank2 (Cell Signaling 12218, 1:500), BDNF (Abcam ab88901, 1:500), CaMK2alpha (Millipore 05-532, 1:500), H3 (Abcam ab1791, 1:4000), H4 (Abcam ab10158, 1:4000), H3K4me3 (Active motif 39159, 1:3000), H4K8ac (Millipore 07-328, 1:1000), H4K16ac (Active motif 39167, 1:500), H3K27ac (Active motif 39133, 1:1000), and H3K27me3 (abcam ab6002, 1:500). Western blots were quantified normalizing each lane by the Gapdh signal to control for loading differences.
Immunofluorescence and microscopy
Immunocytochemistry was preformed as previously described (Korb et al., 2015). For cultured neurons, slides were imaged on an inverted Lieca DMI 6000, TCS SP8 laser scanning confocal confocal microscope with a 405 nm laser and a fully tunable white light laser (470–670 nm) with an acousto-optical beam splitter. The microscope uses 3 gated HyD detectors and one PMT detector and both a conventional scanner and a resonant scanner. Objectives used were a 63× HC PL APO CS2 oil objective with a NA of 1.40. Type F immersion liquid (Leica) was used for oil objectives. Images were 184.52 by 184.52 microns, 1052 by 1052 pixels, (5.701 pixels per micron), and 8-bits per pixel. FRAP live cell imaging was performed similarly but images were 7.11 by 7.11 microns. Mobile fractions were calculated as (pre-bleach whole cell fluorescence)/(end whole cell fluorescence)*(ROI fluorescence after recovery – ROI fluorescence after bleach)/(ROI initial fluorescence – ROI fluorescence after bleach). The recovery time point was an average of 10 images between 90 and 100 seconds after bleaching to minimize effects of fluctuations in live cell imaging.
For immunohistochemistry, 4 week old male C47B/6 mice were perfused with 4% paraformaldehyde and brains were dissected and further fixed in paraformaldehyde overnight. Tissue was then washed in PBS and embedded in paraffin at the Molecular Cytology Core Facility of Memorial Sloan Kettering Cancer Center using a Leica ASP6025 tissue processor. Sagittal sections of 5 microns were cut on a Leica RM2155 microtome and then baked on slides for 1 hour at 60°C followed by de-paraffinization and staining using a Discovery XT processor (Ventana Medical Systems). Sections were blocked for 30 minutes in 10% normal goat serum and 2% BSA in PBS. Brd4 antibody (Bethyl A301-985A, 2μg/mL) was added for 5 hours, followed by 60 minutes incubation with biotinylated goat anti-rabbit IgG (Vector labs PK6101, 1:200). Detection was performed with Streptavidin-HRP D (Ventana Medical Systems) followed by incubation with Tyramide-Alexa Fluor (Invirogen T20948, 1:200). High magnification of sagittal slices (used for quantification) were taken as described above. Low magnification images were taken on a Keyence BZ-X700 inverted fluorescent microscope at 4× magnification with Nikon CF160 series infinite optical system at 96 pixels per inch and 32 bits per pixel.
ImageJ was used to crop images and merge channels into composite RGB images. Photoshop was used to adjust individual channels. In all cases, for each separate channel, identical adjustments were applied across all images shown for each experiment. DAPI images were processed separately from other channels. No deconvolution software was used. All image analysis was performed in ImageJ. (Additional information about quantification of images is described in the Quantification and Statistical analysis section.)
Chromatin immunoprecipitation
For ChIP from cultured neurons, neurons were cultured for 7 DIV from either C57B/6 mice (Figures 2A–C, Supplemental Figures A–C) or FVB mice (Supplemental Figures D–L) and fixed for 5 minutes with 1% PFA in PBS and then the reaction was quenched with 2.5M glycine. Cells were then washed twice and collected in PBS with protease and phosphatase inhibitors and then pelleted at 1200 rpm for 5 minutes. Cells were then rotated in lysis buffer 1 (50mM HEPES-KOH pH 7.5, 140mM NaCl, 1mM EDTA, 10% glycerol, 0.5% NP-40, 0.25% Triton x-100) for 10 minutes at 4°C and spun at 1350g for 5 minutes at 4°C to isolate nuclei. Supernatant was discarded and cells were resuspended in lysis buffer 2 (10mM Tris-HCl pH 8, 200mM NaCl, 1mM EDTA, 0.5mM EGTA) to lyse nuclei. Cells were rotated for 10 minutes at room temperature and were spun again at 1,350g for 5 minutes at 4°C. The supernatant was discarded and the pellet was resuspended in lysis buffer 3 (10mM Tris-HCl pH 8, 100mM NaCl, 1mM EDTA, 0.5mM EGTA 0.1% EDTA, 0.5% N-lauroylsarcosine). Lysates were passed through a 27 gauge needle 2 times and sonicated on a Bioruptor for 25 cycles of 30 seconds on/30 seconds off. 10% triton was added at a 1:10 dilution and lysates were spun for 10 minutes at 20,000g at 4°C. Beads were prepared by incubating in 0.5% BSA in PBS for 2 hours rotating at 4°C. Antibodies used were H3K4me3 (Active motif 39159, 5μg per ChIP), H3K27ac (Active motif 39133, 5 μg per ChIP) and Brd4 (Bethyl A301-985A, 5 μg per ChIP). Beads were washed with 0.5% BSA in PBS and then added to the lysates overnight rotating at 4°C. Chromatin from drosophila S2 cells was also added to lysates at a ratio of 1:10ug DNA to allow for future ChIP-RX analysis but this was not performed for this manuscript. Beads were then washed 7 times with wash buffer (50mM HEPES-KOH pH 7.6, 500mM LiCl, 1mM EDTA, 1% NP-40, 0.7% Na-Deoxycholate). Chromatin was eluted from beads in elution buffer (50mM Tris-HCl pH8.0, 10mM EDTA, 1% SDS) for 30 minutes shaking at 65°C and then crosslinking was reversed by further incubating chromatin overnight at 65°C. RNA was digested with RNAase for 1 hour at 37°C and protein was digested with proteinase K for 30 minutes at 55°C. DNA was then purified with the Qiagen PCR purification kit. The Illumina TruSeq ChIP purification kit was used to prepare samples for sequencing on an Illumina NextSeq 500 instrument (75bp read length, single end).
For ChIP-seq experiments from tissue, at P15, cerebella was dissected and snap-frozen at −80°C. Then cerebella were homogenized in 5 mLs of homogenization buffer (0.25M sucrose, 150 mM KCl, 5 mM MgCl2, 20mM Tricine-HOH pH7.8), first with 30 strokes of a loose pestle and then 30 strokes with a tight pestle on ice. Homogenate was then filtered through a 70uM cell strainer and brought back up to 5mLs. Cells were then fixed with 1% PFA by adding 312.5uL of 16% PFA and rotated at room temperature for 7 minutes at 40 rpm. The reaction was terminated with glycine (500uLs of 1.25M) rotating at room temperature for 5 minutes at 40 rpm. 4.5 mLs of 50% iodixanol, 5mM MgCl2, 20 mM Tricine-KOH, pH7.8, 150 mM KCl was then added and mixed with the cells. A centrifuge gradient was then used to separate and pellet nuclei. Supernatent was discarded and nuclei were resuspended in homogenization buffer. Cells were then stained with VyBrant DyeCycle Ruby (1:200) to prepare for FACS.
Sorting was carried out as previously described (Heiman et al., 2014) and then spun at 2000 RPM at 4°C for 15 minutes. Cells were then resuspended at 5×10^6 nuclei in 100 uL cell lysis buffer (500mM Tris pH8, 10mM EDTA, 1% SDS and protease inhibitors) and sonicated for 30 minutes. For each IP, 5×10^6 nuclei were used and diluted into 900uL RIPA IP dilution buffer (40mM Tris pH 8, 150mM NaCl, 1% NP-40, 0.5% Na deoxycholate). Protein G dynabeads were blocked for 1 hour in 0.5% BSA at room temperature and then incubated with H3K4me3 antibody (Millipore 07-473, 10ug per IP) for 2 hours at 4°C in 0.5% BSA. After washing, beads were added to the nuclei and incubated overnight at 4°C. Beads were then washed 8 times with wash buffer (10mM Tris pH 8, 500mM LiCl, 1% NP-40, 1% Na deoxycholate) and once with TE. Beads were then resuspended in 200 uL lysis buffer and DNA was eluted from beads. DNA was treated with RNAse (Thermo) for 2 hours 37°C and Protease K (Roche) for 2 hours at 55°C and purified with Qiagen PCR purification kit (Qiagen 28106).
Genome-wide sequencing
The Illumina TruSeq ChIP purification kit was used to prepare samples for sequencing on an Illumina HiSeq 2500 instrument (50bp read length, single end). For ChIP-sequencing analysis, alignments were performed with Bowtie2 (2.1.0) using the mm9 genome using a ChIP-seq pipeline (https://github.com/shenlab-sinai/chip-seq_preprocess). Bedtools (2.16.2) was used to quantify the ChIP signal within 2 kB of gene start sites (plus or minus 1kB from the TSS). Samtools (0.1.19) was used for sorting and converting Bam files. RPKM values (Reads Per Kilobase of transcript per Million mapped reads) were used for creating box plots and heat maps. Model-based analysis for ChIP-Seq (MACS) (Zhang et al., 2008) was used for peak calling. For characterization of genes with H3K4me3 occupancy, genes occupancy was defined as genes with an RPKM above 100 within 2 kB of the TSS. For H3K27ac, occupancy was defined as genes with an RPKM above 30 within 2 kB of the TSS. IGV tools (2.3.67) was used for creating TDF files and all tracks shown are normalized for total read coverage.
For RNA-sequencing data, alignments were performed with Tophat2 (2.1.0) using the mm9 genome. Samtools was used for sorting Bam files. HTSeq (0.6.1) (Anders et al., 2015) was used to obtain counts from aligned Bam files. DESeq2 (Love et al., 2014) was used to compare conditions and for principle component analysis. NGS plot (Shen et al., 2014) and R were used for visualizing data and IGV tools (2.3.67) was used for creating TDF files. R was used for statistical processing of data. For calculating statistical significance of overlapping genes sets, the total set of genes was defined as all genes expressed above an RPKM of 1 in the WT condition from our RNA-sequencing dataset.
WebGestalt GSAT analysis was used to analyze the phenotypes of the chromatin-associated proteins that are FMRP targets (Zhang et al., 2005). Panther was used for gene ontology (GO) analysis (Mi et al., 2013). For GO analysis, a background gene list of all expressed genes in mouse cortex was obtained from published ENCODE data. For Gene Set Enrichment Analysis (GSEA) for FMRP targets, the full ranked list of FMRP HITS-CLIP analysis was used, ranked by FMRP binding (Darnell et al., 2011). The GSEA pre-ranked option and the C5 gene set database were used with the number of permutations set to 1000 and enrichment statistic set to classic. For GSEA analysis of JQ1 and THZ1 regulated genes, a ranked list was generated by fold change in KO gene expression with or without treatment. The list of KO up or down-regulated genes was then used as the gene set with permutations set to 1000 and weighted enrichment. For comparisons to ASD-susceptibility genes, we combined genes published in (Iossifov et al., 2012) and those listed on the SFARI database to obtain a list of ASD-linked genes.
For comparison of KO misregulation genes and the targets genes of chromatin-associated proteins and transcription factors linked to FMRP, GEO datasets and datasets available from published articles that examined knockout, knockdown or inhibition of the FMRP target protein. We limited our search to datasets that specifically examined mouse neurons to match our RNA-sequencing or microarray dataset from KO mouse neurons or mouse neuronal progenitor cells. For transcription factors we also expanded our search to include ChIP-sequencing datasets. Most of the gene lists used for overlap analysis were provide within the published manuscripts as supplemental data. For gene lists that were not provided with the published manuscript but were obtained through GEO, ChIP-sequencing data were analyzed using bedtools to map the nearest gene for peaks provided in the form of bed files (for Auts2, Smarcc2, Smarca4, Ncoa1, and Ncoa2). For RNA-seq datasets, data was analyzed using the GEO2R analysis tool to obtain significantly differentially expressed genes (for HDAC4 and Tshz). Data sources are described in more detail in Supplemental Table 3C.
RNA purification and quantitative PCR
RNA was purified using the QIAGEN RNAeasy kit and reverse transcribed using the applied biosystems kit. qPCR was performed with Power SYBR green PCR master mix (applied biosystems 437659) on an applied biosystems quantitative PCR system run using StepOne software. mRNA levels were normalized to Gapdh levels for each samples and 3 technical replicates were averaged for each biological replicate.
Primers used for analysis of transcript levels:
Gapdh forward: AACTCCCTCAAGATTGTCAGCAA
Gapdh reverse: GGCATGGACTGTGGTCATGA
Arc forward: TAACCTGGTGTCCCTCCTAGATC
Arc reverse: GGAAAGACTTCTCAGCAGCTTGA
Nr4A1 forward: GAGTTCGGCAAGCCTACCAT
Nr4A1 reverse: TCAAACTTGAAGGACGCCGA
GluA1 forward: TCCTGAAGAACTCCTTAGTG
GluA1 reverse: ATCATGTCCTCATACACAGC
Shank2 forward: GCAAGCCTTTGTGGTTGACA
Shank2 reverse: TCTGGGAGCGTGTCTTGGTA
Fmr1 forward: AAAAGTCCAGAGGGGTATGGTA
Fmr1 reverse: CAGATTCTGAAGTATATCCAGGAC
Brd4 forward: AAATCAGCTCACCAGGCTGT
Brd4 reverse: TCTTGGGCTTGTTAGGGTTG
Primers used for ChIP:
Arc forward: ATAAATAGCCGCTGGTGGCG
Arc reverse: CGGCTCCGAACAGGCTAAG
Nr4A1 forward: TGGAATGTCTGCGCGCGTG
Nr4A1 reverse: TATAGATCAAACAATCCGCG
GluA1 forward: ATCTGGCTGTCAGTCGGTGT
GluA1 forward: AAAGAAGCCCTGGTCCAAC
Shank2 forward: TCCCCTGAGCCTATGGACTT
Shank2 reverse: CCCAGGAAGCAGGGGATCTA
Behavioral testing
Mice were treated daily by intraperitoneal injections for 1 week before testing began with either DMSO alone, JQ1 (APExBIO) at 50, 25, or 5 mg/kg, 5mg/kg of CX-4945 (APExBIO, A8330), or 5mg/kg of JQ1 plus 5mg/kg of CX-4945 combined, dissolved in DMSO, and diluted 1:10 into cyclodextrin (Sigma). Injections did not continue during testing. For low dose tests, JQ1 and CX-4945 were used at 5mg/kg dissolved in DMSO and diluted into cyclodextrin to reach a final solution of 10% DMSO. Mice were randomly assigned to groups and groups were then checked to ensure that the average weight per mouse of each group was equivalent. Behavioral tests were performed during the light cycle. Mice were first tested for open field activity for one hour. Mice were then tested for either marble burying and social recognition on the following 2 days and the moderate dose cohort was tested on novel object recognition after other testing was completed.
Open field activity was measured for one hour using Fusion 3.2 (Omnitech Electronics, Columbus, OH) to track mice and analyze movement. For marble burying, mice were given 15 minutes to explore a box with a layer of bedding (WF Fisher and Son, irradiated Northern Aspen chips, 05NIAC) and 15 evenly spaced marbles placed on top of the bedding. Mice were then returned to their home cage and marbles were then scored as either buried or still visible. For social recognition, mice were habituated for 10 minutes to a box with 3 accessible compartments: 2 with an upside-down wire cup on either side of an empty middle compartment. Mice were then briefly corralled to the middle compartment while a Lego was placed under one cup and an unfamiliar WT C57BL/6 mouse that was previously habituated to the cup was placed under the other cup. The test mouse was then allowed to explore all compartments for another 10 minutes. All sessions were recorded with Ethovision software (Noldus, Leesburg, VA). Time spent interacting with the cup containing the Lego and the cup containing the mouse was analyzed from video recordings of tests. Discrimination index was calculated as: (time with mouse – time with Lego)/(time with mouse + time with Lego).
Novel object recognition testing was performed for the cohort of mice receiving the moderate dose of JQ1 (25mgs/kgs) following other testing. Mice were habituated to the novel object recognition box for 10 minutes. One day later mice were habituated for an additional 2 minutes and then were briefly removed while 2 identical objects (either threaded gate valves, large clips, Nemo figurines, or a small pyramid) were placed in the box. Mice were given an additional 10 minutes to explore and then returned to their home cage. On the following day, mice were returned to the box containing one object they previously saw and one novel object and again allowed to explore for 10 minutes. All sessions were recorded with Ethovision software and the time spent interacting with each object was analyzed. Discrimination index was calculated as (time with new object – time with old object)/(time with new object + time with old object).
For each dosage and treatment tested, 2 to 3 cohorts of mice were bred and tested separately on different weeks and then combined into one dataset. All experiments were carried out and analyzed with the experimenter blind to the treatment group and genotype for each animal, as well as which object was novel for the novel object testing experiment. Further analysis and subject information is included in the “Quantification and Statistical Analysis” section of the STAR Methods.
Tissue processing and analysis
For analysis of non-neuronal effects of JQ1, mice were treated for 1 week with all drug treatment paradigms used for behavioral testing and then tissue was dissected from the thymus, skin (ear), and intestine. The thymus was analyzed by flow cytometry and skin and intestine were embedded in O.C.T. (Ted Pella, 27050) and frozen for histology analysis. 5μm sections were cut on a cryostat for Haemotoxylin and Esoin staining. Tissue slices were dried on a slide and covered in Hematoxylin Mayer’s Modified solution (Vector, H-3502) for 5 minutes and washed in water. Bluing Reagent (Vector, H-3502) was put on tissue for 10–15 seconds and then washed in water and 100% ethanol. Eosin Y Solution Modified (Vector, H-3502) was put on tissue for 2 to 3 minutes and tissue was then washed and dried with 100% ethanol. Slides were mounted in ProLong Gold Antifade reagent (life Technologies P36934) and imaged on a Keyence BZ-X700 inverted fluorescent microscope at 10× or 20× magnification with Nikon CF160 series infinite optical system at 96 pixels per inch and 32 bits per pixel.
Flow cytometry
For flow cytometry analysis of thymus tissue, thymus was dissected and placed in cold PBS. Cells were dissociated through gentle grinding of tissue between frosted slides and strained through a 100μm cell strainer (Falcon 352360). Cells were counted and 1 million were used for staining. Cells were spun at 400×G for 5 minutes and resuspended in Fix/Perm staining buffer (Affymetrix/eBioscience, 00-5523) for 45 minutes. Cells were then spun at 600×G for 5 minutes and washed in 1X Perm buffer then stained in 1X Perm buffer with antibodies for 488 anti-CD3 (BioLegend, 100212), 647 anti-CD4 (Biolegend, 100426), and PE anti-CK8α (BioLegend, 100708). Cells were then washed 2 times in 1X Perm buffer and resuspended in Perm buffer for analysis. Cells were analyzed using a BD LSR 11 flow cytometer and analyzed using FlowJo, with all gates the same between samples.
For cell sorting experiments, cells transfected with GFP plus either a control plasmid, Brd4 or Brd4-SSS492ESE. 5 days after transfection, cells were washed in PBS and incubated for 30 minutes on ice in FACS buffer (10mM HEPES, 5mM EDTA, 2% BSA, in PBS) and then pipetted to dislodge from plate. GFP positive cells were sorted on a BD FACSAria Cell Sorter (BD Biosciences) directly into Trizol (Life Technologies, 15596-026) and RNA was isolated for analysis.
QUANTIFICATION AND STATISTICAL ANALYSIS
Statistical details of each experiment are included in the figure legends and ANOVA values are included in Table S4. An alpha level of 0.05 was used for analysis. Two-sided t-test were performed in Excel. A Bonferroni correction was applied when comparing multiple groups. 1-way and 2-way ANOVAs were performed in R with post hoc two-sided t-tests for individual comparisons. Hypergeometric tests were performed in R for analysis of overlaps of gene groups. Variance is shown in box and whisker plots. Bar plots show mean values and error bars for bar plots are standard error of the mean (SEM). N represents the number of mice for behavior experiments and biological replicates for culture experiments (typically independent neuronal dissections).
For quantification of Brd4 from immunocytochemistry experiments, a region of interest was selected around the nucleus and the average intensity was measured. Regions were selected using DAPI and then applied to the Brd4 channel such that the analysis was performed blind to the Brd4 staining. For all image analysis, an average background intensity value was subtracted from each intensity value. To allow for comparisons across experiments, the average control cell value was set to 100 and all conditions were normalized to this value. For H3K4me3 quantification, similar methods were used to obtain an average fluorescence value for the transfected nucleus and for the nucleus of the closest neighboring cell. The target transfected cell value was then divided by the neighboring cell value to obtain a ratio of H3K4me3 staining. For FMRP quantification in shRNA transfected neurons, a region in the cytoplasm of the transfected cell was used to measure FMRP expression and was compared to control transfected cells.
For spine quantification, the first 10 GFP positive neurons found by scanning for transfected cells were imaged and used for analysis (or as many neurons as possible in cases where under 10 neurons were transfected per coverslip). Z-stacks were used for imaging to ensure adequate coverage of dendrites with 4 images spaced 0.5μm apart. Stacks were then summed in ImageJ to create one image for analysis. Primary dendrites were measured for analysis with the largest branch selected at each branch point. Analysis consisted of counting all spines (in a blinded fashion) on a dendrite starting at the cell body and continuing until the dendrite terminated or extended outside the field of the image. The length of each dendrite counted was measured using imageJ to determine the number of spines per micron. 3 dendrites were analyzed for each neuron with values averaged per neuron. All neurons were then averaged within each condition so that each single biological replicate consisted of multiple neurons measured with 3 dendrites averaged per neuron.
For behavioral experiments, all experiments were carried out and analyzed with the experimenter blind to the treatment group, genotype, and which object was novel for the novel object testing experiment. One mouse was excluded from testing due to the pre-established criteria of extremely low weight at the time of testing (less then 50% of the average body weight of the cohort and too small to be able to bury marbles.) Two mice were excluded from the data counted toward social interaction testing because they failed to explore the arena and interact with the mouse cup so a discrimination index could not be accurately calculated. For the low dose combination testing, one of three cohorts for the marble burying test was excluded due to a procedural error.
SOFTWARE AND DATA AVAILABILITY
Raw sequencing data is available at: http://www.ncbi.nlm.nih.gov/geo/query/acc.cgi?token=yzydmymsnjyddev&acc=GSE81912.
Supplementary Material
Supplemental Table 1. FMRP targets include chromatin-associated proteins. Related to Figure 1. (A) All FMRP HITS-CLIP targets (published in Darnell, et al., 2011). (B) FMRP targets that function in the nucleus. (C) Categorization of FMRP targets that are associated with chromatin.
Supplemental Table 2. ChIP-sequencing data. Related to Figure 2. (A) ChIP-sequencing RPKM values for H3K4me3 and H3K27ac from neurons and the average RPKM from 3 replicates of H3K4me3 ChIP from cerebellar tissue. (B) Peaks found from ChIP-sequencing data using MACS peak calling. (C) GO analysis of genes with a 1.5 or greater fold increase in both H3K4me3 and H3K27ac occupancy.
Supplemental Table 3. RNA-sequencing data. Related to Figures 3 and 5. (A) All significantly differentially expressed genes in Fmr1 KO neurons. (B) GO analysis of all KO differentially expressed genes. (C) Gene group numbers, overlaps and data source for all comparisons shown in Figures 3D–F and S3M. (D) All significantly differentially expressed genes in Fmr1 KO neurons treated with JQ1 compared to Fmr1 KO neurons. (E) GO analysis of all JQ1 differentially expressed genes. Red highlighted text indicates groups also found in corresponding GO analysis for KO differentially expressed genes. (F) GO analysis of all THZ differentially expressed genes.
Supplemental Table 4. Statistics and oligonucleotide sequences. Related to Figures 1, 5, 6, 7, S1, S3, S4, S5, S6, S7, and STAR Methods. (A) ANOVA values for all relevant figures. (B) Primer sequences used for qRT-PCR and ChIP-PCR.
Supplemental Figure 1. FMRP targets include chromatin-associated proteins. Related to Figure 1. (A) Gene ontology analysis of molecular functions enriched in FMRP HITS-CLIP transcripts. (B) Gene Set Enrichment Analysis (GSEA) of the FMRP HITS-CLIP ranked list. The steep upward slopes in the left portion of graphs indicate a high concentration of hits within the highest confidence FMRP targets. (C) Phenotypes linked to the chromatin-associated proteins found in FMRP HITS-CLIP analysis. (D) Quantification of western blots shown in Figure 1D, normalized to Gapdh. n = 3. (E) Western blot of histone modifications from 3 additional biological replicates of WT or Fmr1 KO cultured cortical neurons (separate replicates from those shown in Figure 1E). (F) Quantification of western blots shown in Figure 1E and S1E, normalized to total histone H3 or H4. n = 6. (G) FMRP levels in neurons transfected with Luciferase, Fmr1 shRNA1, and Fmr1 shRNA2. N = 45, 43, and 46 neurons respectively from Luciferase, Fmr1 shRNA1, and Fmr1 shRNA2 from 5 biological replicates. (H) Average recovery curve of FRAP analysis of GFP-H1 in neurons transfected with luciferase or Fmr1 shRNA. (I) Quantification of the mobile fraction of GFP-H1 from FRAP analysis of neurons transfected with luciferase or Fmr1 shRNA. n = 57 neurons per condition from 6 biological replicates. Scale bar is 10μm. For G, ***p < 0.001, one-way ANOVA with post hoc two-sided t-test. For D, F, I, *p<0.05, ***p < 0.001, two-sided t-test. Bar graphs show mean ± SEM. See also Table S4 for ANOVA values.
Supplemental Figure 2. ChIP-sequencing reveals increased H3K4me3 and H3K27ac in Fmr1 KO neurons. Related to Figure 2. (A) Gene tracks of second replicate of H3K4me3 ChIP-sequencing. (B, C) TSS occupancy (B) and RPKM values (C) for a second replicate of H3K4me3 ChIP-sequencing. (D) Gene tracks of H3K4me3 ChIP-sequencing from neurons cultured from FVB mice show similar results in a different mouse strain. (E, F) TSS occupancy (E) and RPKM values (F) for H3K4me3 ChIP-sequencing from neurons cultured from FVB mice. (G, J) H3K27ac gene tracks of two independent replicates. (H, K) H3K27ac TSS occupancy for all genes in WT and KO neurons from two independent replicates. (I, L) H3K27ac RPKM values from WT and KO neurons from two independent replicates. (M) Overlap of genes with H3K4me3 peaks in WT and KO neurons based on MACS peak calling. (N) Overlap of genes with H3K27ac peaks in WT and KO neurons. (O) Overlap of genes with a 1.5 or greater fold increase in H3K4me3 and H3K27ac occupancy in KO neurons. (P) Gene ontology analysis of the group of genes with a 1.5 or greater fold increase in both H3K4me3 and H3K27ac occupancy in KO neurons. (Q) Overlap of genes with H3K4me3 occupancy in WT and KO neurons sorted from cerebellar tissue. (R) Overlap of genes with KO-specific H3K4me3 peaks from cultured cells and from cerebellar tissue. ***p<0.001, paired two-sided t-test.
Supplemental Figure 3. RNA-sequencing in Fmr1 KO neurons. Related to Figure 3. (A, B) Gene expression in WT (A) and KO (B) neurons of all expressed genes, binned by increasing H3K4me3 signal, shows that genes with greater H3K4me3 occupancy have greater gene expression. (C, D) Gene expression in WT (C) and KO (D) neurons of all expressed genes, binned by increasing H3K27ac signal. (E, F) Differential expression in WT and KO neurons of KO upregulated genes grouped by increasing differential H3K4me3 signal (E) or differential H3K27ac signal (F). (G) WT expression levels of significantly down and upregulated KO genes. (H) Heatscatter plot of RPKMs of significantly down and upregulated KO genes. (I) Boxed area in H expanded to show area of high point density. (J) Gene Ontology analysis of KO downregulated genes. (K) Principle component analysis (PCA) of 3 WT and 3 KO biological replicates shows some variability between replicates on the PC2 axis, while on the PC1 axis, which contributes to 81% of variance between samples, WT and KO samples cluster within the same genotype. (L) The number and percentage of target genes of transcription factors found in the FMRP HITS-CLIP analysis that overlap with KO misregulated genes. (M) The significance of the overlap of Fmr1 KO misregulated genes with targets genes of the transcription factors found in the FMRP HITS-CLIP. (N) Venn diagram of KO misregulated genes and targets genes of all transcription factors that show the most significant overlap with KO genes. (n = 3.) ***p < 0.001, one-way ANOVA with post hoc two-sided t-test. Overlaps, hypergeometric test. Bar graphs show mean ± SEM. See also Table S4 for ANOVA values.
Supplemental Figure 4. Brd4 regulation in WT and Fmr1 KO neurons during development. Related to Figure 4. (A) Brd4 mRNA expression at increasing days in vitro (DIV) in WT and KO neurons. (B) Quantification of Brd4 protein expression in WT and KO cultured neurons from western blots in Figure 4A and 4C. n = 3 biological replicates. (C) Cell by cell quantification of Brd4 staining in cultured neurons shown in Figures 4D. n= 87 and 69 neurons measured for WT and KO from 3 biological replicates. (D) Quantification of Brd4 protein expression in WT and KO cortical tissue from western blots in Figure 4F. n = 3 biological replicates. (Main effect(genotype): F(1,23)=10.31, p=0.00388; main effect(age): F(4,23)=11.39, p=3.03e–5.) (E) Cell by cell quantification of Brd4 staining in cultured neurons in vivo shown in Figures 4I. n= 137 and 176 neurons measured for WT and KO from 3 biological replicates for E. (F–H) Western blot (F) and quantification of Brd4 (G) and phosphorylated Brd4 (H) in WT and KO neurons. n = 3 biological replicates. Western is cropped to remove other experiments run to the right of the lanes shown. (I–L) Brd4 ChIP-qPCR in WT and KO neurons of Gria1 (I), Arc (J), Nr4a1 (K), and Shank2 (L). (N = 4.) For A: two-way ANOVA with post hoc two-sided t-test. For B: one-way ANOVA with post hoc two-sided t-test. For G-L: unpaired two-sided t-test, For A-B, indicates significance relative to DIV 0. *p < 0.05, ***p < 0.001. a.u., arbitrary units. Bar graphs show mean ± SEM. See also Table S4 for ANOVA values.
Supplemental Figure 5. RNA-sequencing in Fmr1 KO neurons treated with JQ1 and THZ. Related to Figure 5. (A) Overlap of JQ1 regulated genes in WT and KO neurons. (B) Western blot of Brd4 target genes (that are decreased by JQ1), FMRP target proteins (that are not affected by JQ1), and histone modifications (some of which are affected by JQ1.) (C–F) qRT-PCR for WT and KO neurons treated with JQ1 for Nr4a1 (C), Shank2 (D), Arc (E), and Gria1 (F). (n = 4) (G–K) qRT-PCR after viral knockdown of luciferase (control) or Fmr1 for Fmr1 (G), Nr4a1 (H), Shank2 (I), Arc (J) and Gria1 (K) demonstrates that changes in gene expression in KO neurons are not due to developmental effects of loss of the FMRP protein. n = 10, 8, 5 for control, Fmr1 shRNA1, Fmr1 shRNA2 respectively. (L–O) qRT-PCR after viral knockdown of luciferase (control) or Fmr1 followed by JQ1 treatment for Nr4a1 (L), Shank2 (M), Arc (N) and Gria1 (O) demonstrates that changes JQ1 reverses even transiently occurring gene expression changes resulting from the loss FMRP expression rather then acting by reversing other long term developmental changes in KO neurons. n = 10, 5, 8, 6 for control, control+JQ1, shRNA1, shRNA1+JQ1. (P-S) qRT-PCR after viral knockdown of luciferase (control) or Fmr1 followed by JQ1 treatment and subsequent washout for Nr4a1 (P), Shank2 (Q), Arc (R) and Gria1 (S) shows JQ1’s effects on gene expression are rapidly reversible. n = 7, 7, 3, 6, 5, 3 for control, control+JQ1, control+JQ1+washout, shRNA1, shRNA1+JQ1, shRNA1+JQ1+washout. (T) RNA-sequencing tracks for Nr4a1 and Shank2 in WT and KO neurons after THZ1 treatment. n = 3. (U) Overlap of KO upregulated genes with THZ1 downregulated genes and vice versa. (V) Gene set enrichment analysis to compare KO up- or down-regulated genes with JQ1 and THZ1 regulated genes. Genes are ranked by fold change in expression between KO and KO treated with JQ1 or THZ1. The group of genes differentially expressed between WT and KO neurons was then mapped onto these ranked lists. Red boxes indicate regions where steep upward slopes are present in the datasets indicating a high density of KO misregulated genes fall in these regions. (W–Z) qRT-PCR for WT and KO neurons treated with THZ1 for Nr4a1 (W), Shank2 (X), Arc (Y) and Gria1 (Z). n = 3. *p < 0.05, ***p < 0.001, one-way ANOVA with post hoc two-sided t-test for G-K, two-way ANOVA with post hoc two-sided t-test for C-F, L-S, AND W-Z. Overlap p values, hypergeometric test. a.u., arbitrary units. Bar graphs show mean ± SEM. See also Table S4 for ANOVA values.
Supplemental Figure 6. Effects of high dose of JQ1 on FXS phenotypes. Related to Figure 6. (A) Preference for the inner verse outer zone preference in an open field test for mice treated with 50mgs/kg JQ1. (B) Total distance traveled during the social interaction test for mice treated with 50 mg/kg JQ1. (C) Total time spent interacting with the Lego and mouse combined for mice treated with 50 mg/kg JQ1. (D–G) qRT-PCR for target genes for Nr4a1 (D), Shank2 (E), Arc (F) and Gria1 (G). using WT and KO cortical tissue isolated from mice after behavioral testing. n = 10, 11, 9, and 8 mice for WT, WT+JQ1, KO, and KO+JQ1. (H–M) Examples (H) and quantification (I–M) of analysis of cell types in the thymus measured by flow cytometry after different treatment paradigms. n = 3 to 4 mice per condition. (N) Hematotoxylin and Eosin stain of sectioned skin from the ear. Arrows indicate example of hyperplasia of the epidermis. (O) Quantification of the width of the epidermis after different treatment paradigms. n = 23 to 29 slices from 3 to 4 mice, with 3 measurements averaged for each slice. (P) Hematotoxylin and Eosin stain of sectioned small intestine shows no major morphology deficits. Bottom row shows higher magnification images. (Q) Total distance traveled over 1 hour in open field testing for mice treated with 25mg/kg JQ1. (R) Number of marbles buried in 15 minutes for mice treated with 25 mg/kg JQ1. (S) Discrimination index of a preference for a mouse relative to a Lego in social interaction testing for mice treated with 25mg/kg JQ1. (T) Preference for the inner verse outer zone in an open field test for mice treated with 25 mg/kg JQ1. (U) Total distance traveled during the social interaction test for mice treated with 25 mg/kg JQ1. (V) Total time spent exploring or interacting with the Lego and mouse combined for mice treated with 25 mg/kg JQ1. (W) Distance traveled during habituation period in the novel object recognition test. (X, Y) Time spent interacting with objects during learning phase (X) or testing phase (Y) of the novel object recognition test. n = 11, 14, 14, and 16 for WT, WT+JQ1, KO, and KO+JQ1 for low dose older cohort. *p < 0.05, ***p < 0.001, two-way ANOVA with post hoc two-sided t-test for A-G and Q-Y, one-way ANOVA with post-hoc unpaired two-sided t-test for J-O. Scale bars are 100μm. a.u., arbitrary units. Bar graphs show mean ± SEM. See also Table S4 for ANOVA values.
Supplemental Figure 7. Brd4 necessity and sufficiency and combination treatment in FXS phenotypes. Related to Figure 7. (A–E) Transcript levels after infection of WT or KO neurons with 2 different Brd4 shRNA lentiviruses for Nr4a1 (A), Shank2 (B), Arc (C), Gria1 (D), and Brd4 (E). n = 3 to 10 biological replicates. (F) Brd4 and Brd4-SSS492ESE expression levels after transfection in WT neurons measured by immunocytochemistry. (G–H) Arc (G) and Gria1 (H) transcript levels in GFP sorted neurons transfected with Brd4 or Brd4-SSS492ESE. n = 5. (I, J) Dose response of target genes for JQ1 (I) and CX-4945 (J). (K, L) Arc (K) and Gria1 (L) transcript levels in WT and KO after combined low dose JQ1 and CX-4945 treatment, or either drug alone at low doses. n = 3 to 5 replicates per condition. n = 3 to 4 replicates per condition. (M, N) Increased spine density in neurons transfected with the phospho-mimic form of Brd4 cannot be reversed with the low dose combination treatment (M) but can be reversed with high dose JQ1 (N). n = 3 to 8 biological replicates per construct with 3 dendrites averaged for each of 5 to 10 neurons counted per replicate. (O) Total distance traveled over 1 hour in open field testing for mice treated with 5 mg/kg of JQ1 or CX-4945. (P) Preference for the inner verse outer zone in an open field test for mice treated with 5 mg/kg of JQ1 or CX-4945. (Q) Number of marbles fully buried in 15 minutes for mice treated with 5 mg/kg of JQ1 or CX-4945. (R) Discrimination index of a preference for a mouse relative to a Lego in social interaction testing for mice treated with 5 mg/kg of JQ1 or CX-4945. n = 3 to 5 mice per condition. (S) Preference for the inner verse outer zone in an open field test for mice treated with 5 mg/kg of JQ1 in combination with 5 mg/kg CX-4945. (T) Total distance traveled during the social interaction test for mice treated with 5 mg/kg of JQ1 in combination with 5 mg/kg CX-4945. (U) Total time spent interacting with both the mouse and Lego in the social interaction test for mice treated with 5 mg/kg of JQ1 in combination with 5 mg/kg CX-4945. n = 16 to 26 mice per condition. *p < 0.05, ***p < 0.001, n.s. nonsignificant, two-way ANOVA with post hoc two-sided t-test for A-D, K-L, O-U, unpaired two-sided t-test for E-H, M-N. (ANOVA in O-R indicates significant differences by genotype, t-test shows significance when all WT mice compared to all KO mice but not in individual groups). a.u., arbitrary units. Bar graphs show mean ± SEM. See also Table S4 for ANOVA values.
Acknowledgments
We thank M. Mellen, L. Shen, E. Loh and J. Gerace for suggestions and expertise, N. Heintz for bacTRAP mice, J.C. Darnell for guidance, and Allis and Darnell lab members for feedback. Support was provided by The Rockefeller University, the Robertson Foundation, the NIH (F32MH103921, K99 1K99MH111836, R01 NS34389, NS081706 and R35NS097404) and a Simons Foundation Research Award. R.B.D. is an Investigator of the Howard Hughes Medical Institute.
Footnotes
AUTHOR CONTRIBUTIONS
E.K., M.H., C.D.A, and R.D. wrote the manuscript and designed and carried out experiments. M.H. performed ChIP-sequencing from cerebellar neurons and helped with behavioral testing. I.Z.S. helped with behavioral testing, behavioral analysis and imaging. J.G. provided feedback and guidance for behavioral testing. R.D. helped initiate and design the project and provided feedback. C.D.A. provided support, feedback and guidance.
References
- Alpatov R, Lesch BJ, Nakamoto-Kinoshita M, Blanco A, Chen S, Stützer A, Armache KJ, Simon MD, Xu C, Ali M, et al. A chromatin-dependent role of the fragile X mental retardation protein FMRP in the DNA damage response. Cell. 2014;157:869–881. doi: 10.1016/j.cell.2014.03.040. [DOI] [PMC free article] [PubMed] [Google Scholar]
- Anders S, Pyl PT, Huber W. HTSeq–a Python framework to work with high-throughput sequencing data. Bioinforma Oxf Engl. 2015;31:166–169. doi: 10.1093/bioinformatics/btu638. [DOI] [PMC free article] [PubMed] [Google Scholar]
- Auerbach BD, Osterweil EK, Bear MF. Mutations causing syndromic autism define an axis of synaptic pathophysiology. Nature. 2011;480:63–68. doi: 10.1038/nature10658. [DOI] [PMC free article] [PubMed] [Google Scholar]
- Bagley JA, Yan Z, Zhang W, Wildonger J, Jan LY, Jan YN. Double-bromo and extraterminal (BET) domain proteins regulate dendrite morphology and mechanosensory function. Genes Dev. 2014;28:1940–1956. doi: 10.1101/gad.239962.114. [DOI] [PMC free article] [PubMed] [Google Scholar]
- Bassell GJ, Warren ST. Fragile X syndrome: loss of local mRNA regulation alters synaptic development and function. Neuron. 2008;60:201–214. doi: 10.1016/j.neuron.2008.10.004. [DOI] [PMC free article] [PubMed] [Google Scholar]
- Bear MF, Huber KM, Warren ST. The mGluR theory of fragile X mental retardation. Trends Neurosci. 2004;27:370–377. doi: 10.1016/j.tins.2004.04.009. [DOI] [PubMed] [Google Scholar]
- Belkina AC, Denis GV. BET domain co-regulators in obesity, inflammation and cancer. Nat Rev Cancer. 2012;12:465–477. doi: 10.1038/nrc3256. [DOI] [PMC free article] [PubMed] [Google Scholar]
- Bolden JE, Tasdemir N, Dow LE, van Es JH, Wilkinson JE, Zhao Z, Clevers H, Lowe SW. Inducible in vivo silencing of Brd4 identifies potential toxicities of sustained BET protein inhibition. Cell Rep. 2014;8:1919–1929. doi: 10.1016/j.celrep.2014.08.025. [DOI] [PMC free article] [PubMed] [Google Scholar]
- Caudy AA, Myers M, Hannon GJ, Hammond SM. Fragile X-related protein and VIG associate with the RNA interference machinery. Genes Dev. 2002;16:2491–2496. doi: 10.1101/gad.1025202. [DOI] [PMC free article] [PubMed] [Google Scholar]
- Darnell JC, Van Driesche SJ, Zhang C, Hung KYS, Mele A, Fraser CE, Stone EF, Chen C, Fak JJ, Chi SW, et al. FMRP stalls ribosomal translocation on mRNAs linked to synaptic function and autism. Cell. 2011;146:247–261. doi: 10.1016/j.cell.2011.06.013. [DOI] [PMC free article] [PubMed] [Google Scholar]
- Devaiah BN, Case-Borden C, Gegonne A, Hsu CH, Chen Q, Meerzaman D, Dey A, Ozato K, Singer DS. BRD4 is a histone acetyltransferase that evicts nucleosomes from chromatin. Nat Struct Mol Biol. 2016 doi: 10.1038/nsmb.3228. [DOI] [PMC free article] [PubMed] [Google Scholar]
- Gantois I, Bakker CE, Reyniers E, Willemsen R, D’Hooge R, De Deyn PP, Oostra BA, Kooy RF. Restoring the phenotype of fragile X syndrome: insight from the mouse model. Curr Mol Med. 2001;1:447–455. doi: 10.2174/1566524013363492. [DOI] [PubMed] [Google Scholar]
- Gibson JR, Bartley AF, Hays SA, Huber KM. Imbalance of Neocortical Excitation and Inhibition and Altered UP States Reflect Network Hyperexcitability in the Mouse Model of Fragile X Syndrome. J Neurophysiol. 2008;100:2615–2626. doi: 10.1152/jn.90752.2008. [DOI] [PMC free article] [PubMed] [Google Scholar]
- He CX, Portera-Cailliau C. The trouble with spines in fragile X syndrome: density, maturity and plasticity. Neuroscience. 2013;251:120–128. doi: 10.1016/j.neuroscience.2012.03.049. [DOI] [PMC free article] [PubMed] [Google Scholar]
- Heiman M, Kulicke R, Fenster RJ, Greengard P, Heintz N. Cell type–specific mRNA purification by translating ribosome affinity purification (TRAP) Nat Protoc. 2014;9:1282–1291. doi: 10.1038/nprot.2014.085. [DOI] [PMC free article] [PubMed] [Google Scholar]
- Henderson C, Wijetunge L, Kinoshita MN, Shumway M, Hammond RS, Postma FR, Brynczka C, Rush R, Thomas A, Paylor R, et al. Reversal of disease-related pathologies in the fragile X mouse model by selective activation of GABAB receptors with arbaclofen. Sci Transl Med. 2012;4:152ra128. doi: 10.1126/scitranslmed.3004218. [DOI] [PMC free article] [PubMed] [Google Scholar]
- Iossifov I, Ronemus M, Levy D, Wang Z, Hakker I, Rosenbaum J, Yamrom B, Lee YH, Narzisi G, Leotta A, et al. De novo gene disruptions in children on the autistic spectrum. Neuron. 2012;74:285–299. doi: 10.1016/j.neuron.2012.04.009. [DOI] [PMC free article] [PubMed] [Google Scholar]
- Jang MK, Mochizuki K, Zhou M, Jeong HS, Brady JN, Ozato K. The bromodomain protein Brd4 is a positive regulatory component of P-TEFb and stimulates RNA polymerase II-dependent transcription. Mol Cell. 2005;19:523–534. doi: 10.1016/j.molcel.2005.06.027. [DOI] [PubMed] [Google Scholar]
- Jin P, Zarnescu DC, Ceman S, Nakamoto M, Mowrey J, Jongens TA, Nelson DL, Moses K, Warren ST. Biochemical and genetic interaction between the fragile X mental retardation protein and the microRNA pathway. Nat Neurosci. 2004;7:113–117. doi: 10.1038/nn1174. [DOI] [PubMed] [Google Scholar]
- Kanno T, Kanno Y, LeRoy G, Campos E, Sun HW, Brooks SR, Vahedi G, Heightman TD, Garcia BA, Reinberg D, et al. BRD4 assists elongation of both coding and enhancer RNAs by interacting with acetylated histones. Nat Struct Mol Biol. 2014;21:1047–1057. doi: 10.1038/nsmb.2912. [DOI] [PMC free article] [PubMed] [Google Scholar]
- Kenny PJ, Zhou H, Kim M, Skariah G, Khetani RS, Drnevich J, Arcila ML, Kosik KS, Ceman S. MOV10 and FMRP regulate AGO2 association with microRNA recognition elements. Cell Rep. 2014;9:1729–1741. doi: 10.1016/j.celrep.2014.10.054. [DOI] [PMC free article] [PubMed] [Google Scholar]
- Korb E, Herre M, Zucker-Scharff I, Darnell RB, Allis CD. BET protein Brd4 activates transcription in neurons and BET inhibitor JQ1 blocks memory in mice. Nat Neurosci. 2015;18:1464–1473. doi: 10.1038/nn.4095. [DOI] [PMC free article] [PubMed] [Google Scholar]
- Kwiatkowski N, Zhang T, Rahl PB, Abraham BJ, Reddy J, Ficarro SB, Dastur A, Amzallag A, Ramaswamy S, Tesar B, et al. Targeting transcription regulation in cancer with a covalent CDK7 inhibitor. Nature. 2014;511:616–620. doi: 10.1038/nature13393. [DOI] [PMC free article] [PubMed] [Google Scholar]
- Lian H, Li D, Zhou Y, Landesman-Bollag E, Zhang G, Anderson NM, Tang KC, Roderick JE, Kelliher MA, Seldin DC, et al. CK2 inhibitor CX-4945 destabilizes NOTCH1 and synergizes with JQ1 against human T-acute lymphoblastic leukemic cells. Haematologica. 2017;102:e17–e21. doi: 10.3324/haematol.2016.154013. [DOI] [PMC free article] [PubMed] [Google Scholar]
- Liu W, Ma Q, Wong K, Li W, Ohgi K, Zhang J, Aggarwal AK, Rosenfeld MG. Brd4 and JMJD6-associated anti-pause enhancers in regulation of transcriptional pause release. Cell. 2013;155:1581–1595. doi: 10.1016/j.cell.2013.10.056. [DOI] [PMC free article] [PubMed] [Google Scholar]
- Love MI, Huber W, Anders S. Moderated estimation of fold change and dispersion for RNA-seq data with DESeq2. Genome Biol. 2014;15:550. doi: 10.1186/s13059-014-0550-8. [DOI] [PMC free article] [PubMed] [Google Scholar]
- Lovén J, Hoke HA, Lin CY, Lau A, Orlando DA, Vakoc CR, Bradner JE, Lee TI, Young RA. Selective Inhibition of Tumor Oncogenes by Disruption of Super-Enhancers. Cell. 2013;153:320–334. doi: 10.1016/j.cell.2013.03.036. [DOI] [PMC free article] [PubMed] [Google Scholar]
- Mi H, Muruganujan A, Casagrande JT, Thomas PD. Large-scale gene function analysis with the PANTHER classification system. Nat Protoc. 2013;8:1551–1566. doi: 10.1038/nprot.2013.092. [DOI] [PMC free article] [PubMed] [Google Scholar]
- Musumeci SA, Bosco P, Calabrese G, Bakker C, De Sarro GB, Elia M, Ferri R, Oostra BA. Audiogenic seizures susceptibility in transgenic mice with fragile X syndrome. Epilepsia. 2000;41:19–23. doi: 10.1111/j.1528-1157.2000.tb01499.x. [DOI] [PubMed] [Google Scholar]
- Niere F, Wilkerson JR, Huber KM. Evidence for a fragile X mental retardation protein-mediated translational switch in metabotropic glutamate receptor-triggered Arc translation and long-term depression. J Neurosci Off J Soc Neurosci. 2012;32:5924–5936. doi: 10.1523/JNEUROSCI.4650-11.2012. [DOI] [PMC free article] [PubMed] [Google Scholar]
- Parikshak NN, Luo R, Zhang A, Won H, Lowe JK, Chandran V, Horvath S, Geschwind DH. Integrative functional genomic analyses implicate specific molecular pathways and circuits in autism. Cell. 2013;155:1008–1021. doi: 10.1016/j.cell.2013.10.031. [DOI] [PMC free article] [PubMed] [Google Scholar]
- Peart MJ, Smyth GK, van Laar RK, Bowtell DD, Richon VM, Marks PA, Holloway AJ, Johnstone RW. Identification and functional significance of genes regulated by structurally different histone deacetylase inhibitors. Proc Natl Acad Sci U S A. 2005;102:3697–3702. doi: 10.1073/pnas.0500369102. [DOI] [PMC free article] [PubMed] [Google Scholar]
- Peier AM, McIlwain KL, Kenneson A, Warren ST, Paylor R, Nelson DL. (Over)correction of FMR1 deficiency with YAC transgenics: behavioral and physical features. Hum Mol Genet. 2000;9:1145–1159. doi: 10.1093/hmg/9.8.1145. [DOI] [PubMed] [Google Scholar]
- Peixoto L, Abel T. The role of histone acetylation in memory formation and cognitive impairments. Neuropsychopharmacol Off Publ Am Coll Neuropsychopharmacol. 2013;38:62–76. doi: 10.1038/npp.2012.86. [DOI] [PMC free article] [PubMed] [Google Scholar]
- Rahman S, Sowa ME, Ottinger M, Smith JA, Shi Y, Harper JW, Howley PM. The Brd4 extraterminal domain confers transcription activation independent of pTEFb by recruiting multiple proteins, including NSD3. Mol Cell Biol. 2011;31:2641–2652. doi: 10.1128/MCB.01341-10. [DOI] [PMC free article] [PubMed] [Google Scholar]
- Schmeisser MJ, Ey E, Wegener S, Bockmann J, Stempel AV, Kuebler A, Janssen AL, Udvardi PT, Shiban E, Spilker C, et al. Autistic-like behaviours and hyperactivity in mice lacking ProSAP1/Shank2. Nature. 2012;486:256–260. doi: 10.1038/nature11015. [DOI] [PubMed] [Google Scholar]
- Shen C, Ipsaro JJ, Shi J, Milazzo JP, Wang E, Roe JS, Suzuki Y, Pappin DJ, Joshua-Tor L, Vakoc CR. NSD3-Short Is an Adaptor Protein that Couples BRD4 to the CHD8 Chromatin Remodeler. Mol Cell. 2015;60:847–859. doi: 10.1016/j.molcel.2015.10.033. [DOI] [PMC free article] [PubMed] [Google Scholar]
- Shen L, Shao N, Liu X, Nestler E. ngs.plot: Quick mining and visualization of next-generation sequencing data by integrating genomic databases. BMC Genomics. 2014;15:284. doi: 10.1186/1471-2164-15-284. [DOI] [PMC free article] [PubMed] [Google Scholar]
- Spencer CM, Alekseyenko O, Serysheva E, Yuva-Paylor LA, Paylor R. Altered anxiety-related and social behaviors in the Fmr1 knockout mouse model of fragile X syndrome. Genes Brain Behav. 2005;4:420–430. doi: 10.1111/j.1601-183X.2005.00123.x. [DOI] [PubMed] [Google Scholar]
- Sullivan JM, Badimon A, Schaefer U, Ayata P, Gray J, Chung C, von Schimmelmann M, Zhang F, Garton N, Smithers N, et al. Autism-like syndrome is induced by pharmacological suppression of BET proteins in young mice. J Exp Med. 2015;212:1771–1781. doi: 10.1084/jem.20151271. [DOI] [PMC free article] [PubMed] [Google Scholar]
- Thomas AM, Bui N, Graham D, Perkins JR, Yuva-Paylor LA, Paylor R. Genetic reduction of group 1 metabotropic glutamate receptors alters select behaviors in a mouse model for fragile X syndrome. Behav Brain Res. 2011;223:310–321. doi: 10.1016/j.bbr.2011.04.049. [DOI] [PMC free article] [PubMed] [Google Scholar]
- Udagawa T, Farny NG, Jakovcevski M, Kaphzan H, Alarcon JM, Anilkumar S, Ivshina M, Hurt JA, Nagaoka K, Nalavadi VC, et al. Genetic and acute CPEB1 depletion ameliorate fragile X pathophysiology. Nat Med. 2013;19:1473–1477. doi: 10.1038/nm.3353. [DOI] [PMC free article] [PubMed] [Google Scholar]
- Zhang B, Kirov S, Snoddy J. WebGestalt: an integrated system for exploring gene sets in various biological contexts. Nucleic Acids Res. 2005;33:W741–W748. doi: 10.1093/nar/gki475. [DOI] [PMC free article] [PubMed] [Google Scholar]
- Zhang Y, Liu T, Meyer CA, Eeckhoute J, Johnson DS, Bernstein BE, Nusbaum C, Myers RM, Brown M, Li W, et al. Model-based analysis of ChIP-Seq (MACS) Genome Biol. 2008;9:R137. doi: 10.1186/gb-2008-9-9-r137. [DOI] [PMC free article] [PubMed] [Google Scholar]
Associated Data
This section collects any data citations, data availability statements, or supplementary materials included in this article.
Supplementary Materials
Supplemental Table 1. FMRP targets include chromatin-associated proteins. Related to Figure 1. (A) All FMRP HITS-CLIP targets (published in Darnell, et al., 2011). (B) FMRP targets that function in the nucleus. (C) Categorization of FMRP targets that are associated with chromatin.
Supplemental Table 2. ChIP-sequencing data. Related to Figure 2. (A) ChIP-sequencing RPKM values for H3K4me3 and H3K27ac from neurons and the average RPKM from 3 replicates of H3K4me3 ChIP from cerebellar tissue. (B) Peaks found from ChIP-sequencing data using MACS peak calling. (C) GO analysis of genes with a 1.5 or greater fold increase in both H3K4me3 and H3K27ac occupancy.
Supplemental Table 3. RNA-sequencing data. Related to Figures 3 and 5. (A) All significantly differentially expressed genes in Fmr1 KO neurons. (B) GO analysis of all KO differentially expressed genes. (C) Gene group numbers, overlaps and data source for all comparisons shown in Figures 3D–F and S3M. (D) All significantly differentially expressed genes in Fmr1 KO neurons treated with JQ1 compared to Fmr1 KO neurons. (E) GO analysis of all JQ1 differentially expressed genes. Red highlighted text indicates groups also found in corresponding GO analysis for KO differentially expressed genes. (F) GO analysis of all THZ differentially expressed genes.
Supplemental Table 4. Statistics and oligonucleotide sequences. Related to Figures 1, 5, 6, 7, S1, S3, S4, S5, S6, S7, and STAR Methods. (A) ANOVA values for all relevant figures. (B) Primer sequences used for qRT-PCR and ChIP-PCR.
Supplemental Figure 1. FMRP targets include chromatin-associated proteins. Related to Figure 1. (A) Gene ontology analysis of molecular functions enriched in FMRP HITS-CLIP transcripts. (B) Gene Set Enrichment Analysis (GSEA) of the FMRP HITS-CLIP ranked list. The steep upward slopes in the left portion of graphs indicate a high concentration of hits within the highest confidence FMRP targets. (C) Phenotypes linked to the chromatin-associated proteins found in FMRP HITS-CLIP analysis. (D) Quantification of western blots shown in Figure 1D, normalized to Gapdh. n = 3. (E) Western blot of histone modifications from 3 additional biological replicates of WT or Fmr1 KO cultured cortical neurons (separate replicates from those shown in Figure 1E). (F) Quantification of western blots shown in Figure 1E and S1E, normalized to total histone H3 or H4. n = 6. (G) FMRP levels in neurons transfected with Luciferase, Fmr1 shRNA1, and Fmr1 shRNA2. N = 45, 43, and 46 neurons respectively from Luciferase, Fmr1 shRNA1, and Fmr1 shRNA2 from 5 biological replicates. (H) Average recovery curve of FRAP analysis of GFP-H1 in neurons transfected with luciferase or Fmr1 shRNA. (I) Quantification of the mobile fraction of GFP-H1 from FRAP analysis of neurons transfected with luciferase or Fmr1 shRNA. n = 57 neurons per condition from 6 biological replicates. Scale bar is 10μm. For G, ***p < 0.001, one-way ANOVA with post hoc two-sided t-test. For D, F, I, *p<0.05, ***p < 0.001, two-sided t-test. Bar graphs show mean ± SEM. See also Table S4 for ANOVA values.
Supplemental Figure 2. ChIP-sequencing reveals increased H3K4me3 and H3K27ac in Fmr1 KO neurons. Related to Figure 2. (A) Gene tracks of second replicate of H3K4me3 ChIP-sequencing. (B, C) TSS occupancy (B) and RPKM values (C) for a second replicate of H3K4me3 ChIP-sequencing. (D) Gene tracks of H3K4me3 ChIP-sequencing from neurons cultured from FVB mice show similar results in a different mouse strain. (E, F) TSS occupancy (E) and RPKM values (F) for H3K4me3 ChIP-sequencing from neurons cultured from FVB mice. (G, J) H3K27ac gene tracks of two independent replicates. (H, K) H3K27ac TSS occupancy for all genes in WT and KO neurons from two independent replicates. (I, L) H3K27ac RPKM values from WT and KO neurons from two independent replicates. (M) Overlap of genes with H3K4me3 peaks in WT and KO neurons based on MACS peak calling. (N) Overlap of genes with H3K27ac peaks in WT and KO neurons. (O) Overlap of genes with a 1.5 or greater fold increase in H3K4me3 and H3K27ac occupancy in KO neurons. (P) Gene ontology analysis of the group of genes with a 1.5 or greater fold increase in both H3K4me3 and H3K27ac occupancy in KO neurons. (Q) Overlap of genes with H3K4me3 occupancy in WT and KO neurons sorted from cerebellar tissue. (R) Overlap of genes with KO-specific H3K4me3 peaks from cultured cells and from cerebellar tissue. ***p<0.001, paired two-sided t-test.
Supplemental Figure 3. RNA-sequencing in Fmr1 KO neurons. Related to Figure 3. (A, B) Gene expression in WT (A) and KO (B) neurons of all expressed genes, binned by increasing H3K4me3 signal, shows that genes with greater H3K4me3 occupancy have greater gene expression. (C, D) Gene expression in WT (C) and KO (D) neurons of all expressed genes, binned by increasing H3K27ac signal. (E, F) Differential expression in WT and KO neurons of KO upregulated genes grouped by increasing differential H3K4me3 signal (E) or differential H3K27ac signal (F). (G) WT expression levels of significantly down and upregulated KO genes. (H) Heatscatter plot of RPKMs of significantly down and upregulated KO genes. (I) Boxed area in H expanded to show area of high point density. (J) Gene Ontology analysis of KO downregulated genes. (K) Principle component analysis (PCA) of 3 WT and 3 KO biological replicates shows some variability between replicates on the PC2 axis, while on the PC1 axis, which contributes to 81% of variance between samples, WT and KO samples cluster within the same genotype. (L) The number and percentage of target genes of transcription factors found in the FMRP HITS-CLIP analysis that overlap with KO misregulated genes. (M) The significance of the overlap of Fmr1 KO misregulated genes with targets genes of the transcription factors found in the FMRP HITS-CLIP. (N) Venn diagram of KO misregulated genes and targets genes of all transcription factors that show the most significant overlap with KO genes. (n = 3.) ***p < 0.001, one-way ANOVA with post hoc two-sided t-test. Overlaps, hypergeometric test. Bar graphs show mean ± SEM. See also Table S4 for ANOVA values.
Supplemental Figure 4. Brd4 regulation in WT and Fmr1 KO neurons during development. Related to Figure 4. (A) Brd4 mRNA expression at increasing days in vitro (DIV) in WT and KO neurons. (B) Quantification of Brd4 protein expression in WT and KO cultured neurons from western blots in Figure 4A and 4C. n = 3 biological replicates. (C) Cell by cell quantification of Brd4 staining in cultured neurons shown in Figures 4D. n= 87 and 69 neurons measured for WT and KO from 3 biological replicates. (D) Quantification of Brd4 protein expression in WT and KO cortical tissue from western blots in Figure 4F. n = 3 biological replicates. (Main effect(genotype): F(1,23)=10.31, p=0.00388; main effect(age): F(4,23)=11.39, p=3.03e–5.) (E) Cell by cell quantification of Brd4 staining in cultured neurons in vivo shown in Figures 4I. n= 137 and 176 neurons measured for WT and KO from 3 biological replicates for E. (F–H) Western blot (F) and quantification of Brd4 (G) and phosphorylated Brd4 (H) in WT and KO neurons. n = 3 biological replicates. Western is cropped to remove other experiments run to the right of the lanes shown. (I–L) Brd4 ChIP-qPCR in WT and KO neurons of Gria1 (I), Arc (J), Nr4a1 (K), and Shank2 (L). (N = 4.) For A: two-way ANOVA with post hoc two-sided t-test. For B: one-way ANOVA with post hoc two-sided t-test. For G-L: unpaired two-sided t-test, For A-B, indicates significance relative to DIV 0. *p < 0.05, ***p < 0.001. a.u., arbitrary units. Bar graphs show mean ± SEM. See also Table S4 for ANOVA values.
Supplemental Figure 5. RNA-sequencing in Fmr1 KO neurons treated with JQ1 and THZ. Related to Figure 5. (A) Overlap of JQ1 regulated genes in WT and KO neurons. (B) Western blot of Brd4 target genes (that are decreased by JQ1), FMRP target proteins (that are not affected by JQ1), and histone modifications (some of which are affected by JQ1.) (C–F) qRT-PCR for WT and KO neurons treated with JQ1 for Nr4a1 (C), Shank2 (D), Arc (E), and Gria1 (F). (n = 4) (G–K) qRT-PCR after viral knockdown of luciferase (control) or Fmr1 for Fmr1 (G), Nr4a1 (H), Shank2 (I), Arc (J) and Gria1 (K) demonstrates that changes in gene expression in KO neurons are not due to developmental effects of loss of the FMRP protein. n = 10, 8, 5 for control, Fmr1 shRNA1, Fmr1 shRNA2 respectively. (L–O) qRT-PCR after viral knockdown of luciferase (control) or Fmr1 followed by JQ1 treatment for Nr4a1 (L), Shank2 (M), Arc (N) and Gria1 (O) demonstrates that changes JQ1 reverses even transiently occurring gene expression changes resulting from the loss FMRP expression rather then acting by reversing other long term developmental changes in KO neurons. n = 10, 5, 8, 6 for control, control+JQ1, shRNA1, shRNA1+JQ1. (P-S) qRT-PCR after viral knockdown of luciferase (control) or Fmr1 followed by JQ1 treatment and subsequent washout for Nr4a1 (P), Shank2 (Q), Arc (R) and Gria1 (S) shows JQ1’s effects on gene expression are rapidly reversible. n = 7, 7, 3, 6, 5, 3 for control, control+JQ1, control+JQ1+washout, shRNA1, shRNA1+JQ1, shRNA1+JQ1+washout. (T) RNA-sequencing tracks for Nr4a1 and Shank2 in WT and KO neurons after THZ1 treatment. n = 3. (U) Overlap of KO upregulated genes with THZ1 downregulated genes and vice versa. (V) Gene set enrichment analysis to compare KO up- or down-regulated genes with JQ1 and THZ1 regulated genes. Genes are ranked by fold change in expression between KO and KO treated with JQ1 or THZ1. The group of genes differentially expressed between WT and KO neurons was then mapped onto these ranked lists. Red boxes indicate regions where steep upward slopes are present in the datasets indicating a high density of KO misregulated genes fall in these regions. (W–Z) qRT-PCR for WT and KO neurons treated with THZ1 for Nr4a1 (W), Shank2 (X), Arc (Y) and Gria1 (Z). n = 3. *p < 0.05, ***p < 0.001, one-way ANOVA with post hoc two-sided t-test for G-K, two-way ANOVA with post hoc two-sided t-test for C-F, L-S, AND W-Z. Overlap p values, hypergeometric test. a.u., arbitrary units. Bar graphs show mean ± SEM. See also Table S4 for ANOVA values.
Supplemental Figure 6. Effects of high dose of JQ1 on FXS phenotypes. Related to Figure 6. (A) Preference for the inner verse outer zone preference in an open field test for mice treated with 50mgs/kg JQ1. (B) Total distance traveled during the social interaction test for mice treated with 50 mg/kg JQ1. (C) Total time spent interacting with the Lego and mouse combined for mice treated with 50 mg/kg JQ1. (D–G) qRT-PCR for target genes for Nr4a1 (D), Shank2 (E), Arc (F) and Gria1 (G). using WT and KO cortical tissue isolated from mice after behavioral testing. n = 10, 11, 9, and 8 mice for WT, WT+JQ1, KO, and KO+JQ1. (H–M) Examples (H) and quantification (I–M) of analysis of cell types in the thymus measured by flow cytometry after different treatment paradigms. n = 3 to 4 mice per condition. (N) Hematotoxylin and Eosin stain of sectioned skin from the ear. Arrows indicate example of hyperplasia of the epidermis. (O) Quantification of the width of the epidermis after different treatment paradigms. n = 23 to 29 slices from 3 to 4 mice, with 3 measurements averaged for each slice. (P) Hematotoxylin and Eosin stain of sectioned small intestine shows no major morphology deficits. Bottom row shows higher magnification images. (Q) Total distance traveled over 1 hour in open field testing for mice treated with 25mg/kg JQ1. (R) Number of marbles buried in 15 minutes for mice treated with 25 mg/kg JQ1. (S) Discrimination index of a preference for a mouse relative to a Lego in social interaction testing for mice treated with 25mg/kg JQ1. (T) Preference for the inner verse outer zone in an open field test for mice treated with 25 mg/kg JQ1. (U) Total distance traveled during the social interaction test for mice treated with 25 mg/kg JQ1. (V) Total time spent exploring or interacting with the Lego and mouse combined for mice treated with 25 mg/kg JQ1. (W) Distance traveled during habituation period in the novel object recognition test. (X, Y) Time spent interacting with objects during learning phase (X) or testing phase (Y) of the novel object recognition test. n = 11, 14, 14, and 16 for WT, WT+JQ1, KO, and KO+JQ1 for low dose older cohort. *p < 0.05, ***p < 0.001, two-way ANOVA with post hoc two-sided t-test for A-G and Q-Y, one-way ANOVA with post-hoc unpaired two-sided t-test for J-O. Scale bars are 100μm. a.u., arbitrary units. Bar graphs show mean ± SEM. See also Table S4 for ANOVA values.
Supplemental Figure 7. Brd4 necessity and sufficiency and combination treatment in FXS phenotypes. Related to Figure 7. (A–E) Transcript levels after infection of WT or KO neurons with 2 different Brd4 shRNA lentiviruses for Nr4a1 (A), Shank2 (B), Arc (C), Gria1 (D), and Brd4 (E). n = 3 to 10 biological replicates. (F) Brd4 and Brd4-SSS492ESE expression levels after transfection in WT neurons measured by immunocytochemistry. (G–H) Arc (G) and Gria1 (H) transcript levels in GFP sorted neurons transfected with Brd4 or Brd4-SSS492ESE. n = 5. (I, J) Dose response of target genes for JQ1 (I) and CX-4945 (J). (K, L) Arc (K) and Gria1 (L) transcript levels in WT and KO after combined low dose JQ1 and CX-4945 treatment, or either drug alone at low doses. n = 3 to 5 replicates per condition. n = 3 to 4 replicates per condition. (M, N) Increased spine density in neurons transfected with the phospho-mimic form of Brd4 cannot be reversed with the low dose combination treatment (M) but can be reversed with high dose JQ1 (N). n = 3 to 8 biological replicates per construct with 3 dendrites averaged for each of 5 to 10 neurons counted per replicate. (O) Total distance traveled over 1 hour in open field testing for mice treated with 5 mg/kg of JQ1 or CX-4945. (P) Preference for the inner verse outer zone in an open field test for mice treated with 5 mg/kg of JQ1 or CX-4945. (Q) Number of marbles fully buried in 15 minutes for mice treated with 5 mg/kg of JQ1 or CX-4945. (R) Discrimination index of a preference for a mouse relative to a Lego in social interaction testing for mice treated with 5 mg/kg of JQ1 or CX-4945. n = 3 to 5 mice per condition. (S) Preference for the inner verse outer zone in an open field test for mice treated with 5 mg/kg of JQ1 in combination with 5 mg/kg CX-4945. (T) Total distance traveled during the social interaction test for mice treated with 5 mg/kg of JQ1 in combination with 5 mg/kg CX-4945. (U) Total time spent interacting with both the mouse and Lego in the social interaction test for mice treated with 5 mg/kg of JQ1 in combination with 5 mg/kg CX-4945. n = 16 to 26 mice per condition. *p < 0.05, ***p < 0.001, n.s. nonsignificant, two-way ANOVA with post hoc two-sided t-test for A-D, K-L, O-U, unpaired two-sided t-test for E-H, M-N. (ANOVA in O-R indicates significant differences by genotype, t-test shows significance when all WT mice compared to all KO mice but not in individual groups). a.u., arbitrary units. Bar graphs show mean ± SEM. See also Table S4 for ANOVA values.