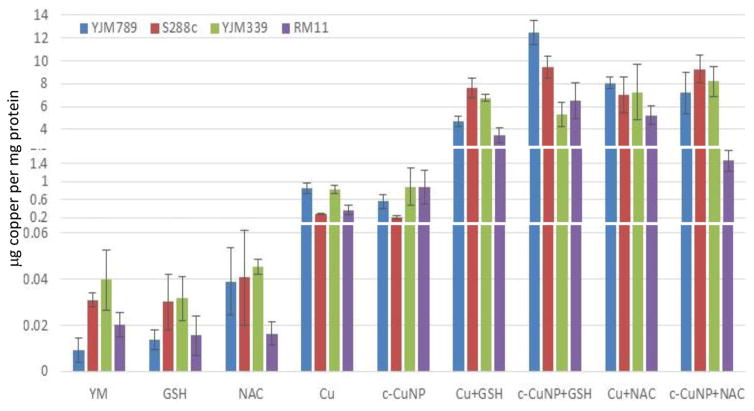
Fig 3. Internal levels of copper in yeast treated with different sources of copper and antioxidants.
Internal levels of copper were measured by atomic absorption spectrometry and normalized to protein content. The following treatments are displayed in this graph: YM, 157 μM c-CuNP, 400 μM CuSO4, 100 μM GSH, 100 μM NAC, 157 μM c-CuNP + 100 μM GSH, 157 μM c-CuNP + 100 μM NAC, 400 μM CuSO4 + 100 μM GSH, and 400 μM CuSO4 + 100 μM NAC. The graph is rescaled to better show the concentrations of the controls. The average of three independent samples for each treatment was determined and plotted error bars.

