

SUMMARY
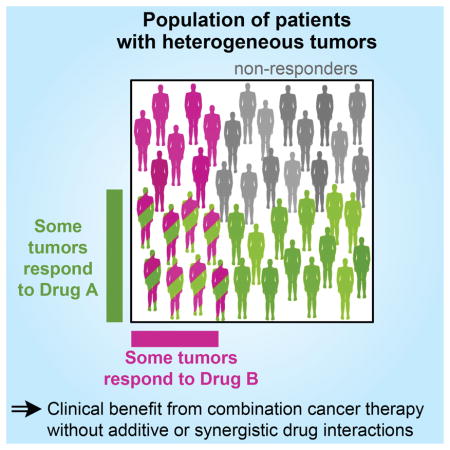
Combination cancer therapies aim to improve the probability and magnitude of therapeutic responses and reduce the likelihood of acquired resistance in an individual patient. However, drugs are tested in clinical trials on genetically diverse patient populations. We show here that patient-to-patient variability and independent drug action are sufficient to explain the superiority of many FDA-approved drug combinations in the absence of drug synergy or additivity. This is also true for combinations tested in patient-derived tumor xenografts. In a combination exhibiting independent drug action, each patient can benefit solely from the drug to which his or her tumor is most sensitive, with no added benefit from other drugs. Even when drug combinations exhibit additivity or synergy in pre-clinical models, patient-to-patient variability and low cross resistance make independent action the dominant mechanism in clinical populations. This insight represents a different way to interpret trial data and design combination therapies.
Keywords: cancer, combination therapy, tumor heterogeneity, clinical trials, drug synergy, pharmacology, systems biology, patient-derived tumor xenograft, mathematical modeling
Graphical Abstract
INTRODUCTION
The genetic and phenotypic heterogeneity of human cancers poses a substantial obstacle to effective therapy. Heterogeneity in drug response from one cell to the next within a single tumor (within-tumor heterogeneity) contributes to disease progression and drug resistance in each patient. Heterogeneity among patients (between-tumor heterogeneity) makes the effectiveness of therapy difficult to predict even for patients whose tumors carry the best available response biomarkers. Overcoming within-tumor heterogeneity was an early rationale for combination cancer therapy: Law (1952) and Frei et al. (1965) argued that cancer cells resistant to one drug might be killed by a second, different drug (and vice versa). Early clinical tests of sequential and combination regimens demonstrated that this logic was also applicable to between-tumor heterogeneity: patients whose cancers did not respond to one drug had a chance of responding to a second, different, drug (Frei et al., 1961; Frei et al., 1965; Freireich et al., 1963).
In pharmacological terms, drugs in such a combination exhibit ‘independent action’ whereby the response of an individual patient to two (or more) drugs equals the response to the more effective drug alone with no additional benefit from the less effective drug (with benefit measured by tumor shrinkage or duration of progression free survival-PFS). Independent drug action assumes no pharmacological interaction (neither additivity nor synergy), and is equivalent to Gaddum’s 1940 definition of noninteraction (Methods). Since then, clinical and pre-clinical studies have confirmed that any single drug may be active in a subset of tumors (Brugarolas et al., 2003; Pritchard et al., 2013) supporting the idea that individual tumors can be more sensitive to one drug in a combination than others (reflecting their sensitivity to the drugs given individually).
Many targeted therapies are currently combined based on molecular reasoning about the functions of targets (Kummar et al., 2010) or evidence of additive or synergistic effects in cell line and animal models. Clinical trials based on molecular reasoning have been successful: for example, co-inhibition of BRAF and MEK in the treatment of BRAF-mutant melanoma (Long et al., 2014). Unfortunately, the concept of drug independence and its distinction from additivity/synergy has been lost over time; a drug combination that is clinically superior (e.g. on a Kaplan Meier plot) is generally called additive or synergistic even in the absence of a quantitative test of pharmacological interaction (such as Loewe Additivity or Bliss Independence which are applicable to cell culture experiments but not clinical trials) (Eder et al., 2010). Distinguishing between drug interaction (additivity/synergy) and drug independence is important because the two are profoundly different at a mechanistic level; in the former case benefit is conferred at the level of individual patients due to drug interaction within tumor cells; in the latter case, benefit is conferred only at the level of patient populations due to variability in drug responses. The distinction influences the interpretation of clinical trial data, the choice between sequential and simultaneous treatment, and the design of new drug combinations.
In this paper we attempt to distinguish between drug interaction and independence in three complementary ways (i) by re-analyzing human clinical trial data in which single and combination therapies are compared, (ii) by mining a database of drug responses for patient-derived tumor xenografts (PDXs), which are generally regarded as the best available animal surrogate of human cancer (DeRose et al., 2011; Gao et al., 2015; Hidalgo et al., 2014), and (iii) by using a first-principles computational model of drug responses in a heterogeneous population of tumors. Remarkably, for many effective and approved combinations we conclude that therapeutic benefit is likely to arise from independent drug action rather than drug additivity or synergy. This analysis identifies occasional cases of truly synergistic drug interactions, and provides an alternative approach to designing new sequential or combination treatment regimens.
RESULTS
An effective combination immunotherapy can be explained by independent drug action
The observed responsiveness of human melanomas to ipilimumab (anti-CTLA-4) and nivolumab (anti-PD-1) individually and in combination demonstrates the benefits achievable with drug independence. In a recent Phase III trial, 24% and 54% of patients (respectively) having previously untreated disease exhibited an objective response to one or the other drug (≥30% reduction in volume of a reference lesion) while the remaining patients experienced little or no benefit (Figure 1A) (Larkin et al., 2015). When ipilimumab and nivolumab were tested in combination, median PFS increased from 3 or 7 months on monotherapy to >12 months on combination therapy, a highly significant improvement. Importantly, combination doses were equal to monotherapy doses except for the first two cycles of nivolumab (dosing for all trials analyzed in this paper is described in Table S1). Anticipated benefits under the assumption of drug independence were calculated by (1) assigning each simulated patient a magnitude of response for each drug individually based on random sampling from the clinically observed monotherapy response distributions (2) assuming no additive or synergistic effect so that each patient’s response equals the better one of their two single agent responses (Figure 1A, tumor volume change; 1B, PFS; see method in Figure S2). This is equivalent to the benefit that would accrue were it possible to give each patient the better of the two drugs for her/his individual tumor. In the case of ipilimumab plus nivolumab, independent action predicts a median PFS of 14 months, similar to what was observed clinically. What is unexpected in this example is the large and clinically significant benefit that can be achieved by independent drug action.
Figure 1. Responses to combination immunotherapy are consistent with benefit arising from variability in therapeutic response to constituent drugs.
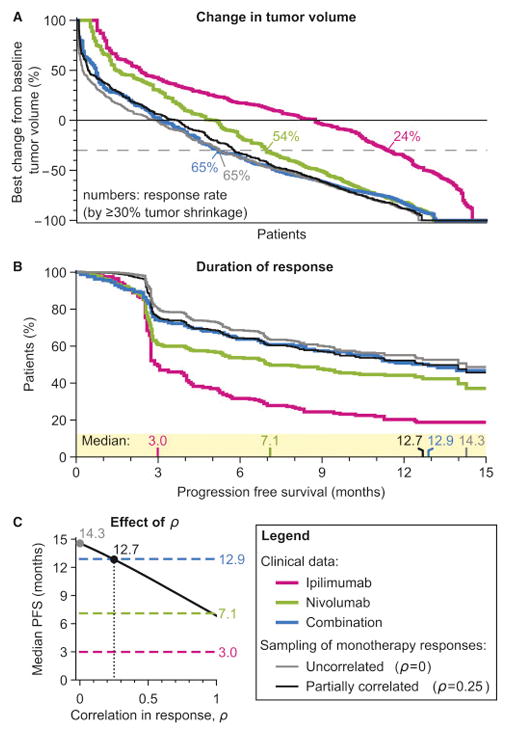
A. The response in a drug trial of human melanomas to nivolumab, or ipilimumab, or both in combination, as depicted by change from baseline tumor volume (a waterfall plot) or, B, duration of progression free survival (a Kaplan-Meier plot). Data from a Phase III trial by Larkin et al. (2015). Gray curve: responses of in silico patients with random sampling from the observed responses to individual drugs under the assumption of drug independence, where each patient’s response to a combination is their strongest monotherapy response. Black curve: sampling with responses assumed to be positively correlated with Spearman’s Rho = 0.25. C, The median progression free survival (PFS) predicted by independent drug action (black) depends on the degree of correlation in drug responses. Dashed lines: observed median PFS of monotherapies or combination.
First principles reasoning establishes that the benefits conferred by independent drug action depend on patient-to-patient variability in responsiveness to the drugs making up the combination, and the degree to which responsiveness is correlated (ρ). Across all of the trials we examined, the distribution of PFS is broad and approximately log-normal (a bell-shaped distribution on a logarithmic time scale). Even when patients are stratified by the best available genetic biomarkers, PFS can have coefficient of variation (CV) as large as 100% (Figure S1). When drug responses are uncorrelated (ρ= 0) the benefits of independent drug action are maximal because each patient has two fully separate chances of above-average response. No benefit is predicted at ρ= 1.0, which corresponds to complete cross-resistance (Figure 1C). The effects of ipilimumab and nivolumab in clinical trials are most consistent with weakly correlated responses (low cross-resistance; ρ ≈ 0.25; Figure 1B, black line; 1C, black dot); for example, the benefits of targeting PD-1 alone are similar whether or not CTLA-4 has previously been targeted (Hamid et al., 2013).
Determining correlation in drug response through analysis of patient derived tumor xenografts
PDX studies comparing the responsiveness of a single tumor to multiple drugs provide the most direct means to determine ρ. In PDX studies by Gao et al. (2015) xenografts of six tumor types from 277 patients were exposed to one of 62 mono- or combination therapies. Across >400 treatment models tested in replicates (net >2000 animals), fewer than 10% of biological replicates differed by >1 RECIST category, showing that response was reproducible across animals and making comparison of each tumor’s response to different drugs feasible. Tumor type (tissue of origin) was poorly predictive of optimal therapy: the drug conferring the greatest average benefit for each class of tumor proved to be optimal for only 49% of individual tumors, with 51% of tumors demonstrating substantially longer PFS on a different drug (a minimum increase in PFS of 4 and average of 12 weeks) (Figure S3A). Thus, like human patients, mice carrying PDX tumors benefit from a ‘precision medicine’ approach in which therapy is informed by data other than tissue of origin. The observed correlation in response for all drugs tested by Gao et al was ρ = 0.37 (average), with lower correlation between targeted and cytotoxic drugs (average ρ = 0.28) and higher correlation between drugs with related targets (average ρ = 0.51) (Figure 2A; Methods). All of these values are within the range over which independent action can improve PFS.
Figure 2. PDX data show that because different tumors respond to different drugs, independent drug action is sufficient for a combination therapy to improve response distribution in a population.
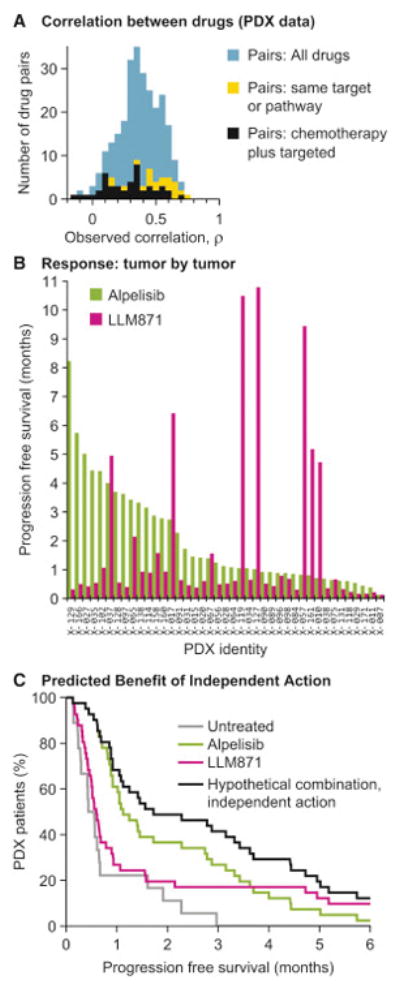
A. Correlations in drug response (Spearman’s Rho applied to PFS) were calculated from PDX trials where the same tumors receive many different treatments (Gao et al., 2015) (Methods). B. Progression free survival measured by Gao et al. in 41 patient-derived gastric cancer xenografts, when treated with Alpelisib (PI3K inhibitor) or with LLM871 (FGFR2/4 antibody-drug conjugate). C. Probability of progression free survival in gastric cancer xenografts when treated with Alpelisib, or LLM871, or a hypothetical combination of the two drugs assuming independent action, where each tumor’s response is the best one of its observed responses to the two monotherapies.
PDX studies clearly illustrate how independent action can provide therapeutic benefit. For example, in the case of mice bearing one of 41 unique gastric PDX cancers, 27% of tumors demonstrated progression free survival of 3 months or more when treated with Alpelisib (a PI3K inhibitor in Phase III trials) as did 17% of tumors treated with LLM871 (a pre-clinical FGFR2/4 antibody-drug conjugate) (Gao et al., 2015). However, among 26 tumor xenografts with below-average responses to Alpelisib were found 5 of the 7 tumors with the greatest responses to LLM871 (response correlation ρ = 0.28; Figure 2B). The combination of Alpelisib plus LLM871 is therefore expected, under a model of drug independence, to provide significantly greater benefit than either drug alone (41% survival at 3 months; hazard ratio versus Alpelisib alone 0.64; 95% C.I. 0.41 to 1.00; p=0.05, n=41 xenografts; Figure 2C) simply because poor responders to Alpelisib have a chance of responding well to LLM871.
Independent drug action explains much of the benefit of combination therapy in PDX trials
Gao et al. observed that across all drugs and tumor types combination therapies were broadly superior to monotherapies. Focusing on the most systematic subset of this data (Figure S3B) we find that drug independence can quantitatively account for almost all of this superiority (Figure 3A–C). Except in the case of melanoma PDXs (discussed below), the benefit predicted for randomly selected pairs of monotherapies was not significantly different from the average benefit observed with empirically tested combinations (hazard ratio for combinations versus random monotherapy pairs 1.13; 95% C.I. 0.93 to 1.38; p= 0.23; n=197 PDXs) (Figures 3A, 3B, S4A, S4B). As the number of drugs in the combination increases, benefit is predicted to increase but with diminishing returns (Figure 3D), consistent with trials showing that more intensive combination regimens do not necessarily confer additional benefit (Bookman et al., 2009; Fisher et al., 1993).
Figure 3. In PDX trial data independent drug action explains most of the benefit of combination therapy with rare exceptions of probable synergy.

A. Probability of progression free survival over time, comparing each PDX’s average response to monotherapies (green) or average response to combinations (blue) (Gao et al., 2015). Choosing random pairs of monotherapies and assuming independent action (black) reproduces much of the observed benefit of combinations (no significant difference in hazard ratio). B. Box-whisker plot of response rates by RECIST (stable, partial or complete response) of all monotherapies (M), all combinations (C), or random pairs of monotherapies (RP); *** denotes p<10−5 by Kolmogorov-Smirnov test, ns denotes not significant. C. Survival distributions for the best observed response of each PDX to any monotherapy or to any combination are statistically indistinguishable. D. Hazard ratios (with 95% confidence intervals) from survival distributions that were computed, under the assumption of independent drug action, for multi-drug combinations in which each PDX is treated with the 0 to 4 most effective monotherapies for that tumor type. E. Progression free survival over time for a select few drug combinations and their constituent monotherapies, where combination responses that exceed independent drug action indicate additive or synergistic effects in individual tumors (Figure S4D displays all six cases).
See also Figures S3, S4, Data S1.
Combination therapies that work by independent action are predicted to confer benefits equal to those of the best monotherapy for each individual tumor; in contrast, pharmacological additivity or synergy predicts superiority across the population for the best combinations relative to the best monotherapies. When all PDX tumors and drugs were examined, we found that that best monotherapies and best combinations selected after the fact produced statistically indistinguishable survival distributions (hazard ratio for monotherapies vs. combinations 0.95; 95% C.I. 0.79 to 1.15; p=0.61; n=230) (Figures 3C, S4C). Thus, giving each PDX tumor the best drug for that individual tumor based on postdiction (i.e. “perfect” tumor stratification) conferred the same benefit as using the best combination. Conversely, combination therapy in human populations may compensate for our current inability to predict which drug will be optimal for each patient.
A small number of the drug combinations tested by Gao et al. conferred benefits that were substantially greater than what is expected from independence of action (Figures 3E, S4D). Most exceptionally, melanomas treated with binimetinib (a MEK inhibitor in Phase III testing) plus ribociclib (LEE011; a CDK4/6 inhibitor in phase III testing) exhibited 5 times longer PFS than predicted by independent action. Because drug independence is the null model for scoring drug interaction (see below), it is reasonable to conclude that ribociclib and binimetinib exhibit additive or synergistic interaction.
Analysis of human clinical trial data
To determine whether independent drug action might explain results from human clinical trials, we analyzed phase II and III data for which Kaplan-Meier survival curves are available for two drugs individually and for their combination in the same disease subtype and treatment stage (e.g. first-line, or recurrent disease). This analysis is necessarily limited to trials in which data are available for monotherapy and combination arms and in which dosing was comparable across monotherapy and combination trials: it is not possible to compare trials in which drugs in a combination are used at different doses than as monotherapy. Suitable data exist for melanoma, ovarian, colorectal, pancreatic, and breast cancers treated with inhibitors of intracellular kinases, immunotherapies, chemotherapies, growth factor receptor inhibitors as well as drugs that inhibit DNA repair and angiogenesis (Figure 4, Table S1). Survival curves predicted by independent drug action were simulated by sampling observed single agent distributions, with the net response of each simulated patient made equal to the better of the two monotherapy responses (as in Figure 1). Because the bulk of available trial data involved targeted drugs plus cytotoxic drugs, sampling was conducted with partial correlation in the range observed for cytotoxic and targeted therapies in PDX studies (ρ = 0.28 ±0.20, Figures 2A, S5A; code is provided, Data S1).
Figure 4. Survival distributions observed in human clinical trials of combination therapies are similar to those expected for independent drug action given the observed variability in response to monotherapy.

Human clinical trials of combination therapies were identified in which the efficacy of two drugs could be compared to the constituents alone at same or similar dosage (one ‘constituent’ could be a combination of fewer drugs) in patient cohorts with matching type and stage of disease. Progression Free Survival distributions under combination treatment were simulated assuming drug independence by sampling observed monotherapy responses with ρ = 0.28±0.20 (correlation range from PDX data, Figure 2A), which generates a range of predictions in gray. Data obtained from the following trials: A. Paclitaxel plus carboplatin, with or without olaparib (Oza et al., 2015); olaparib monotherapy (Liu et al., 2014). B. First-line chemotherapy (anthracycline plus cyclophosphamide, or paclitaxel only in event of prior adjuvant anthracycline), with or without trastuzumab (Slamon et al., 2001); first-line trastuzumab monotherapy (Vogel et al., 2002). C. Gemcitabine with or without erlotinib (Moore et al., 2007); erlotinib monotherapy in gemcitabine-resistant patients (Renouf et al., 2014). D. Dabrafenib with or without trametinib (Long et al., 2014); trametinib monotherapy (patient subset not previously treated with BRAF inhibitor) (Kim et al., 2013). E. Gemcitabine plus carboplatin, with or without bevacizumab (Aghajanian et al., 2012); bevacizumab monotherapy in platinum-resistant patients (Burger et al., 2007). F. Chemotherapy only (FOLFOX4: fluorouracil, leucovorin, and oxaliplatin), or bevacizumab only, or FOLFOX4 plus bevacizumab (Giantonio et al., 2007). G. 5-fluorouracil, oxaliplatin, or both (Ducreux et al., 2004). H. Benefits attributable to drug synergy were quantified as the Hazard Ratio of observed PFS with combination therapy versus PFS predicted with independent drug action. I. Pooled analysis of FOLFOX4 or FOLFIRI (fluorouracil, leucovorin, irinotecan) with or without cetuximab (Bokemeyer et al., 2012); cetuximab monotherapy for chemotherapy-refractory disease (Karapetis et al., 2008) (in all cases analyzing only KRAS-wildtype tumors). In this simulation the benefits of cetuximab monotherapy over supportive care were added to overall survival with first-line chemotherapy.
See also Figures S2, S5, Table S1, S2, Data S1.
The clinically observed benefits for the majority of cancer combination therapies we analyzed were indistinguishable from those predicted for independent drug action (Figure 4A–D; and Figure 1). For example, the addition of trastuzumab to chemotherapy in HER2-positive metastatic breast cancer extends PFS to the degree predicted by independent action. Combinations of olaparib plus chemotherapy in ovarian cancer, and erlotinib plus gemcitabine in pancreatic cancer were also consistent with drug independence. When drugs have similar mechanisms of action, for example inhibitors of BRAF and MEK kinases in BRAF-mutant melanoma, PDX data reveal more highly correlated responses (Spearman’s ρ = 0.72), but even so, the benefit of this drug combination in human patients is no better than that expected for independent action (Figure 4D). Since these combinations are FDA approved, we conclude that the benefits conferred by independent drug action can be clinically and statistically significant relative to monotherapy.
Drug interaction and drug independence represent two competing hypotheses to explain the superiority of combination therapy. By analogy to the null models for Loewe Additivity and Bliss Independence, independent drug action predicts clinical effect under a null hypothesis of “no interaction”. This extends similar, albeit simpler, calculations of independent drug action that were observed, in the 1960s, to be accurate in describing combination therapy for leukemia (Frei et al., 1965). The competing hypotheses of drug independence and interaction can be rigorously compared based on goodness of fit to data with or without a penalty for model complexity (evaluated by Akaike Information Criterion; AIC). The simplest response models are phenomenological and involved scaling survival curves for monotherapies (from Figures 1 and 4A–D) in the vertical or horizontal directions (or both) to clinical data on combination therapies. Even with trial-specific parameter fitting, these models had inferior goodness-of-fit as compared to the predictions of a drug independence model with no fitting. With respect to complexity, curve-fit models were judged by AIC to be 7000-fold less probable than models of drug independence (Table S2); mechanistically detailed models will be even less probable because they require more parameters and will be penalized by AIC. We therefore conclude that drug interaction is only necessary as an explanation for the majority of combination clinical trial data if the drugs are assumed to have strong cross-resistance (i.e. highly correlated responses; Figure S5A). While this is possible in principle, clinical data on patient populations (and PDX data discussed above) suggest that drugs with different mechanism of action rarely exhibit complete cross-resistance and even drugs with similar mechanisms are not necessarily cross-resistant (e.g. doxorubicin plus ifosfamide vs. epirubicin plus cyclophosphamide; (Polyzos et al., 2000)). We will later discuss why independent action is so prevalent in the face of commonly observed ‘drug synergy’ in pre-clinical studies.
Additional empirical evidence consistent with independent drug action can be found in combinations that are equally effective when administered sequentially or simultaneously. For example, increases in survival observed in a clinical trial of cetuximab as a salvage monotherapy for chemotherapy-refractory metastatic KRAS+ colorectal carcinoma precisely matched those of cetuximab combined with chemotherapy as a first-line combination (Figure 4I). Note however, that no data is available on 20% of patients still alive at the end of the trials. This caveat about long-term survival is generally applicable because available trial data rarely quantify very long-term survival.
In approximately one-third of combinations examined, independent action was insufficient to explain observed clinical benefit (Figure 4H). For example, the combination of bevacizumab with chemotherapy in ovarian and colorectal cancers (Figure 4E, F) extends PFS ~2 months longer than expected for drug independence. This finding is consistent with reports that bevacizumab enhances response to chemotherapy via normalization of tumor vasculature (Goel et al., 2011). 5-fluorouracil plus oxaliplatin show synergy in advanced pancreatic cancers; no benefit is expected from independent action in this case because monotherapy responses are uniformly brief (Figure 4G). In low-grade oligodendroglioma, PFS for chemotherapy plus radiation is also superior to the prediction of independent action (Figure S5B).
Implications for design of new combination therapies
Our findings suggest an approach to designing combination or sequential regimens based on maximizing the chance of response to at least one drug. Simulation shows that drugs cannot be combined at random: across all possible drug pairs in PDX data from Gao et al. (2015), fewer than 5% of combinations of individually active drugs were expected to improve PFS when compared to the best observed monotherapy per tumor type (Figure 5A). This low rate of success is consistent with evidence that drug combinations superior to individual ‘standard therapies’ can be challenging to identify in the clinic.
Figure 5. Using monotherapy trials to nominate drug combinations based on independent drug action.

All possible pairs of monotherapies tested in PDX models by Gao et al. (2015) were simulated under the hypothesis of independent drug action, in which each xenograft’s response to a combination is the best of the two observed monotherapy responses. A. Histogram of hazard ratio for disease progression for all possible combinations compared to the overall best monotherapy for each tumor type. Bars are colored by p-value that Hazard Ratio < 1. B. Survival distributions for best predicted combinations, and observed survival with constituent monotherapies, for each of three tumor types (Figure 2 showed best prediction for gastric cancer). Left: Bar charts of PFS in each PDX. Right: survival curves observed for monotherapies and predicted for their combination. All projected improvements in response rate exceed what is expected from animal-to-animal variability reported by Gao et al. (all p-values < 0.05; Figure S6). C. PFS for the best observed monotherapies, best observed combinations, and best predicted combinations per tumor type for gastric, pancreatic, breast, and colorectal cancer. D. PFS for combination therapies predicted from a clinical trial comparing monotherapies for non-small cell lung cancer with ALK-rearrangement (Shaw et al., 2013). Simulations used response correlation ρ = 0.28 ± 0.20, as observed in PDX trials (Figure 2A).
In four of six tumor types we were able to identify combinations with the potential to significantly increase PFS as compared to monotherapy by independent drug action (Figures 2C, 5B: hazard ratio 0.69; 95% C.I. 0.55 to 0.87, p=0.002, n=148 PDXs analyzed in aggregate, because individual tumor types had too few PDXs for statistical power). In these cases, the predicted benefits matched the observed benefits of the best combinations tested experimentally (Figures 5C, S6; hazard ratio for predicted versus observed 0.84; 95% C.I. 0.67 to 1.07; p=0.15, n=148 PDXs). The combinations predicted to be most efficacious in the case of pancreatic (Gemcitabine plus Binimetinib) and breast cancer (Buparlisib plus Paclitaxel) were among the least cross-resistant of all drugs tested in PDX animals (Spearman’s ρ <0.1).
Human trial data for monotherapies can also be used to predict the effects of new drug combinations acting independently. For example, in the case of non-small cell lung cancers having ALK-rearrangement (Shaw et al., 2013), independent action predicts that a combination of crizotinib plus pemetrexed should confer benefit in excess of monotherapy but that this should not be true of crizotinib plus docetaxel (Figure 5D). The combination of crizotinib plus pemetrexed is reportedly tolerable at full doses (Gandhi et al., 2013) and exhibits no cross-resistance (Berge et al., 2013); these are the traits desirable in combinations of drugs that act independently.
Modeling heterogeneity in therapeutic response
To thoroughly explore variables impacting the efficacy of independent drug action we adapted a classic model of tumor kinetics developed by Steel (1967) in which tumor growth depends on the balance between cell growth (g) and cell loss (ϕ) (Figure 6A; see Methods). The effects of anti-cancer drugs were modeled as reducing g, whereby high drug sensitivity results in a ‘log-kill’ effect. Tumor-to-tumor variability was introduced by sampling drug sensitivity from a log-normal distribution consistent with clinical trials (Figures 6B, S1).
Figure 6. Simulations of patient heterogeneity in clinical trials show that independent drug action is similar in effect to additivity or synergy.

A. A classic model of tumor kinetics involving competing processes of growth (g) and cell loss (gϕ). Treatment with inhibitor at dose [I] slows growth by (1+[I]/KI)−1. B. Drug sensitivity KI was taken to be log-normally distributed across a patient population (gray distribution). The effect of therapy on tumor proliferation at any given KI (red line) is quantified by the growth rate inhibition metric (GR) (Hafner et al., 2016). C. A simulated waterfall plot of changes in tumor volume after 8 weeks of monotherapy. D. Representative traces of tumor volume over time in individual tumors treated with monotherapy. Tumors are modeled with pre-existing drug resistant subclones that cause eventual progression. E. Progression free survival (time to tumor volume doubling) under mono- or combination therapies. A combination of independently acting drugs with benefit from patient-to-patient variability was modelled by assigning each tumor a KI for each drug, comparing low, medium, or high correlation between the drugs. Under independent action, tumor cells only respond to the most effective single drug (no additive effect). Additive or synergistic drug combinations were modeled as acting like a higher dose of monotherapy. F. Progression free survival time with a combination that requires dose reductions to 66% of single agent doses, equivalent to an antagonistic interaction with full doses. Precision monotherapy was modeled by treating each tumor with the best one of two drugs for that tumor. G. The hazard ratio of an independent drug combination, versus monotherapy, as a function of drug activity and response correlation between drugs. Lower panel: Progression free survival for each numbered scenario.
See Figures S1, S7, Data S1.
Kinetic parameters (e.g. cell division rates, cell loss factor) were calibrated against data from human carcinomas (Methods; Data S1) and results were robust to variation over clinically relevant parameter ranges (Figure S7A). Simulated tumors were observed to grow or shrink on treatment with a degree of variability similar to that observed in drug trials (Figure 6C). Moreover, when acquired drug resistance was simulated (Methods), variable periods of remission and tumor regrowth were observed (Figure 6D) and PFS exhibited the variability observed in human clinical data (Figure 6E). Results held for continuous or cyclical dosing, and also when using the Gompertz growth model (Figure S7B).
We modeled a drug combination involving independent action by sampling from log-normal distributions to assign in silico tumors a different sensitivity parameter for each drug (Figure 6B), with a range of correlation in response. Each tumor cell was affected only by the drug to which it was most sensitive. As expected from PDX data, two-drug combination therapy can substantially improve PFS simply because some tumors respond well to drug 1, some to drug 2, and some to both drugs (Figure 6E). Modeling also allowed us to compare independent action with drug additivity or synergy at a cellular level (with no benefit from patient-to-patient variability because drugs are assumed to have complete cross-resistance). Treating synergy in the manner defined by Loewe (Berenbaum, 1989), in which two drugs are equivalent to a higher dose of one drug, we found that the benefits of independent action with uncorrelated response equaled those of a three-fold increase in drug dose. This represents a Combination Index of 0.33 which has been interpreted as significant synergy in pre-clinical studies. The benefit of having uncorrelated drug responses is so large that combination therapies could require substantial dose reduction, or equivalently, have antagonistic interaction in individuals, and still produce superior survival to monotherapy in the population (Figure 6F). Theory predicts that in such scenarios, giving each patient their most effective single agent at full dose (precision monotherapy) might be superior to combination therapy. Simulation also shows that drug independence and additivity or synergy are not mutually exclusive and can jointly contribute to superior outcomes (Figure S7C). The CLEOPATRA study involving treatment of HER2AMP metastatic breast cancer with Docetaxel plus a pair of anti-HER2 antibodies thought to act synergistically on different epitopes on a single target (Pertuzumab and Trastuzumab) may exemplify a combination involving both independence and synergy (Fuentes et al., 2011; Swain et al., 2015).
Modeling also enables systematic exploration of factors that determine the effectiveness of combination therapy under the assumption of independent action. The greatest benefits arise with drugs that have similar activities when used as monotherapies and a low correlation coefficient (Figure 6F). Benefit can still arise with partial correlation (some cross-resistance) when both drugs have good individual activity; and a second drug of modest activity can confer benefit provided that it lacks cross-resistance. If present, drug additivity or synergy can confer additional benefits. Other parameters are also influential, such as the degree of variability in response, and we provide software for exploring potential combinations based on real clinical trials data or on simulations with parameters commonly encountered in trials (Data S1).
DISCUSSION
In an era in which the majority of new cancer medicines target specific genes, many combination therapies have a biological rationale based on a molecular understanding of drug action and interaction. However, theory predicts, and drug trials in humans and PDX animals show, that the superiority of many approved combinations can be explained by the simpler and older ‘null-hypothesis’ of independent drug action. Independent action appears to be a sufficient explanation even for drug trials stratified using response biomarkers (e.g. HER2AMP for trastuzumab (Slamon et al., 2001)) and for drugs with similar mechanisms of action (e.g. combination immunotherapy or combination kinase inhibition). The historical development of cytotoxic combination therapies, which often involve three or more drugs, may also have involved independent drug action but this is largely a speculation for lack of sufficient data. A clear exception is childhood acute lymphoblastic leukemia where the benefits of two-drug combinations were originally explained by independent action (Frei et al., 1965). Unfortunately, the absence of data also precludes us from assessing the relevance of independent action to neo-adjuvant or adjuvant combinations of cytotoxic agents.
There is no doubt that additivity or synergy is exhibited by some drug combinations which achieve responses that are superior to those expected of independent drug action. In the case of curable blood cancers, for example, monotherapies achieve few if any cures whereas multi-agent cure rates are as high as 80% (Frei, 1985). Thus, the long-term goal of translational cancer research rightly remains the identification of drug combinations that act in an additive or synergistic fashion on human tumors. Computational modeling and clinical data (Swain et al., 2015) suggest that synergy and independent action can jointly contribute to improve patient benefit.
The efficacy of independent action in a drug combination depends on the extent of patient-to-patient variability and degree of correlation among monotherapy responses. Variability in response can be measured directly and typically approximates a log-normal distribution. Long-tails in survival distributions increase the benefit of independent drug action because a subset of patients may experience benefit that is well above average. Correlation in drug response cannot be measured directly in human trials but can be calculated from PDX data, or inferred from clinical evidence of cross-resistance or the lack thereof which can be identified in trials of sequential treatments. For the majority of drug combinations found to confer benefit through independent action, clinical data indicate low rates of cross-resistance (BRAF and MEK co-inhibition is an exception). In general, high inter-patient variability and relatively low correlation between drugs is consistent with response to each drug being a multigenic trait.
Clinical trials are increasingly guided by biomarkers that aim to predict which patients will respond to which drugs. In some diseases, individual patients are also shifted from one therapy to another following disease progression. These considerations are consistent with the idea that combination therapies provide benefit in part by overcoming imperfect knowledge of how well any individual tumor will respond to a specific drug. However, our findings suggest that caution is necessary when interpreting positive clinical results for a drug combination in terms of pharmacological additivity or synergy. This is a distinct phenomenon from clinical additivity, which is more loosely defined as improvement in response rate or survival distributions for populations of patients (Figure 7A). Based on first principles reasoning and information criteria for model selection we argue that independent drug action represents a null model for PDX or patient data that is analogous to the null models used to assess synergy in cell culture (Berenbaum, 1989). If clinical benefit does not surpass the predictions of independent drug action, then this explanation should be considered the more parsimonious.
Figure 7. When sensitivity to different drugs varies between patients, independent drug action is expected to confer clinical benefit and pharmacological additivity or synergy may have limited effect. A.

Superior responses to combination therapy versus monotherapy have two possible explanations: two drugs could act together with additivity or synergy to induce stronger responses in individuals; or two drugs could improve the response distribution solely by independent action because some tumors are sensitive to the first drug and some other tumors more sensitive to the second drug. B. Wide variation in drug response, and low correlation in responsiveness to different drugs, predicts that most patients will benefit from combination therapy because of independent drug action. Each circle represents a tumor, with intensity of blue or red color indicating strength of response to each of two drugs. Most tumors primarily respond to one drug or neither. Additivity or synergy, if present, might be evident only in a minority of patients with partial response to each drug (yellow region). C. In situations with high response rates, more patients might experience synergistic benefit from two strong responses. D. In situations where responses to two drugs are highly correlated, as may occur with similar mechanisms of action, benefit may be more dependent on additive or synergistic effect.
Why do drugs that exhibit synergy in cell culture and xenograft mice confer benefits in patients no greater than those expected for independent action? Possible explanations include unfavorable pharmacokinetics (Undevia et al., 2005), the difficulty of scoring synergy in pre-clinical data (Hafner et al., 2016), and the sensitivity of synergy to genetic variation. Drug interactions are also known to vary with dose and our analysis is relevant only to clinical dosing, which frequently differs from pre-clinical dose. However, a much simpler explanation rooted in the variability of response may suffice. In a combination therapy involving drugs X plus Y, both of which are relatively active on their own, some patients respond strongly to X and some to Y (Figure 7B); a third subset responds well to both drugs and a fourth subset to neither drug. Drug additivity or synergy, if it exists, will only be detectable in the subset of patients (yellow) that exhibit a partial response to drugs X and Y (analogous to synergy in cell culture being greatest at drug doses provoking intermediate responses). The effects of synergy in this patient subset is obscured for precisely the same reason that independent action is beneficial: high patient-to-patient variability.
Independent drug action provides a simple explanation for trials in which sequential and combination therapy are equivalent (although other explanations are also possible). For example, in metastatic breast cancer, phase III trials and meta-analysis show that whereas combinations of cytotoxic agents achieve higher response rates than monotherapies, overall survival is no better than when the same drugs are used sequentially, switching from one drug to the next upon progression (Cardoso et al., 2009; Sledge et al., 2003). The benefits of combinations based on independent action provide a rationale for sequential dosing, but whether sequential or simultaneous drug administration will be optimal for any specific disease depends on factors beyond the scope of the current paper such as pharmacokinetics and the evolution of drug resistance (Bozic et al., 2013).
Toxicity is a critical consideration in the design of any combination but is not studied here due to insufficient data. Combinations acting by independence have the advantage in principle that they can be delivered as toxicity-sparing sequential regimens. Our ability to exploit independent drug action would be improved by better estimates of ρ, which could be obtained by aggregating PDX data on monotherapies from ‘mouse avatar’ trials, in which a tumor from a single patient is tested against a panel of drugs (Malaney et al., 2014). Our analysis also indicates a need for additional PDX data on cytotoxic drugs, which constitute many of the most effective anti-cancer treatments available.
The analysis in this paper has several caveats that might be addressable in future studies. First, we are able to analyze only those drug combinations in which dosing for monotherapy and combination therapy is similar. Second, we cannot analyze benefits in the 10% to 40% of patients who experience PFS beyond the end of most clinical trials. For those patients, two strong drug responses might kill more tumor cells and confer a synergistic survival benefit; whether this is true could be addressed by long-term follow-up of trials. Third, synergy might be more prevalent in clinical scenarios with higher response rates, such as neo-adjuvant treatments for primary tumors (Figure 7C). Similarly, in the case of hypothetical drug pairs with strong cross-resistance or correlation in response (Figure 7D), independent action will be relatively unimportant.
Given these caveats, how might the theories in this paper be tested? Drug independence and interaction could be distinguished in individual human tumors by personal drug sensitivity profiles. Several such technologies are in development, including implantable or microinjection devices to measure in situ drug response in humans (Jonas et al., 2015; Klinghoffer et al., 2015) and drug response profiling on tumor xenografts or biopsies (Hidalgo et al., 2014). A weakness of such assays is that they do not account for differences in pharmacokinetics which may play a substantial role in patient-to-patient variability (Undevia et al., 2005). Such differences could be measured using newly developed pharmacodynamic assays that measure drug effects at the level of individual tumor cells, such as by multi-dimensional histology.
Clinical studies involving accurate pre-exposure response biomarkers or on-treatment pharmacodynamic assays will make it possible to test two predictions of our theory. First, precise patient stratification might reveal cases of drug synergy in specific subpopulations that are masked in current studies by high patient-to-patient variability. Second, for drug combinations and patient cohorts in which independent action is in fact the basis of superiority, we predict that biomarker-guided delivery will make it possible to use fewer drugs. For example, basal-like subtypes of HER2AMP breast cancer were found to respond no better to trastuzumab plus chemotherapy than to chemotherapy alone (Perez et al., 2017). The advantage of substituting a single drug for a combination is the possibility of minimizing toxicity and optimizing dosing: drugs in a combination are often used at a lower dose than in monotherapy.
Although we find little evidence of additivity or synergy in many successful combination therapies, this should not be interpreted as a negative result because independent drug action provides an alternative rationale for the near-term design of new combinations. As understanding of drug interaction in cancer cells improves, and variability in drug response is reduced through better patient stratification, we expect synergistic drug combinations to provide superior benefits to independent drug combinations: in PDX studies spectacular benefits appear to be achievable from drug interaction. In the meantime, it is worth identifying new combination or sequential regimens that optimally exploit drug independence.
STAR METHODS
CONTACT FOR RESOURCE SHARING
Further information and requests for resources should be directed to and will be fulfilled by the Lead Contact, Peter Sorger (peter_sorger@hms.harvard.edu).
METHOD DETAILS
Definitions of additive, synergistic, and independent drug effects
The terms ‘additive, ‘synergistic’, and ‘independent’ drug effects are used in research literature with different meanings, particularly between pre-clinical and clinical settings. Before describing analysis and simulations of human trials, we begin with rigorous definitions to protect the reader from any semantic misunderstanding.
In clinical oncology research the words ‘additive’ or ‘synergistic’ lack mathematical definition, and are not clearly distinguished from one another (Eder et al., 2010), but refer to a drug combination effect that is significantly superior to the effect of the best constituent monotherapy alone.
In pre-clinical oncology research, most commonly in cell culture based measurements of drug response, drug combination effects are described according to mathematical definitions. In these experimental contexts, the terms additive, synergistic, or antagonistic ‘drug interactions’ usually refer to pharmacodynamic interactions, not pharmacokinetic interactions. Berenbaum (1989) provides an excellent review of pharmacodynamic drug synergy. To briefly summarize the two dominant models, ‘Bliss Independence’ determines that there is no drug interaction when two toxins confer statistically independent probabilities of cell death (thus, surviving fractions are multiplied), and ‘Loewe Additivity’ determines that there is no interaction (or an ‘additive interaction’) when a two drug mixture has potency equal to twice the dose of one drug (for example, half the IC50 of one drug plus half the IC50 of a second drug is exactly the IC50 of the combination).
The model of drug independence presented in this article is at once more simple and more conservative than the ‘no-interaction’ models of either Bliss or Loewe: we hypothesize that the effect of two drugs in combination is only that of the one most effective constituent drug. This definition of ‘independent drug action’ proposes neither additive effect nor even a small ‘sub-additive’ enhancement of effect. This is consistent with the meaning used by Frei et al. (1961), and with the classification proposed by Gaddum (1940), which called any combined effect stronger than a single drug ‘synergism’, any effect weaker than a single drug ‘antagonism’, and a combined effect exactly equal to the strongest single drug ‘independence’. In some contemporary literature this model is called ‘Highest Single Agent’. In this framework, effects consistent with either ‘Loewe Additivity’ or ‘Bliss Independence’ would cause two drugs to be more effective than one drug, and would be called ‘synergistic’ by Gaddum.
Therefore, throughout the manuscript we refer to drug responses that are superior to independent drug action as ‘additive or synergistic’ (without drawing a distinction between the two), which is consistent with both Gaddum’s quantitative definition and with contemporary usage of the words in clinical research.
Analysis of human clinical trials
Survival functions for clinical trial data were extracted from published Kaplan-Meier survival curves by image processing (the data are not available in digital form). Survival data published in vector form was processed in Adobe Illustrator to remove censor marks and dashing, and to separate trial arms to individual images. Survival data that were published only in a pixelated form were digitally traced in Adobe Photoshop. After producing separate image files for each treatment condition, a high-resolution raster (at minimum 2000 pixels high) was processed by a custom script in Wolfram Mathematica which measured the number of pixels in each row between the time=0 mark on the horizontal axis and the survival function. The number of pixels per row was calibrated against tick marks on the time axis to convert to the duration of progression-free survival. It would obviously be preferable to start with the original numerical data, but we are aware of no repository of such information.
In the case of Figure 4F, published bevacizumab response data does not show individual events because the published data was a fitted curve (Giantonio et al., 2007); accurate event data for the other arms of this trial (E3200) was obtained from the European Medicines Agency review of bevacizumab.
We describe first the simulation of independent drug action in the case of uncorrelated responses. Each of many simulated patients is assigned a response to each of two drugs, by sampling at random from the clinically observed probability distribution of progression free survival times on monotherapy. The two drugs are taken to have no additive or synergistic effect in any individual, and so each patient’s PFS under the combination is whichever one of their two drug responses is the best. This process defines a response distribution over the simulated population, of approximately 2000 to 10,000 patients depending on the resolution of the source clinical trial images.
The case of partially correlated drug responses requires the construction of a joint distribution of PFS times with a defined level of correlation. This is achieved by taking a rank-ordered lists of PFS times for each of two drugs (i.e. a perfectly correlated joint distribution), and adding a level of random noise to the rank position (not the PFS content) of each entry. The amount of random noise in position is increased until the two lists of PFS times reach the intended level of partial correlation, as calculated by Spearman’s rank correlation coefficient ρ. The resulting partial correlations in response have the effect that resistance to one drug has an association with resistance to the second drug; this effect ranges from no association at ρ =0 to perfect association (complete cross-resistance) at ρ=1. The effects of combination therapy were simulated by assigning each patient a set of responses (one to each monotherapy) from a single random sample of the joint distribution, and then defining PFS for combination therapy to equal the longer of the two monotherapy PFS times. This process was repeated for ~2000 to 10,000 patients at each correlation. This process is illustrated step-by-step in Figure S2. Full code for image analysis and simulation of combination responses is provided (Data S1).
Analysis of PDX trial data
Data on PDX animals were derived from a published dataset (Gao et al., 2015) reporting the time to tumor volume doubling (hereafter PFS) in 4,533 drug-treated PDX-bearing mice. The database contains information on 277 unique PDX tumors across six tumor types. Animals received one of 36 single-drug treatments or 25 combinations. Our analysis focuses on 230 PDX models that were subject to testing in many different monotherapies (average 13) and combinations (average 5) (Figure S3B); the remaining 47 PDX models were tested in limited selections of therapies. For each PDX we calculated the following characteristics: average PFS for all single-agent or combination therapies applied to that particular PDX tumor; the best PFS observed across all monotherapies (or all combinations) applied to that particular PDX; and the hypothetical response to random pairs of monotherapies, calculated as the average over 104 iterations involving selecting a pair of drugs tested on that PDX, and assuming that PFS under the hypothetical combination would be the longer of the two individual responses. Response rates were also calculated for all monotherapies, all combinations, and for random pairs of monotherapies where a PDX was assumed to respond to the pair if it responded to either monotherapy (Figure 3B).
The expected effects of drug combinations under ‘independent drug action’ (in Figures 2C, 3E, 5B, and Figure S4) is determined by assigning to each PDX its best experimentally observed response to either one of the single drugs that constitute the combination. Correlations in response between different single drugs were computed by Spearman’s Rho rank correlation of PFS. In Figure 2A, analysis of correlations between ‘all active agents’ refers to pairs of individually active monotherapies, defined by a hazard ratio for progression ≤0.7 (Cox proportional hazards model) when compared to untreated xenografts (each drug’s hazard ratio presented in Data S1, PDX analysis code). Drug pairs of ‘same target or pathway’ were defined according to the following groups of mechanistically related drugs: RAF, MEK, and MAPK inhibitors; or PIK3CA and pan-PI3K inhibitors; or FGFR kinase inhibitor and FGFR antibody-drug conjugate. Pairs of ‘chemotherapy and targeted therapy’ were drug pairs that contained at least one of the following chemotherapies: dacarbazine, paclitaxel, gemcitabine, 5-FU, plus any other targeted agent. Full code with comments for all aspects of PDX trial analysis is provided (Data S1, PDX analysis code). We encourage readers to explore this information for themselves.
Application of Akaike Information Criterion to independent drug action
The model of independent drug action does not depend on the Akaike Information Criterion (AIC) for its validity, but AIC provides additional support from the perspective of statistical model selection. The evidential justification for independent drug action, in brief, is that clinically and experimentally observed levels of patient-to-patient variability in drug response and correlations in responsiveness between drugs provide a quantitatively sufficient explanation for clinically observed responses to a variety of combination therapies (Figure 1, Figure 4). To explain the same clinical trials data by a model of synergy requires first making the assumption that the drugs in a combination have nearly complete cross-resistance (as simulated in Figure 6E) in order to conclude that the benefit could not arise from independent action. That assumption is factually inconsistent with clinical observations for all of the combination therapies analyzed here with the exception of BRAF and MEK inhibitors for BRAF-mutant metastatic melanoma. Nevertheless, it is possible to construct models of drug synergy that are predicated on the hypothesis of complete cross-resistance between drugs, in order to evaluate their quality of agreement with observed Progression Free Survival (PFS) distributions. For this purpose we defined three models of synergy:
Synergy by extension of response duration. This model fits one parameter to each trial of a drug combination, whereby the PFS curve of monotherapy is horizontally re-scaled to fit the combination response. This describes a scenario where individual patients have a proportionally longer duration of response to a combination versus monotherapy.
Synergy by increasing response rate. This model fits one parameter to each trial of a drug combination, which vertically re-scales the PFS curve, uniformly compressing the probability of progression at each time point. This describes a scenario where patients whose cancer does not respond to either individual drug has a chance of response to the combination of the two drugs.
Two-parameter synergy. This model utilizes both of the parameters described in models 1 and 2, that is, fitting the observed PFS curve by both horizontal and vertical re-scaling of the monotherapy PFS curve. This describes a scenario where combination therapies can both induce responses in a larger fraction of patients and confer more durable responses. This is not necessarily ‘stronger’ synergy than models 1 and 2, because strength of effect depends on parameter value, but modeling both mechanisms confers greater flexibility in fitting to observed PFS data.
These 3 models of synergy were fitted to observed PFS data, with different parameter choices permitted (indeed necessary) for each of the five following combination therapies:
Metastatic melanoma, nivolumab plus ipilimumab (Fig. 1)
Recurrent platinum-sensitive ovarian cancer, paclitaxel and carboplatin plus olaparib (Fig 4A)
HER2-positive metastatic breast cancer, chemotherapy and trastuzumab (Fig. 4B)
Advanced pancreatic cancer, gemcitabine plus erlotinib (Fig. 4C)
BRAF-mutant metastatic melanoma, dabrafenib plus trametinib (Fig. 4D).
Fits obtained under synergy models were compared with the predictions of independent drug action, which features a single parameter, response correlation, which was not fitted to data but was based on the experimentally measured level of response correlation in patient-derived tumor xenografts (PDXs) (Figure 2A) (Gao et al., 2015). The parameters in each synergy model were fitted to maximize the probability, according to the Kolmogorov-Smirnov (KS) goodness-of-fit test, that the data (clinically observed response distribution to combination therapy) was drawn from the distribution described by the model. The likelihood function for each model was the product of the optimal KS-test p-values across five clinical trials. The likelihood for the independent drug action model was also calculated by KS-test. These goodness-of-fit calculations showed that independent drug action has superior agreement to the data, even though it involves no parameter fitting (Table S2, higher log likelihood). The Akaike Information Criterion evaluated goodness-of-fit in the context of a penalty against spurious parameter fitting, and determined that the independent drug action model has many thousand-fold higher relative likelihood than any of the synergy models (Table S2).
The corrected AIC for finite sample sizes (AICc) could in principle be applied, recognizing that a clinical trial’s results can be summarized in a single data point, the hazard ratio. This framework was in practice inapplicable because it would produce an infinite AICc score for the synergy models, indicating that synergy models are useless, because they must invoke at least one parameter to explain each data point. In other words, irrespective of drug synergy being a valid biological phenomenon, it has no predictive accuracy as a statistical model because different pairs of drugs can have different strengths of synergistic interaction.
Predicting combination effects from PDX trials
For each of the six tumor types in Gao et al, all possible pairs of the monotherapies tested in that tumor type were examined in hypothetical combination. The survival function for each combination was calculated by assigning each PDX the longer of the two observed PFS times for treatment of that particular PDX by the constituent monotherapies. For each hypothetical combination, the hazard ratio was calculated (according to the Cox proportional hazards model) in comparison to the best observed monotherapy for that tumor type. The best predicted combination for each tumor type (Figure 2B, 5B) was selected according to longest average PFS. Full code for all aspects of PDX trial analysis is provided (Data S1).
First-principles model of heterogeneity in therapeutic sensitivity
Note that this model is not part of the analysis of human clinical trials (Figures 1, 4) or PDX trials (Figures 2, 3, 5), and is relevant only to Figure 6. To study drug response in silico, we modelled tumor kinetics according to Steel (1967) as involving both cell division and cell loss (e.g. from apoptosis): ϕ = 1 − TDpot/TD, where TD is the observed macroscopic tumor doubling time, TDpot is a potential tumor doubling time estimated from in vivo cell proliferation rates, and ϕ is the cell loss factor (as a fraction of cell production) that reconciles the comparatively fast TDpot and slow TD (note that ϕ=100% in tissues with no net growth). This model has the advantage of simplicity, historical precedent and grounding in data from humans and animals (Steel, 1967; Tubiana, 1989) (see comprehensive list of studies and data sources in Data S1, Figure 6 code). The Steel equation is also at the core of most mathematical descriptions of tumor growth and response to therapy (e.g. the Coldman-Goldie model and Bozic et al. (2013)); it models changes in the number of tumor cells (N) as: where g = ln2/TDpot is the cell growth rate. In the current study, growth rates g for each tumor were sampled from a normal distribution (mean 0.069 day−1, standard deviation 0.021 day−1) producing a median cell doubling time of 10 days with ϕ taken as 80% (ϕ typically ranges from 70% to 97% in human carcinomas (Tubiana, 1989); see comprehensive list of studies in Data S1, Figure 6 code). This yields a median tumor volume doubling time of 50 days and a range of 36 to 82 days (10% to 90% quantiles), values chosen for consistency with data on human solid tumors, for which median volume doubling times range approximately from 40 to 100 days depending on tumor type (Steel, 1967; Tubiana, 1989). Figures S7A and S7B show that results are robust to parameter variation and to alternative model structures, specifically modeling growth according to Gompertz kinetics, and modeling cytotoxic therapies administered in cycles.
The effect of a drug I (at concentration [I]) that inhibits tumor growth is modeled as: , where KI describes drug sensitivity. Drug treatment thereby reduces net growth rate, and when drug sensitivity is high causes a ‘log-kill’ effect (exponential decay in population size of drug-sensitive tumor cells during drug treatment). Patient-to-patient variability in drug sensitivity, KI, is introduced by drawing KI from a log-normal distribution with a standard deviation of half-decade (inferred from human clinical trials; Figure S1). Note that in this equation KI takes the form of a binding affinity, but this is not to propose that variation in binding affinity explains variation in drug response; it is a convenient device to reproduce the observed phenomenon of variation in response. Note also that because [I] and KI have dimensions of concentration, [I]/KI is a dimensionless ratio, and therefore the specific units of [I] and KI are not relevant. With the KI distribution centered on 1 (Figure 6B), [I] was taken to equal 0.2 in order to produce approximately equal fractions of patients displaying tumor shrinkage or continued tumor growth when evaluated at 8 weeks (Figure 6C). The effects of higher or lower [I] can be explored using the source code (Data S1). In Figure 6G, the relative activity of the second drug was varied by adjusting its concentration [I] between 0.0 and 0.2. Figure 6 presents simulations of continuous drug treatment, but results held also for simulations of cyclical dosing and were also reproduced in a model of Gompertzian growth dynamics as employed by the Norton-Simon hypothesis (Figure S7B).
Tumors receiving combination therapy were assigned two KI values, one for each drug, drawn either from two independent distributions or from a joint distribution with a specified degree of correlation (correlation in drug response is an important variable, as illustrated in Figure 6G). For each drug, resistant subclones were modeled by assigning a 10-fold higher KI to 500 cells per million (1 in 2,000) in the initial population, complemented in the case of combination therapy by 5 cells per million resistant to both drugs (thus, a 1% frequency of cross-resistance). These frequencies are based on observed rates of pre-existing resistance to erlotinib and crizotinib in a lung adenocarcinoma cell line (Bhang et al., 2015). When modeling the effect of variable degrees of positive correlation in response, the frequency of cross-resistance increased in proportion to response correlation (starting from at least 1% as experimentally reported (Bhang et al., 2015)). Thus, for example, at correlation = 0.1, cross resistance frequency was 10%, meaning 450 cells per million with resistance to drug A, 450 cells per million with resistance to drug B, and 50 cells per million with resistance to both drugs. Under combination therapy, each cell subpopulation is assumed to be inhibited only by the therapy to which it is most sensitive. In all cases, in silico tumors were considered to be progressing when the cell population doubled, corresponding to a 25% increase in tumor diameter, similar to RECIST criteria. In Figure 6G, hazard ratios were calculated by Cox proportional hazards model with censoring of patients still progression-free by 3 years. Population sizes in simulations were 200 patients per arm in Figure 6E, F, and 2500 patients per arm in each gridpoint in Figure 6G. Full code for these simulations is provided (Data S1).
DATA AND SOFTWARE AVAILABILITY
All analyses and data figures in the manuscript can be generated using source data and code provided in Data S1. Each piece of source code is provided as a Mathematica Notebook (.nb filetype) accompanied by all source data required by the code, and a PDF printout of the Mathematica Notebook containing all output illustrated in-line. The Mathematica Notebook can be executed in Wolfram Mathematica version 11 by selecting ‘Evaluate Notebook’ within the ‘Evaluation’ menu. Data S1 contains an index that lists the relation between each figure in the manuscript and each piece of source code.
Supplementary Material
Related to introduction and Figure 6.
A. Duration of progression free survival with trastuzumab monotherapy as first-line treatment of HER2AMP metastatic breast cancer is approximately log-normally distributed. Blue: Kaplan-Meier estimated time to progression in 79 patients FISH+ for HER2 gene amplification. Red: Fit to survival distribution by a log-normal distribution (on log10 scale, mean = 0.71 and standard deviation = 0.56).
B. Duration of progression free survival with vemurafenib as first-line treatment of unresectable stage IIIC or IV melanoma with BRAF V600E or V600K mutation is approximately log-normally distributed. Blue: Kaplan-Meier estimated time to progression in 352 patients. Red: Fit to survival distribution by a log-normal distribution (on log10 scale, mean = 0.82 and standard deviation = 0.40).
Source data and references are in Data S1.
For illustrative purposes, the procedure is here applied to a subset of 40 responses each to Ipilimumab, Nivolumab, and Ipilimumab plus Nivolumab in previously untreated melanoma (Larkin et al., 2015). Here responses are assigned randomly (no correlation in response), but in the first step the simulated patients’ responses can instead be assigned with a positive correlation in response.
The same procedure applies to the simulation of progression free survival (Figure 1B, Figure 4), taking the longest duration of progression free survival out of two responses per patient.
A. Drug trials in Patient-Derived tumor Xenografts demonstrate strong tumor-to-tumor variability in optimal treatment. For each of the 6 tumor types in Gao et al. (2015) we determined the observed treatment that produced the best average progression free survival across all PDXs of that tumor type (Melanoma: LEE011 + binimetinib; Non-small-cell lung cancer: BKM120 + binimetinib combination; Pancreatic ductal adenocarcinoma: BKM120 + binimetinib combination; Colorectal carcinoma: BYL719 + binimetinib; Breast cancer: LEE011 + everolimus combination; Gastric cancer: BYL719 monotherapy). Next, for each PDX we determined if any treatment other than the ‘best overall’ for that tumor type produced an individually superior response. Each of 230 PDX tumors is represented in this plot with progression free survival (PFS) with the best overall therapy on the horizontal axis and the possible improvement in PFS with some other personalized therapy on the vertical axis. We find that for 51% of PDXs, personalized therapy can improve PFS by at least 4 weeks (gray horizontal line).
B. Treatment matrix of 230 PDX models from 6 tumor types, each tested by Gao et al. (2015) for responsiveness to multiple monotherapies (average of 13 per PDX) and combination therapies (average of 5 per PDX). Each dot indicates a particular PDX tested with a particular treatment (green, monotherapies; blue, combinations). A larger rendering with labels for each drug treatment and each PDX model is provided in Data S1 (PDX analysis code); the larger matrix also demonstrates 47 PDX models that have been excluded from analyses in this article because they were tested in very few therapies and are therefore unsuited for comparing multiple treatments in the same PDX.
Related to Figure 3.
A. Assuming independent drug action, random pairs of monotherapies produce a statistically significant improvement in response rate. In the PDX drug trials of Gao et al. (2015), response rates (frequency of stable disease, partial, or complete response) within a tumor type for monotherapy (light green) is inferior to response rate for combinations (blue) (Kolmogorov-Smirnov (KS) test, p<10−5, n=85 monotherapy treatments of a tumor-type; 33 combination treatments of a tumor-type). In each tumor type we selected random pairs of the tested monotherapies, and assumed independent drug action, such that each PDX responds to a hypothetical combination only if it responds to one of the constituent drugs. The response rate in random pairs of monotherapies was not significantly different from the observed response rate with combinations (KS test, p=0.39, n= 33 observed combination treatments; 3300 random pairs of monotherapies), but significantly superior to observed monotherapies (KS test, p<10−13). Historical data on animal-to-animal reproducibility in RECIST response was reported by Gao et al, being a table of how often the consensus response (PD = progressive disease, SD = stable disease, PR = partial response, CR = complete response) in a treatment model (a specific treatment of a specific PDX) was measured in replicate mice as a different response (see Gao et al Figure 2a). We used this data to create an error model for the effects of animal-to-animal variability, by replacing each observed response in monotherapy treatments of each PDX cohort with a response according to this table of probabilities. When each PDX’s response to a monotherapy is replaced with the best of two responses drawn from this error model (as when simulating the effects of random pairs of monotherapies), the resulting response rate (dark green) is not significantly different from the observed response to monotherapies (KS test, p=0.13, n=85 monotherapy treatments).
B. Only in melanoma PDXs were experimentally tested combination therapies superior to random pairs of monotherapies. Analyzing PDXs from all tumors types studied by Gao et al. (2015), combinations are trending toward superiority over randomly selected pairs of monotherapies under the assumption of independent drug action (hazard ratio of observed combinations vs random pairs of monotherapies 0.84; 95% C.I. 0.69 to 1.00; p=0.06; n=230). Analyzing individual tumor types, only in melanoma are combinations significantly superior (hazard ratio vs. random pairs of monotherapies 0.30; 95% C.I. 0.18 to 0.52; p<10−4; n=42); this is consistent with evidence of synergy in the drug combinations tested in melanoma (Figure S4D). Analyzing PDXs from all tumor types other than melanoma, there is no trend in favor of combinations (hazard ratio vs. random pairs of monotherapies 1.13; 95% C.I. 0.93 to 1.39; p=0.21; n=197).
C. The best achievable responses with monotherapies and with combinations are equivalent, except for synergy in melanomas. Figure 3C compared PFS produced by treating each PDX studied by Gao et al. (2015) with its (retrospectively chosen) optimal monotherapy or optimal combination therapy, and showed that they produced virtually identical benefits. A potential limitation of this data is that some drugs were only tested as monotherapies and never in a combination, and some drugs were only tested as part of a combination and never as a monotherapy. Top (all tumors): Here this analysis is repeated considering only those therapies that were tested both as a monotherapy and as a component of a combination on the same tumor type; this yields 42 monotherapy trials and 24 combination trials. Across all tumor types, optimally chosen combinations trend toward superiority over monotherapies (hazard ratio 0.84; 95% C.I. 0.70 to 1.01; p=0.07; n=230). This trend is exclusively driven by melanoma where combinations were identified that strongly surpassed the effect of independent drug action (Figure S4D). Bottom (all tumors except melanoma): In all tumor types other than melanoma, optimally chosen combinations lack any superiority over optimally chosen monotherapies (hazard ratio 1.08; 95% C.I. 0.89 to 1.33; p=0.42; n=197).
D. Independent drug action provides a reference for the identification of synergy in survival data. Synergistic drug combinations are defined in cell culture studies by having effects greater than the sum of their parts (commonly according to Loewe’s isobologram analysis, Chou and Talalay, or Bliss (Berenbaum, 1989)). However, a definition of ‘sum of parts’ has not been apparent for clinical trial data (summing months of survival would be absurd). Here our model of independent drug action defines a ‘null-hypothesis’ of no interaction to identify drug combinations producing genuinely enhanced potency. Of 33 tests of drug combinations on panels of PDXs by Gao et al. (2015) (25 unique combinations of which some were tested on multiple tumor types), four were identified with a statistically significant reduction in hazard ratio relative to the prediction of independent action; and a further two combinations trending to improvement but without statistical significance (computed by Cox proportional hazards model; ns denotes not significant, p > 0.05; * denotes p ≤ 0.05; ** denotes p ≤ 0.005). In some cases a large benefit is entirely attributable to a synergistic effect (e.g. ribociclib plus binimetinib for melanoma), and in other cases the benefit of a combination may be partially due to synergy and partially due to the independent drug action in the context of heterogeneous responses across a population (e.g. alpelisib plus binimetinib for colorectal carcinoma).
Hazard ratios: For pancreatic ductal adenocarcinoma, buparlisib plus binimetinib produce hazard ratio (relative to independent drug action) 0.61 (95% confidence interval 0.37 to 1.00), p=0.05. For colorectal carcinoma, alpelisib plus binimetinib produce hazard ratio (relative to independent drug action) 0.80 (0.51 to 1.23), p = 0.3); and hazard ratio (relative to the best monotherapy, binimetinib) 0.59 (0.38 to 0.92), p=0.02. For melanoma, ribociclib plus encorafenib produce hazard ratio (relative to independent drug action) 0.46 (0.28 to 0.76), p = 0.003. Ribociclib plus binimetinib produce hazard ratio (relative to independent drug action) 0.47 (0.25 to 0.96), p=0.003. Buparlisib plus encorafenib produce hazard ratio (relative to independent drug action) 0.45 (0.26 to 0.77), p=0.004. In BRAF-V600 mutant melanoma, Encorafenib plus binimetinib produce hazard ratio (relative to independent drug action) 0.29 (0.12 to 0.72), p=0.007, and hazard ratio (relative to the best monotherapy, binimetinib) 0.22 (0.08 to 0.58), p=0.002. The benefit of encorafenib plus binimetinib is not statistically significant compared to monotherapy when evaluated in all melanoma PDXs.
Related to Figure 4.
A. In clinical trials of combination therapies consistent with independent drug action, progression free survival is best explained by partially correlated drug responses In Figure 1B and Figures 4A–G, progression free survival (PFS) predicted by independent drug action was plotted for response correlations in the range ρ = 0.28 ± 0.20. Here, simulations were conducted over the range 0 ≤ ρ ≤ 1, showing the median PFS predicted in each simulation. Each individual simulation is a gray dot, with a black line fitted to show the trend (using a linear plus sigmoidal response function). The clinically observed median PFS with the best monotherapy, and with the combination therapy, are shown for reference as dotted horizontal lines (monotherapy in green; combination in blue). Most combinations are best explained by partial positive correlations, except the combination of bevacizumab plus chemotherapy (two cases: ovarian and colorectal) and 5-fluorouracil plus oxaliplatin (pancreatic cancer) which cannot be explained by independent action even with fully uncorrelated responses. This is evidence of additivity or synergy.
B. In low-grade oligodendroglioma, radiation plus chemotherapy appears to have benefits surpassing independent action. As in Figure 4, survival distributions under combination treatment were simulated assuming drug independence by sampling observed monotherapy responses; in this case with ρ = 0.0 and 0.5, which gives the two black curves with the range in between in gray. This is speculative because of a lack of data on response correlation between radiation and chemotherapy, but the observed effect clearly surpasses the upper bound of simulation at ρ = 0, which is the greatest possible benefit that could attributed to independent action. Data are from a phase 3 trial of low-grade glioma treated with radiation with or without chemotherapy (PCV: procarbazine, lomustine/CCNU, vincristine), taking only data for grade 2 oligodendroglioma; and chemotherapy-only data from a study of large low-grade oligodendroglial tumors treated with PCV chemotherapy only (with intended goal of delaying radiation). It is possible that the chemotherapy-only trial’s selection of patients with large oligodendroglioma introduces bias for worse outcomes than for patients in the trial of radiation with or without chemotherapy, which may invalidate the use of this analysis in this specific case. Source data and references are in Data S1.
Related to Figure 5.
We used Gao et al’s reported data on animal-to-animal reproducibility in RECIST response criteria (see Figure 2a in Gao et al. (2015)) to derive an error model, by replacing each observed drug response with a response according to the observed probabilities that an individual animal’s response might differ from the consensus of replicates of that treatment model (meaning a test of a particular drug on a particular PDX) (see also Figure S5). For each monotherapy in these predicted combinations we conducted 105 iterations of replacing each PDX’s observed response with the best of two responses drawn from this error model, and then calculated the response rate (any response better than progressive disease) across the PDX cohort. Here we plot histograms of response rate according to the error model of animal-to-animal variability. Solid vertical lines show the experimentally observed response rate with each monotherapy (green or magenta) and the response rate predicted with independent drug action in combination (black). For all predictions the response rate (SD, PR or CR) with independent action has p < 0.05 to be explained by animal-to-animal variability. For pancreatic ductal adenocarcinoma, the predicted combination was significant at this evaluation of ‘any response’ (p = 0.006) but because binimetinib alone produces initially stable disease (SD) in nearly all PDX tumors, this is based on a small effect size and so we sought to make a more robust evaluation. We therefore repeated this analysis at a more stringent level of response (partial (PR) or complete (CR); thus not counting stable disease) and observed that the predicted benefit remained statistically significant: animal-to-animal variability has a 1% probability by this error model to explain the predicted superiority of combining binimetinib and gemcitabine compared to either monotherapy.
Related to Figure 6.
A. The benefit of independent drug action in a combination is robust to tumor kinetic parameters and the level of subclonal drug resistance.
Tumor kinetics: The benefit of independent drug action in a combination (blue) compared to monotherapy (green) holds over the range of tumor kinetic parameters relevant to human carcinomas, being cell loss factors between 50% and 95%, and tumor volume doubling times from 40 to 100 days (Steel, 1967; Tubiana, 1989); see Data S1 (Figure 6 model) for comprehensive list of references on tumor kinetics.
Drug resistant clones: The benefit of independent drug action is robust to variation in the strength of drug resistance (that is, the fold-change in drug sensitivity parameter KI in pre-existing resistant subclones), and the pre-treatment frequency of drug resistant subclones in a tumor. The benefit of independent drug action remains, but is slightly diminished, when there is strong sub-clonal cross-resistance between the two drugs. At 100% cross-resistance the pre-existing resistance is fully overlapping: all resistant subclones have 10× higher KI for drug 1 and 10× higher KI for drug 2. Resistance parameters used in main text (Figure 6) were 10× resistance, at 1/2000 initial frequency, with 1% cross-resistance, based on the experiments of Bhang et al. (2015).
B. Independent drug action is also beneficial in a model with Gompertz growth kinetics, and in a model of cytotoxic chemotherapy administered in cycles.
Model with Gompertz kinetics: The model presented in Figure 6 is here altered to describe tumor growth according to Gompertz kinetics (as used in the Norton-Simon hypothesis) in which the population’s growth rate is a decreasing function of population size: growth rate approaches zero as population size approaches a carrying capacity; and growth rate increases in the event of a drug response that decreases population size. Left panel and right panel correspond to figures 6D and 6E in the main text. In this model, Gompertzian growth dynamics have only marginal differences from exponential growth dynamics because we are simulating time to tumor volume doubling, and over this 2-fold range in population size there is little difference between exponential, logistic, Gompertzian, or even linear growth dynamics. Only in tumors with strong tumor shrinkage in response to drug is there a notable difference with Gompertzian dynamics, wherein the small drug-surviving population can regrow more rapidly. This does not alter the result that independent drug action by a combination therapy is sufficient to improve PFS.
Model of cycles of cytotoxic therapy: The model presented in Figure 6 described response to a continuously administered growth inhibiting there. Here the model is altered to instead describe a periodically administered cytotoxic therapy, with drug present for 3 days in every 30 days. Treatment with inhibitor at dose [I] changes growth from g to g×(1−[I]/KI), which is negative when [I]>KI, reflecting a cytotoxic effect. To produce similar duration of progression free survival as the model of growth-inhibiting therapy (Figure 6), the administered dose was higher ([I] = 1.5 instead of 0.2 as used in Figure 6 and the Gompertz model above). In both alternative models, independent drug action in a combination therapy remains sufficient to produce a substantial improvement in PFS.
C. Synergy and independent drug action can jointly contribute to improved survival duration.
Top panel: Independent drug action in a combination is weaker when responsiveness to the 2 drugs is highly correlated across a population (in effect, not very independent) (Figure 6F, G). However, a drug combination that displays this partially-independent action together with a sub-additive interaction (the two drugs together behave as one at 1.4× higher dose) produces a survival benefit (black) similar to a much stronger level of synergy (red).
Bottom panel: The benefits of independent drug action and synergy can in principle be combined in a three drug combination (two synergistic together, plus one independent) to produce yet greater survival benefits (black).
Acknowledgments
We thank M. Hafner, S. Goel, M. Cokol, S. Chopra, E. Sober, T. Mitchison and B. Chabner for discussions. This work was supported by NHMRC Early Career Fellowship (to A.C.P.) and NIH grant GM107618.
Footnotes
Author contributions: Analysis, A.C.P; writing, A.C.P. and P.K.S.
Publisher's Disclaimer: This is a PDF file of an unedited manuscript that has been accepted for publication. As a service to our customers we are providing this early version of the manuscript. The manuscript will undergo copyediting, typesetting, and review of the resulting proof before it is published in its final citable form. Please note that during the production process errors may be discovered which could affect the content, and all legal disclaimers that apply to the journal pertain.
References
- Aghajanian C, Blank SV, Goff BA, Judson PL, Teneriello MG, Husain A, Sovak MA, Yi J, Nycum LR. OCEANS: a randomized, double-blind, placebo-controlled phase III trial of chemotherapy with or without bevacizumab in patients with platinum-sensitive recurrent epithelial ovarian, primary peritoneal, or fallopian tube cancer. J Clin Oncol. 2012;30:2039–2045. doi: 10.1200/JCO.2012.42.0505. [DOI] [PMC free article] [PubMed] [Google Scholar]
- Berenbaum MC. What is synergy? Pharmacol Rev. 1989;41:93–141. [PubMed] [Google Scholar]
- Berge EM, Lu X, Maxson D, Baron AE, Gadgeel SM, Solomon BJ, Doebele RC, Varella-Garcia M, Camidge DR. Clinical benefit from pemetrexed before and after crizotinib exposure and from crizotinib before and after pemetrexed exposure in patients with anaplastic lymphoma kinase-positive non-small-cell lung cancer. Clin Lung Cancer. 2013;14:636–643. doi: 10.1016/j.cllc.2013.06.005. [DOI] [PMC free article] [PubMed] [Google Scholar]
- Bhang HE, Ruddy DA, Krishnamurthy Radhakrishna V, Caushi JX, Zhao R, Hims MM, Singh AP, Kao I, Rakiec D, Shaw P, et al. Studying clonal dynamics in response to cancer therapy using high-complexity barcoding. Nat Med. 2015;21:440–448. doi: 10.1038/nm.3841. [DOI] [PubMed] [Google Scholar]
- Bokemeyer C, Van Cutsem E, Rougier P, Ciardiello F, Heeger S, Schlichting M, Celik I, Kohne CH. Addition of cetuximab to chemotherapy as first-line treatment for KRAS wild-type metastatic colorectal cancer: pooled analysis of the CRYSTAL and OPUS randomised clinical trials. Eur J Cancer. 2012;48:1466–1475. doi: 10.1016/j.ejca.2012.02.057. [DOI] [PubMed] [Google Scholar]
- Bookman MA, Brady MF, McGuire WP, Harper PG, Alberts DS, Friedlander M, Colombo N, Fowler JM, Argenta PA, De Geest K, et al. Evaluation of new platinum-based treatment regimens in advanced-stage ovarian cancer: a Phase III Trial of the Gynecologic Cancer Intergroup. J Clin Oncol. 2009;27:1419–1425. doi: 10.1200/JCO.2008.19.1684. [DOI] [PMC free article] [PubMed] [Google Scholar]
- Bozic I, Reiter JG, Allen B, Antal T, Chatterjee K, Shah P, Moon YS, Yaqubie A, Kelly N, Le DT, et al. Evolutionary dynamics of cancer in response to targeted combination therapy. Elife. 2013;2:e00747. doi: 10.7554/eLife.00747. [DOI] [PMC free article] [PubMed] [Google Scholar]
- Brugarolas J, Clark JW, Chabner B. Using "rationally designed drugs" rationally. Lancet. 2003;361:1758–1759. doi: 10.1016/S0140-6736(03)13446-0. [DOI] [PubMed] [Google Scholar]
- Burger RA, Sill MW, Monk BJ, Greer BE, Sorosky JI. Phase II trial of bevacizumab in persistent or recurrent epithelial ovarian cancer or primary peritoneal cancer: a Gynecologic Oncology Group Study. J Clin Oncol. 2007;25:5165–5171. doi: 10.1200/JCO.2007.11.5345. [DOI] [PubMed] [Google Scholar]
- Cardoso F, Bedard PL, Winer EP, Pagani O, Senkus-Konefka E, Fallowfield LJ, Kyriakides S, Costa A, Cufer T, Albain KS, et al. International guidelines for management of metastatic breast cancer: combination vs sequential single-agent chemotherapy. J Natl Cancer Inst. 2009;101:1174–1181. doi: 10.1093/jnci/djp235. [DOI] [PMC free article] [PubMed] [Google Scholar]
- DeRose YS, Wang G, Lin YC, Bernard PS, Buys SS, Ebbert MT, Factor R, Matsen C, Milash BA, Nelson E, et al. Tumor grafts derived from women with breast cancer authentically reflect tumor pathology, growth, metastasis and disease outcomes. Nat Med. 2011;17:1514–1520. doi: 10.1038/nm.2454. [DOI] [PMC free article] [PubMed] [Google Scholar]
- Ducreux M, Mitry E, Ould-Kaci M, Boige V, Seitz JF, Bugat R, Breau JL, Bouche O, Etienne PL, Tigaud JM, et al. Randomized phase II study evaluating oxaliplatin alone, oxaliplatin combined with infusional 5-FU, and infusional 5-FU alone in advanced pancreatic carcinoma patients. Ann Oncol. 2004;15:467–473. doi: 10.1093/annonc/mdh098. [DOI] [PubMed] [Google Scholar]
- Eder JP, Hait WN, Frei E, 3rd, Grochow LB. Principles of Dose, Schedule, and Combination Chemotherapy. In: Hong WK, editor. Holland Frei Cancer Medicine 8. People’s Medical Pub. House; 2010. [Google Scholar]
- Fisher RI, Gaynor ER, Dahlberg S, Oken MM, Grogan TM, Mize EM, Glick JH, Coltman CA, Jr, Miller TP. Comparison of a standard regimen (CHOP) with three intensive chemotherapy regimens for advanced non-Hodgkin’s lymphoma. N Engl J Med. 1993;328:1002–1006. doi: 10.1056/NEJM199304083281404. [DOI] [PubMed] [Google Scholar]
- Frei E., 3rd Curative cancer chemotherapy. Cancer Res. 1985;45:6523–6537. [PubMed] [Google Scholar]
- Frei E, 3rd, Freireich EJ, Cehan E, Pinkel D, Holland JF, Selawry O, Haurani F, Spurr CL, Hayes DM, James GW, 3rd, et al. Studies of Sequential and Combination Antimetabolite Therapy in Acute Leukemia: 6-Mercaptopurine and Methotrexate. Blood. 1961;18:431–454. [Google Scholar]
- Frei E, 3rd, Karon M, Levin RH, Freireich EJ, Taylor RJ, Hananian J, Selawry O, Holland JF, Hoogstraten B, Wolman IJ, et al. The effectiveness of combinations of antileukemic agents in inducing and maintaining remission in children with acute leukemia. Blood. 1965;26:642–656. [PubMed] [Google Scholar]
- Freireich EJ, Gehan E, Frei E, 3rd, Schroeder LR, Wolman IJ, Anbari R, Burgert EO, Mills SD, Pinkel D, Selawry OS, et al. The Effect of 6-Mercaptopurine on the Duration of Steroid-induced Remissions in Acute Leukemia: A Model for Evaluation of Other Potentially Useful Therapy. Blood. 1963;21:699–716. [Google Scholar]
- Fuentes G, Scaltriti M, Baselga J, Verma CS. Synergy between trastuzumab and pertuzumab for human epidermal growth factor 2 (Her2) from colocalization: an in silico based mechanism. Breast Cancer Res. 2011;13:R54. doi: 10.1186/bcr2888. [DOI] [PMC free article] [PubMed] [Google Scholar]
- Gaddum JH. Pharmacology. 1. Oxford University Press; 1940. [Google Scholar]
- Gandhi L, Drappatz J, Ramaiya NH, Otterson GA. High-dose pemetrexed in combination with high-dose crizotinib for the treatment of refractory CNS metastases in ALK-rearranged non-small-cell lung cancer. J Thorac Oncol. 2013;8:e3–5. doi: 10.1097/JTO.0b013e3182762d20. [DOI] [PubMed] [Google Scholar]
- Gao H, Korn JM, Ferretti S, Monahan JE, Wang Y, Singh M, Zhang C, Schnell C, Yang G, Zhang Y, et al. High-throughput screening using patient-derived tumor xenografts to predict clinical trial drug response. Nat Med. 2015;21:1318–1325. doi: 10.1038/nm.3954. [DOI] [PubMed] [Google Scholar]
- Giantonio BJ, Catalano PJ, Meropol NJ, O’Dwyer PJ, Mitchell EP, Alberts SR, Schwartz MA, Benson AB, 3rd Eastern Cooperative Oncology Group Study E. Bevacizumab in combination with oxaliplatin, fluorouracil, and leucovorin (FOLFOX4) for previously treated metastatic colorectal cancer: results from the Eastern Cooperative Oncology Group Study E3200. J Clin Oncol. 2007;25:1539–1544. doi: 10.1200/JCO.2006.09.6305. [DOI] [PubMed] [Google Scholar]
- Goel S, Duda DG, Xu L, Munn LL, Boucher Y, Fukumura D, Jain RK. Normalization of the vasculature for treatment of cancer and other diseases. Physiol Rev. 2011;91:1071–1121. doi: 10.1152/physrev.00038.2010. [DOI] [PMC free article] [PubMed] [Google Scholar]
- Hafner M, Niepel M, Chung M, Sorger PK. Growth rate inhibition metrics correct for confounders in measuring sensitivity to cancer drugs. Nat Methods. 2016 doi: 10.1038/nmeth.3853. [DOI] [PMC free article] [PubMed] [Google Scholar]
- Hamid O, Robert C, Daud A, Hodi FS, Hwu WJ, Kefford R, Wolchok JD, Hersey P, Joseph RW, Weber JS, et al. Safety and tumor responses with lambrolizumab (anti-PD-1) in melanoma. N Engl J Med. 2013;369:134–144. doi: 10.1056/NEJMoa1305133. [DOI] [PMC free article] [PubMed] [Google Scholar]
- Hidalgo M, Amant F, Biankin AV, Budinska E, Byrne AT, Caldas C, Clarke RB, de Jong S, Jonkers J, Maelandsmo GM, et al. Patient-derived xenograft models: an emerging platform for translational cancer research. Cancer Discov. 2014;4:998–1013. doi: 10.1158/2159-8290.CD-14-0001. [DOI] [PMC free article] [PubMed] [Google Scholar]
- Jonas O, Landry HM, Fuller JE, Santini JT, Jr, Baselga J, Tepper RI, Cima MJ, Langer R. An implantable microdevice to perform high-throughput in vivo drug sensitivity testing in tumors. Sci Transl Med. 2015;7:284ra257. doi: 10.1126/scitranslmed.3010564. [DOI] [PMC free article] [PubMed] [Google Scholar]
- Karapetis CS, Khambata-Ford S, Jonker DJ, O’Callaghan CJ, Tu D, Tebbutt NC, Simes RJ, Chalchal H, Shapiro JD, Robitaille S, et al. K-ras mutations and benefit from cetuximab in advanced colorectal cancer. N Engl J Med. 2008;359:1757–1765. doi: 10.1056/NEJMoa0804385. [DOI] [PubMed] [Google Scholar]
- Kim KB, Kefford R, Pavlick AC, Infante JR, Ribas A, Sosman JA, Fecher LA, Millward M, McArthur GA, Hwu P, et al. Phase II study of the MEK1/MEK2 inhibitor Trametinib in patients with metastatic BRAF-mutant cutaneous melanoma previously treated with or without a BRAF inhibitor. J Clin Oncol. 2013;31:482–489. doi: 10.1200/JCO.2012.43.5966. [DOI] [PMC free article] [PubMed] [Google Scholar]
- Klinghoffer RA, Bahrami SB, Hatton BA, Frazier JP, Moreno-Gonzalez A, Strand AD, Kerwin WS, Casalini JR, Thirstrup DJ, You S, et al. A technology platform to assess multiple cancer agents simultaneously within a patient’s tumor. Sci Transl Med. 2015;7:284ra258. doi: 10.1126/scitranslmed.aaa7489. [DOI] [PMC free article] [PubMed] [Google Scholar]
- Kummar S, Chen HX, Wright J, Holbeck S, Millin MD, Tomaszewski J, Zweibel J, Collins J, Doroshow JH. Utilizing targeted cancer therapeutic agents in combination: novel approaches and urgent requirements. Nat Rev Drug Discov. 2010;9:843–856. doi: 10.1038/nrd3216. [DOI] [PubMed] [Google Scholar]
- Larkin J, Chiarion-Sileni V, Gonzalez R, Grob JJ, Cowey CL, Lao CD, Schadendorf D, Dummer R, Smylie M, Rutkowski P, et al. Combined Nivolumab and Ipilimumab or Monotherapy in Untreated Melanoma. N Engl J Med. 2015;373:23–34. doi: 10.1056/NEJMoa1504030. [DOI] [PMC free article] [PubMed] [Google Scholar]
- Law LW. Effects of combinations of antileukemic agents on an acute lymphocytic leukemia of mice. Cancer Res. 1952;12:871–878. [PubMed] [Google Scholar]
- Liu JF, Barry WT, Birrer M, Lee JM, Buckanovich RJ, Fleming GF, Rimel B, Buss MK, Nattam S, Hurteau J, et al. Combination cediranib and olaparib versus olaparib alone for women with recurrent platinum-sensitive ovarian cancer: a randomised phase 2 study. Lancet Oncol. 2014;15:1207–1214. doi: 10.1016/S1470-2045(14)70391-2. [DOI] [PMC free article] [PubMed] [Google Scholar]
- Long GV, Stroyakovskiy D, Gogas H, Levchenko E, de Braud F, Larkin J, Garbe C, Jouary T, Hauschild A, Grob JJ, et al. Combined BRAF and MEK inhibition versus BRAF inhibition alone in melanoma. N Engl J Med. 2014;371:1877–1888. doi: 10.1056/NEJMoa1406037. [DOI] [PubMed] [Google Scholar]
- Malaney P, Nicosia SV, Dave V. One mouse, one patient paradigm: New avatars of personalized cancer therapy. Cancer Lett. 2014;344:1–12. doi: 10.1016/j.canlet.2013.10.010. [DOI] [PMC free article] [PubMed] [Google Scholar]
- Moore MJ, Goldstein D, Hamm J, Figer A, Hecht JR, Gallinger S, Au HJ, Murawa P, Walde D, Wolff RA, et al. Erlotinib plus gemcitabine compared with gemcitabine alone in patients with advanced pancreatic cancer: a phase III trial of the National Cancer Institute of Canada Clinical Trials Group. J Clin Oncol. 2007;25:1960–1966. doi: 10.1200/JCO.2006.07.9525. [DOI] [PubMed] [Google Scholar]
- Oza AM, Cibula D, Benzaquen AO, Poole C, Mathijssen RH, Sonke GS, Colombo N, Spacek J, Vuylsteke P, Hirte H, et al. Olaparib combined with chemotherapy for recurrent platinum-sensitive ovarian cancer: a randomised phase 2 trial. Lancet Oncol. 2015;16:87–97. doi: 10.1016/S1470-2045(14)71135-0. [DOI] [PubMed] [Google Scholar]
- Perez EA, Ballman KV, Mashadi-Hossein A, Tenner KS, Kachergus JM, Norton N, Necela BM, Carr JM, Ferree S, Perou CM, et al. Intrinsic Subtype and Therapeutic Response Among HER2-Positive Breast Tumors from the NCCTG (Alliance) N9831 Trial. J Natl Cancer Inst. 2017;109 doi: 10.1093/jnci/djw207. [DOI] [PMC free article] [PubMed] [Google Scholar]
- Polyzos A, Kosmas C, Tsavaris N, Markopoulos C, Kalahanis N, Papadopoulos O, Arnaouti T, Sfikakis PP. Doxorubicin plus Ifosfamide as Salvage Treatment for Patients with Advanced Breast Cancer Refractory to Epirubicin plus Cyclophosphamide. Clinical Drug Investigation. 2000;19:349–355. [Google Scholar]
- Pritchard JR, Bruno PM, Gilbert LA, Capron KL, Lauffenburger DA, Hemann MT. Defining principles of combination drug mechanisms of action. Proc Natl Acad Sci U S A. 2013;110:E170–179. doi: 10.1073/pnas.1210419110. [DOI] [PMC free article] [PubMed] [Google Scholar]
- Renouf DJ, Tang PA, Hedley D, Chen E, Kamel-Reid S, Tsao MS, Tran-Thanh D, Gill S, Dhani N, Au HJ, et al. A phase II study of erlotinib in gemcitabine refractory advanced pancreatic cancer. Eur J Cancer. 2014;50:1909–1915. doi: 10.1016/j.ejca.2014.04.008. [DOI] [PubMed] [Google Scholar]
- Shaw AT, Kim DW, Nakagawa K, Seto T, Crino L, Ahn MJ, De Pas T, Besse B, Solomon BJ, Blackhall F, et al. Crizotinib versus chemotherapy in advanced ALK-positive lung cancer. N Engl J Med. 2013;368:2385–2394. doi: 10.1056/NEJMoa1214886. [DOI] [PubMed] [Google Scholar]
- Slamon DJ, Leyland-Jones B, Shak S, Fuchs H, Paton V, Bajamonde A, Fleming T, Eiermann W, Wolter J, Pegram M, et al. Use of chemotherapy plus a monoclonal antibody against HER2 for metastatic breast cancer that overexpresses HER2. N Engl J Med. 2001;344:783–792. doi: 10.1056/NEJM200103153441101. [DOI] [PubMed] [Google Scholar]
- Sledge GW, Neuberg D, Bernardo P, Ingle JN, Martino S, Rowinsky EK, Wood WC. Phase III trial of doxorubicin, paclitaxel, and the combination of doxorubicin and paclitaxel as front-line chemotherapy for metastatic breast cancer: an intergroup trial (E1193) J Clin Oncol. 2003;21:588–592. doi: 10.1200/JCO.2003.08.013. [DOI] [PubMed] [Google Scholar]
- Steel GG. Cell loss as a factor in the growth rate of human tumours. Eur J Cancer. 1967;3:381–387. doi: 10.1016/0014-2964(67)90022-9. [DOI] [PubMed] [Google Scholar]
- Swain SM, Baselga J, Kim SB, Ro J, Semiglazov V, Campone M, Ciruelos E, Ferrero JM, Schneeweiss A, Heeson S, et al. Pertuzumab, trastuzumab, and docetaxel in HER2-positive metastatic breast cancer. N Engl J Med. 2015;372:724–734. doi: 10.1056/NEJMoa1413513. [DOI] [PMC free article] [PubMed] [Google Scholar]
- Tubiana M. Tumor cell proliferation kinetics and tumor growth rate. Acta Oncol. 1989;28:113–121. doi: 10.3109/02841868909111193. [DOI] [PubMed] [Google Scholar]
- Undevia SD, Gomez-Abuin G, Ratain MJ. Pharmacokinetic variability of anticancer agents. Nat Rev Cancer. 2005;5:447–458. doi: 10.1038/nrc1629. [DOI] [PubMed] [Google Scholar]
- Vogel CL, Cobleigh MA, Tripathy D, Gutheil JC, Harris LN, Fehrenbacher L, Slamon DJ, Murphy M, Novotny WF, Burchmore M, et al. Efficacy and safety of trastuzumab as a single agent in first-line treatment of HER2-overexpressing metastatic breast cancer. J Clin Oncol. 2002;20:719–726. doi: 10.1200/JCO.2002.20.3.719. [DOI] [PubMed] [Google Scholar]
Associated Data
This section collects any data citations, data availability statements, or supplementary materials included in this article.
Supplementary Materials
Related to introduction and Figure 6.
A. Duration of progression free survival with trastuzumab monotherapy as first-line treatment of HER2AMP metastatic breast cancer is approximately log-normally distributed. Blue: Kaplan-Meier estimated time to progression in 79 patients FISH+ for HER2 gene amplification. Red: Fit to survival distribution by a log-normal distribution (on log10 scale, mean = 0.71 and standard deviation = 0.56).
B. Duration of progression free survival with vemurafenib as first-line treatment of unresectable stage IIIC or IV melanoma with BRAF V600E or V600K mutation is approximately log-normally distributed. Blue: Kaplan-Meier estimated time to progression in 352 patients. Red: Fit to survival distribution by a log-normal distribution (on log10 scale, mean = 0.82 and standard deviation = 0.40).
Source data and references are in Data S1.
For illustrative purposes, the procedure is here applied to a subset of 40 responses each to Ipilimumab, Nivolumab, and Ipilimumab plus Nivolumab in previously untreated melanoma (Larkin et al., 2015). Here responses are assigned randomly (no correlation in response), but in the first step the simulated patients’ responses can instead be assigned with a positive correlation in response.
The same procedure applies to the simulation of progression free survival (Figure 1B, Figure 4), taking the longest duration of progression free survival out of two responses per patient.
A. Drug trials in Patient-Derived tumor Xenografts demonstrate strong tumor-to-tumor variability in optimal treatment. For each of the 6 tumor types in Gao et al. (2015) we determined the observed treatment that produced the best average progression free survival across all PDXs of that tumor type (Melanoma: LEE011 + binimetinib; Non-small-cell lung cancer: BKM120 + binimetinib combination; Pancreatic ductal adenocarcinoma: BKM120 + binimetinib combination; Colorectal carcinoma: BYL719 + binimetinib; Breast cancer: LEE011 + everolimus combination; Gastric cancer: BYL719 monotherapy). Next, for each PDX we determined if any treatment other than the ‘best overall’ for that tumor type produced an individually superior response. Each of 230 PDX tumors is represented in this plot with progression free survival (PFS) with the best overall therapy on the horizontal axis and the possible improvement in PFS with some other personalized therapy on the vertical axis. We find that for 51% of PDXs, personalized therapy can improve PFS by at least 4 weeks (gray horizontal line).
B. Treatment matrix of 230 PDX models from 6 tumor types, each tested by Gao et al. (2015) for responsiveness to multiple monotherapies (average of 13 per PDX) and combination therapies (average of 5 per PDX). Each dot indicates a particular PDX tested with a particular treatment (green, monotherapies; blue, combinations). A larger rendering with labels for each drug treatment and each PDX model is provided in Data S1 (PDX analysis code); the larger matrix also demonstrates 47 PDX models that have been excluded from analyses in this article because they were tested in very few therapies and are therefore unsuited for comparing multiple treatments in the same PDX.
Related to Figure 3.
A. Assuming independent drug action, random pairs of monotherapies produce a statistically significant improvement in response rate. In the PDX drug trials of Gao et al. (2015), response rates (frequency of stable disease, partial, or complete response) within a tumor type for monotherapy (light green) is inferior to response rate for combinations (blue) (Kolmogorov-Smirnov (KS) test, p<10−5, n=85 monotherapy treatments of a tumor-type; 33 combination treatments of a tumor-type). In each tumor type we selected random pairs of the tested monotherapies, and assumed independent drug action, such that each PDX responds to a hypothetical combination only if it responds to one of the constituent drugs. The response rate in random pairs of monotherapies was not significantly different from the observed response rate with combinations (KS test, p=0.39, n= 33 observed combination treatments; 3300 random pairs of monotherapies), but significantly superior to observed monotherapies (KS test, p<10−13). Historical data on animal-to-animal reproducibility in RECIST response was reported by Gao et al, being a table of how often the consensus response (PD = progressive disease, SD = stable disease, PR = partial response, CR = complete response) in a treatment model (a specific treatment of a specific PDX) was measured in replicate mice as a different response (see Gao et al Figure 2a). We used this data to create an error model for the effects of animal-to-animal variability, by replacing each observed response in monotherapy treatments of each PDX cohort with a response according to this table of probabilities. When each PDX’s response to a monotherapy is replaced with the best of two responses drawn from this error model (as when simulating the effects of random pairs of monotherapies), the resulting response rate (dark green) is not significantly different from the observed response to monotherapies (KS test, p=0.13, n=85 monotherapy treatments).
B. Only in melanoma PDXs were experimentally tested combination therapies superior to random pairs of monotherapies. Analyzing PDXs from all tumors types studied by Gao et al. (2015), combinations are trending toward superiority over randomly selected pairs of monotherapies under the assumption of independent drug action (hazard ratio of observed combinations vs random pairs of monotherapies 0.84; 95% C.I. 0.69 to 1.00; p=0.06; n=230). Analyzing individual tumor types, only in melanoma are combinations significantly superior (hazard ratio vs. random pairs of monotherapies 0.30; 95% C.I. 0.18 to 0.52; p<10−4; n=42); this is consistent with evidence of synergy in the drug combinations tested in melanoma (Figure S4D). Analyzing PDXs from all tumor types other than melanoma, there is no trend in favor of combinations (hazard ratio vs. random pairs of monotherapies 1.13; 95% C.I. 0.93 to 1.39; p=0.21; n=197).
C. The best achievable responses with monotherapies and with combinations are equivalent, except for synergy in melanomas. Figure 3C compared PFS produced by treating each PDX studied by Gao et al. (2015) with its (retrospectively chosen) optimal monotherapy or optimal combination therapy, and showed that they produced virtually identical benefits. A potential limitation of this data is that some drugs were only tested as monotherapies and never in a combination, and some drugs were only tested as part of a combination and never as a monotherapy. Top (all tumors): Here this analysis is repeated considering only those therapies that were tested both as a monotherapy and as a component of a combination on the same tumor type; this yields 42 monotherapy trials and 24 combination trials. Across all tumor types, optimally chosen combinations trend toward superiority over monotherapies (hazard ratio 0.84; 95% C.I. 0.70 to 1.01; p=0.07; n=230). This trend is exclusively driven by melanoma where combinations were identified that strongly surpassed the effect of independent drug action (Figure S4D). Bottom (all tumors except melanoma): In all tumor types other than melanoma, optimally chosen combinations lack any superiority over optimally chosen monotherapies (hazard ratio 1.08; 95% C.I. 0.89 to 1.33; p=0.42; n=197).
D. Independent drug action provides a reference for the identification of synergy in survival data. Synergistic drug combinations are defined in cell culture studies by having effects greater than the sum of their parts (commonly according to Loewe’s isobologram analysis, Chou and Talalay, or Bliss (Berenbaum, 1989)). However, a definition of ‘sum of parts’ has not been apparent for clinical trial data (summing months of survival would be absurd). Here our model of independent drug action defines a ‘null-hypothesis’ of no interaction to identify drug combinations producing genuinely enhanced potency. Of 33 tests of drug combinations on panels of PDXs by Gao et al. (2015) (25 unique combinations of which some were tested on multiple tumor types), four were identified with a statistically significant reduction in hazard ratio relative to the prediction of independent action; and a further two combinations trending to improvement but without statistical significance (computed by Cox proportional hazards model; ns denotes not significant, p > 0.05; * denotes p ≤ 0.05; ** denotes p ≤ 0.005). In some cases a large benefit is entirely attributable to a synergistic effect (e.g. ribociclib plus binimetinib for melanoma), and in other cases the benefit of a combination may be partially due to synergy and partially due to the independent drug action in the context of heterogeneous responses across a population (e.g. alpelisib plus binimetinib for colorectal carcinoma).
Hazard ratios: For pancreatic ductal adenocarcinoma, buparlisib plus binimetinib produce hazard ratio (relative to independent drug action) 0.61 (95% confidence interval 0.37 to 1.00), p=0.05. For colorectal carcinoma, alpelisib plus binimetinib produce hazard ratio (relative to independent drug action) 0.80 (0.51 to 1.23), p = 0.3); and hazard ratio (relative to the best monotherapy, binimetinib) 0.59 (0.38 to 0.92), p=0.02. For melanoma, ribociclib plus encorafenib produce hazard ratio (relative to independent drug action) 0.46 (0.28 to 0.76), p = 0.003. Ribociclib plus binimetinib produce hazard ratio (relative to independent drug action) 0.47 (0.25 to 0.96), p=0.003. Buparlisib plus encorafenib produce hazard ratio (relative to independent drug action) 0.45 (0.26 to 0.77), p=0.004. In BRAF-V600 mutant melanoma, Encorafenib plus binimetinib produce hazard ratio (relative to independent drug action) 0.29 (0.12 to 0.72), p=0.007, and hazard ratio (relative to the best monotherapy, binimetinib) 0.22 (0.08 to 0.58), p=0.002. The benefit of encorafenib plus binimetinib is not statistically significant compared to monotherapy when evaluated in all melanoma PDXs.
Related to Figure 4.
A. In clinical trials of combination therapies consistent with independent drug action, progression free survival is best explained by partially correlated drug responses In Figure 1B and Figures 4A–G, progression free survival (PFS) predicted by independent drug action was plotted for response correlations in the range ρ = 0.28 ± 0.20. Here, simulations were conducted over the range 0 ≤ ρ ≤ 1, showing the median PFS predicted in each simulation. Each individual simulation is a gray dot, with a black line fitted to show the trend (using a linear plus sigmoidal response function). The clinically observed median PFS with the best monotherapy, and with the combination therapy, are shown for reference as dotted horizontal lines (monotherapy in green; combination in blue). Most combinations are best explained by partial positive correlations, except the combination of bevacizumab plus chemotherapy (two cases: ovarian and colorectal) and 5-fluorouracil plus oxaliplatin (pancreatic cancer) which cannot be explained by independent action even with fully uncorrelated responses. This is evidence of additivity or synergy.
B. In low-grade oligodendroglioma, radiation plus chemotherapy appears to have benefits surpassing independent action. As in Figure 4, survival distributions under combination treatment were simulated assuming drug independence by sampling observed monotherapy responses; in this case with ρ = 0.0 and 0.5, which gives the two black curves with the range in between in gray. This is speculative because of a lack of data on response correlation between radiation and chemotherapy, but the observed effect clearly surpasses the upper bound of simulation at ρ = 0, which is the greatest possible benefit that could attributed to independent action. Data are from a phase 3 trial of low-grade glioma treated with radiation with or without chemotherapy (PCV: procarbazine, lomustine/CCNU, vincristine), taking only data for grade 2 oligodendroglioma; and chemotherapy-only data from a study of large low-grade oligodendroglial tumors treated with PCV chemotherapy only (with intended goal of delaying radiation). It is possible that the chemotherapy-only trial’s selection of patients with large oligodendroglioma introduces bias for worse outcomes than for patients in the trial of radiation with or without chemotherapy, which may invalidate the use of this analysis in this specific case. Source data and references are in Data S1.
Related to Figure 5.
We used Gao et al’s reported data on animal-to-animal reproducibility in RECIST response criteria (see Figure 2a in Gao et al. (2015)) to derive an error model, by replacing each observed drug response with a response according to the observed probabilities that an individual animal’s response might differ from the consensus of replicates of that treatment model (meaning a test of a particular drug on a particular PDX) (see also Figure S5). For each monotherapy in these predicted combinations we conducted 105 iterations of replacing each PDX’s observed response with the best of two responses drawn from this error model, and then calculated the response rate (any response better than progressive disease) across the PDX cohort. Here we plot histograms of response rate according to the error model of animal-to-animal variability. Solid vertical lines show the experimentally observed response rate with each monotherapy (green or magenta) and the response rate predicted with independent drug action in combination (black). For all predictions the response rate (SD, PR or CR) with independent action has p < 0.05 to be explained by animal-to-animal variability. For pancreatic ductal adenocarcinoma, the predicted combination was significant at this evaluation of ‘any response’ (p = 0.006) but because binimetinib alone produces initially stable disease (SD) in nearly all PDX tumors, this is based on a small effect size and so we sought to make a more robust evaluation. We therefore repeated this analysis at a more stringent level of response (partial (PR) or complete (CR); thus not counting stable disease) and observed that the predicted benefit remained statistically significant: animal-to-animal variability has a 1% probability by this error model to explain the predicted superiority of combining binimetinib and gemcitabine compared to either monotherapy.
Related to Figure 6.
A. The benefit of independent drug action in a combination is robust to tumor kinetic parameters and the level of subclonal drug resistance.
Tumor kinetics: The benefit of independent drug action in a combination (blue) compared to monotherapy (green) holds over the range of tumor kinetic parameters relevant to human carcinomas, being cell loss factors between 50% and 95%, and tumor volume doubling times from 40 to 100 days (Steel, 1967; Tubiana, 1989); see Data S1 (Figure 6 model) for comprehensive list of references on tumor kinetics.
Drug resistant clones: The benefit of independent drug action is robust to variation in the strength of drug resistance (that is, the fold-change in drug sensitivity parameter KI in pre-existing resistant subclones), and the pre-treatment frequency of drug resistant subclones in a tumor. The benefit of independent drug action remains, but is slightly diminished, when there is strong sub-clonal cross-resistance between the two drugs. At 100% cross-resistance the pre-existing resistance is fully overlapping: all resistant subclones have 10× higher KI for drug 1 and 10× higher KI for drug 2. Resistance parameters used in main text (Figure 6) were 10× resistance, at 1/2000 initial frequency, with 1% cross-resistance, based on the experiments of Bhang et al. (2015).
B. Independent drug action is also beneficial in a model with Gompertz growth kinetics, and in a model of cytotoxic chemotherapy administered in cycles.
Model with Gompertz kinetics: The model presented in Figure 6 is here altered to describe tumor growth according to Gompertz kinetics (as used in the Norton-Simon hypothesis) in which the population’s growth rate is a decreasing function of population size: growth rate approaches zero as population size approaches a carrying capacity; and growth rate increases in the event of a drug response that decreases population size. Left panel and right panel correspond to figures 6D and 6E in the main text. In this model, Gompertzian growth dynamics have only marginal differences from exponential growth dynamics because we are simulating time to tumor volume doubling, and over this 2-fold range in population size there is little difference between exponential, logistic, Gompertzian, or even linear growth dynamics. Only in tumors with strong tumor shrinkage in response to drug is there a notable difference with Gompertzian dynamics, wherein the small drug-surviving population can regrow more rapidly. This does not alter the result that independent drug action by a combination therapy is sufficient to improve PFS.
Model of cycles of cytotoxic therapy: The model presented in Figure 6 described response to a continuously administered growth inhibiting there. Here the model is altered to instead describe a periodically administered cytotoxic therapy, with drug present for 3 days in every 30 days. Treatment with inhibitor at dose [I] changes growth from g to g×(1−[I]/KI), which is negative when [I]>KI, reflecting a cytotoxic effect. To produce similar duration of progression free survival as the model of growth-inhibiting therapy (Figure 6), the administered dose was higher ([I] = 1.5 instead of 0.2 as used in Figure 6 and the Gompertz model above). In both alternative models, independent drug action in a combination therapy remains sufficient to produce a substantial improvement in PFS.
C. Synergy and independent drug action can jointly contribute to improved survival duration.
Top panel: Independent drug action in a combination is weaker when responsiveness to the 2 drugs is highly correlated across a population (in effect, not very independent) (Figure 6F, G). However, a drug combination that displays this partially-independent action together with a sub-additive interaction (the two drugs together behave as one at 1.4× higher dose) produces a survival benefit (black) similar to a much stronger level of synergy (red).
Bottom panel: The benefits of independent drug action and synergy can in principle be combined in a three drug combination (two synergistic together, plus one independent) to produce yet greater survival benefits (black).