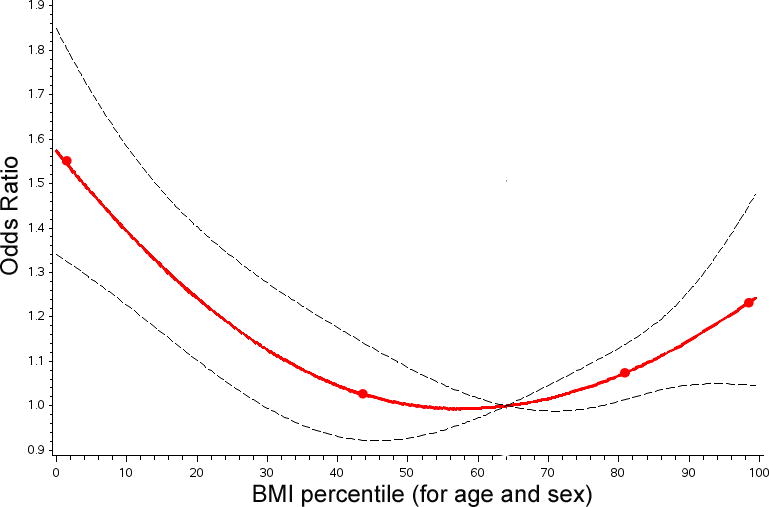
Figure 4. Linear spline model for composite outcome by BMI percentile.

The results of a multivariate model utilizing restricted cubic splines to measure the risk for a composite outcome are depicted. The line of best fit (red line), knots (red circles), and 95% confidence intervals (black hashed line) are shown. For composite outcome the nonlinear association depicted is statistically significant. The odds of a composite outcome are increased at either extreme of BMI. Above the inflection point (a BMI percentile of 57%), increasing BMI increases risk of composite outcome. Below that same inflection point decreasing BMI is also associated with increased risk of composite outcome. Compared to a patient with normal weight (BMI percentile of 64%), the odds of composite outcome are 1.53:1 for a severely underweight patient (BMI percentile of 5%) and 1.21:1 for an obese patient (BMI percentile of 95%).
