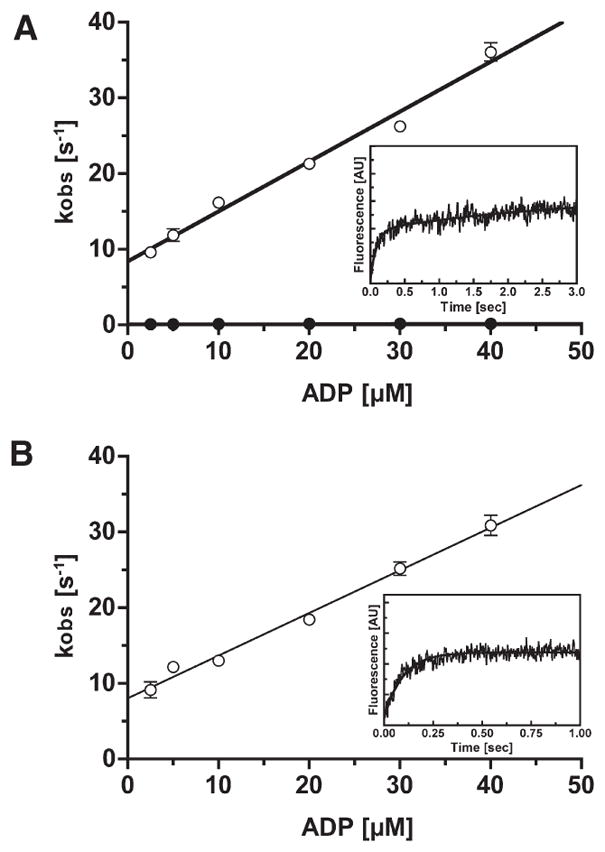
Figure 7.

dmant-ADP binding to p-huM3AMD and acto-P-huM3AMD. (A) Rate of binding of dmant-ADP to p-huM3AMD as a function of nucleotide concentration. The observed rates (kobs) were obtained by fitting the fluorescence transients to double exponentials. The apparent second-order rate constants for binding of dmant-ADP to p-huM3AMD are 0.87 μM−1 s−1 for the fast phase (○) and 0.002 μM−1 s−1 for the slow phase (●). The dissociation rates of dmant-ADP determined from the y-intercept of the fast phase and slow phase are 8.6 and 0.12 s−1, respectively. The inset shows a typical recording of the binding of dmant-ADP (5 μM) to 0.5 μM p-huM3AMD. The solid line is the best fit to double-exponential kinetics with a fast kobs of 11.13 s−1 and a slow kobs of 0.13 s−1. (B) Rate of binding of dmant-ADP to acto-p-huM3AMD as a function of nucleotide concentration. The observed rates (kobs) were obtained by fitting the fluorescence transients to a single exponential. The apparent second-order rate constant for binding of dmant-ADP to acto-p-huM3AMDis 0.56 μM−1 s−1. The dissociation rate of dmant-ADP determined from the y-intercept is 8.1 s−1. The error bars represent the standard error from three independent experiments. For several data points, the error bars are within the circles. The inset shows a typical recording of the binding of dmant-ADP (5 μM) to 0.5 μM acto-p-huM3AMD. The solid line is the best fit to single-exponential kinetics with a kobs of 10.41 s−1.
