Figure 8.

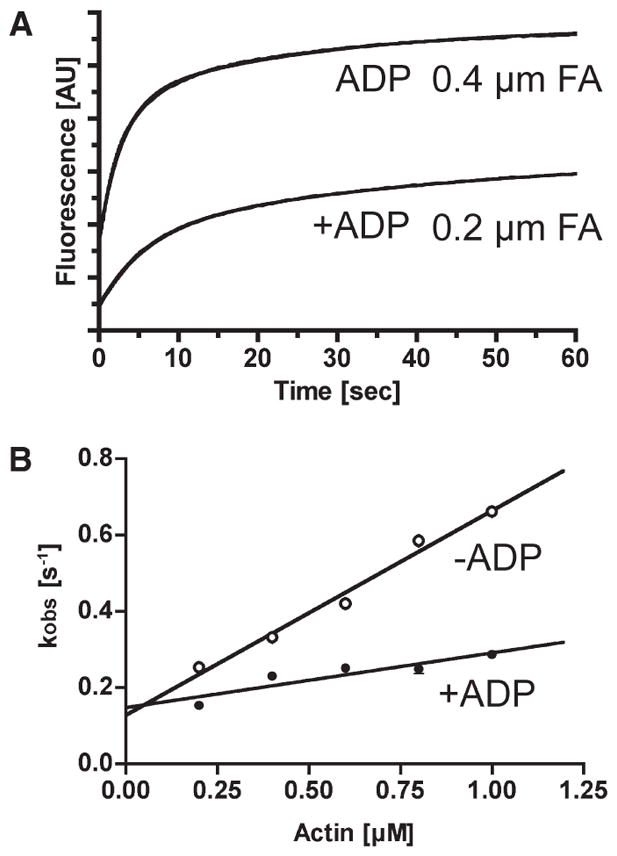
Actin binding to p-huM3AMD. (A) Typical recordings of light scattering of actin binding to 0.5 μM p-huM3AMD in the presence or absence of 0.1mMMgADP.The solid lines are the best fit to double-exponential kinetics with fast kobs values of 0.17 s−1 (0.2 μM actin with ADP) and 0.35 s−1 (0.4 μM actin without ADP). (B) The rate of binding of actin to p-huM3AMDas a function of actin concentration is shown in the presence (●) and absence (○) of 0.1mM MgADP. The fast phase (predominant) was linearly increased with actin concentration. The apparent second-order rate constant for p-huM3AMDis 0.54 μM−1 s−1, and the dissociation rate determined from the y-intercept is 0.13 s−1 in the absence of nucleotide (○). The apparent second-order rate constant for p-huM3AMD is 0.14 μM−1 s−1, and the dissociation rate determined from the y-intercept is 0.15 s−1 in the presence of nucleotide (●). The error bars represent the standard error from three independent experiments. For several data points, the error bars are within the circles.
