Abstract
Given the importance of the transcriptional regulator hypoxia‐inducible factor‐1 (HIF‐1) for adaptive hypoxia responses, we examined the effect of stabilized HIF‐1α on renal epithelial permeability and directed sodium transport. This study was motivated by histological analysis of cystic kidneys showing increased expression levels of HIF‐1α and HIF‐2α. We hypothesize that compression induced localized ischemia‐hypoxia of normal epithelia near a cyst leads to local stabilization of HIF‐1α, leading to altered transepithelial transport that encourages cyst expansion. We found that stabilized HIF‐1α alters both transcellular and paracellular transport through renal epithelial monolayers in a manner consistent with secretory behavior, indicating localized ischemia‐hypoxia may lead to altered salt and water transport through kidney epithelial monolayers. A quantity of 100 μmol/L Cobalt chloride (CoCl2) was used acutely to stabilize HIF‐1α in confluent cultures of mouse renal epithelia. We measured increased transepithelial permeability and decreased transepithelial resistance (TER) when HIF‐1α was stabilized. Most interestingly, we measured a change in the direction of sodium current, most likely corresponding to abnormal secretory function, supporting our positive‐feedback hypothesis.
Keywords: Cyst, electrophysiology, hypoxia, ischemia, kidney epithelia
Introduction
Kidney cysts are characterized by epithelial‐lined fluid filled sacs where the fluid is stagnant and loaded with cytokines (Calvet and Grantham 2001; Cowley et al. 2001; Grantham 2001; Zheng et al. 2003). By compressing neighboring tissue, cyst expansion may create localized ischemia‐hypoxia (Bernhardt et al. 2007; Belibi et al. 2011). Cyst expansion is associated with transepithelial fluid secretion, in contrast to the normal absorptive function (Sullivan et al. 1998). HIF‐1α has been shown to promote cyst expansion through calcium activated chloride secretion (Buchholz et al. 2013). In order for kidney cysts to expand, both active (transcellular) ion transport as well as passive (paracellular) transport may be altered, possibly converting a normally absorptive epithelium to a pathological secretory epithelium. It has been shown that cultured normal kidney cells (MDCK and primary cultures of human cortical cells) can be induced to form microcysts via the cAMP pathway ((Mangoo‐Karim et al. 1989) and reviewed in (Sullivan et al. 1998)). Importantly, those studies demonstrated that abnormalities in either PKD1 or PKD2 genes are not required to either induce cyst formation or fluid secretion by renal epithelial cells: the genetics of kidney cyst disease are independent of altered epithelial transport.
We hypothesize that, within the context of cystic kidney disease (PKD), stabilized Hypoxia Inducible Factor (HIF) alters renal epithelial function and encourages cyst expansion through altered salt and water transport. Because the genetic defects underlying PKD do not directly alter epithelial transport, we base our hypothesis on histological analysis of cystic kidneys showing increased levels of HIF‐1α, HIF‐2α, and increased serum level of Erythropoietin (EPO) (Chandra et al. 1985; Zeier et al. 1996; Bernhardt et al. 2007; Belibi et al. 2011). In response to hypoxic conditions, HIF‐1α is stabilized and translocates to the nucleus, resulting in the elevation of several effector molecules, such as EPO and vascular endothelial growth factor (VEGF) (Wang and Semenza 1993; Semenza 1999). In the presence of normoxia, HIF‐1α undergoes hydroxylation by prolyl hydroxylase and hydroxylated HIF‐1α undergoes proteasomal degradation (Ivan et al. 2001). CoCl2 is well known for its ability to stabilize hypoxia inducible factor 1α (HIF‐1α) (Kaelin 2002; Yuan et al. 2003). CoCl2 was shown to stabilize HIF‐1α by preventing hydroxylation of HIF‐1α (Wang and Semenza 1993; Yuan et al. 2003).
Prior reports have demonstrated changes to transepithelial sodium transport due to fluid flow (Sullivan et al. 1998; Resnick and Hopfer 2007), so we also wished to determine if flow‐driven transport alterations somehow interact (positively or negatively) with transport changes caused by stabilized HIF. The rationale for this measurement is provided by the fluid flow alteration within and in the vicinity of a cyst: flow is slowed or even stopped. Increased imbibition of water is becoming recognized as a viable treatment for PKD (Wang et al. 2013), and while attention has focused on the dilution of the antidiuretic hormone arginine vasopressin (AVP), increased water intake also results in higher tubular flow rates, supporting our hypothesis that fluid flow can impact PKD disease progression.
Our experimental system consisted of a cultured kidney epithelial cell line originally microdissected from the cortical collecting duct (mCCD) of an Immortomouse®, chosen because of the particularly simple salt and water transport system. The kidney collecting duct is known to “fine tune” salt and water balance in the body, contributing 0.5% the final salt resorption (Fauci 2008; Resnick 2011). In the collecting duct epithelium, sodium ions enter cells through epithelial sodium channels (ENaC) localized to the apical membrane and exit the basolateral side via the transporter protein sodium‐potassium‐ATPase (Na+K+ATPase) (Garty and Palmer 1997; Fauci 2008). Apical and basolateral K+ channels act to clear K+ build up within the cells (Garty and Palmer 1997; Fauci 2008). Net movement of positive Na+ ions from urine to blood creates an ionic gradient, driving paracellular transport of negatively charged ions, principally Cl−, in the same direction(Garty and Palmer 1997; Sullivan et al. 1998; Fauci 2008).
Using confluent monolayers of differentiated mouse kidney epithelia, we experimentally stabilized HIF by addition of CoCl2 and measured causal changes in transepithelial transport of sodium and water. We then compared HIF‐stabilized altered transepithelial sodium transport in the presence or absence of flow. Here, we report that applying CoCl2 at a concentration commonly used for HIF stabilization results in altered transcellular and paracellular transport of salt and water in otherwise normal renal epithelial cells. We also report that application of fluid flow blunts the alteration of salt and water transport caused by stabilized HIF.
Because directed transport of salt and water occurs simultaneously through both paracellular and transcellular paths, single electrophysiological measurements of transepithelial currents are unable to distinguish between the two paths. Thus, we performed two measurements, one of the transepithelial permeability using FITC‐labeled Dextran molecules (3 kDa and 70 kDa molecular weights) as paracellular tracers, and one of the transepithelial amiloride‐sensitive sodium current. Two molecular weights of FITC‐Dextran were used because 3 kDa FITC‐dextran may also be transported via transcellular pathways due to increased fluid‐phase transcytosis (Matter and Balda 2003; Balda and Matter 2007). Because the paracellular pathway shows a much stronger size selectivity than transcytosis (Matter and Balda 2003), comparing changes of the two molecular weight FITC‐Dextran permeabilities allows us to distinguish between changes to paracellular transport and changes to transcellular transport.
In summary, to better understand the transport mechanisms for kidney cyst expansion, we performed a series of measurements on cultured renal epithelia to examine what changes in transepithelial salt and water transport may occur when HIF is stabilized and if these changes are fluid flow‐dependent.
Methods
Cell culture
Experiments were carried out on a mouse cell line obtained by microdissection from the cortical collecting duct (mCCD 1296 (d)) of a heterozygous offspring Immortomouse® carrying a transgene, temperature‐sensitive SV40 large T antigen under the control of an interferon‐γ response element (Jat et al. 1991). Cells were cultured on suspended membrane cell culture inserts. The mCCD cell line retains the major phenotypic characteristics observed in primary cortical collecting duct cultures including contact inhibition, tight junction formation, cell polarity, and directed transport of salt and water.
mCCD cells were grown to confluence under normoxia incubation conditions of 33°C, 5% CO2, during differentiation cells were incubated at 39°C, 5% CO2. The growth medium was prepared by combining the following media constituents (final concentrations): Dulbecco's Modified Eagle Medium (DMEM) w/o glucose and Ham's F12 (at a ratio of 1:1), 5 mg/mL transferrin, 5 mg/mL insulin, 10 mg/mL epithelial growth factor (EGF), 4 mg/mL dexamethasone, 15 mmol/L 4‐(2‐hydroxyethyl)‐ 1‐piperazineethanesulfonic acid (HEPES), 0.06 w/v% NaHCO3, 2 mmol/L L‐glutamine, 10 ng/mL mouse interferon‐γ, 50 μmol/L ascorbic acid 2‐ phosphate, 20 nmol/L selenium, 1 nmol/L 3,39,5‐triiodo‐L‐thyronine (T3), and 5% fetal bovine serum (FBS). Cells were first expanded on collagen coated 30 mm diameter suspended membrane cell culture inserts (Millipore PICM03050, area= 4.71 cm2), inside a 6‐well plate (Falcon# 35116). After a sufficient quantity of cells were obtained, cells were passaged (1:3 dilution) onto 12 mm diameter suspended membrane cell culture inserts (Millipore PICM 01250, area = 1.13 cm2), within a 24‐well plate (Falcon# 353047), grown to confluence and allowed to differentiate resulting in a ciliated monolayer of epithelial cells exhibiting directed salt and water transport. For differentiation, growth factors (insulin, EGF, and interferon‐γ) were omitted from the culture media and additionally, FBS was omitted from the apical media.
Figure 1 presents a schematic timeline of our experiments. Day 0 is defined as the starting point, when confluent monolayers were switched to differentiation conditions. Upon entering differentiation culture conditions, mCCD monolayers develop functional outputs over time. Directed sodium transport commences and a functional cilium emerges after approximately 5 days. mCCD monolayers are considered fully differentiated after 7–10 days, and remain viable for an additional 24 days. Throughout the experiment, the apical amount of medium was restricted (100 μL), so that the thin fluid layer could allow sufficient oxygen diffusion (Resnick 2011).
Figure 1.

Cell culture timeline.
Application of fluid flow
Fluid flow has been shown to alter electrophysiological properties of renal epithelia (Resnick 2011). Cultures exposed to fluid flow were placed on an orbital shaker (Resnick 2011). Fluid flow was generated by operating the orbital plate shaker (IKA MS3 digital) at 4.2 Hz.
Fluorescein isothiocyanate (FITC)‐Dextran Permeability Assay
Two molecular weight FITC‐Dextran molecules (3 kDa and 70 kDa), anionic, D 3305 and D 1823 (Molecular Probes, Life Technologies) in Hanks’ Balanced Salt Solution (HBSS), 1X (21‐023‐CM, Cellgro, Mediatech) were used to measure the transepithelial permeability. Molecular Probes specifies that the specific lots consist of 1 mole FITC per mole of Dextran (3 kDa, Lot# 1709577 and 1485224) and 7 moles FITC per mole Dextran (70 kDa, Lot # 1583589). For both molecular weights, the stock concentration (120 μmol/L) was serially diluted to eight different concentrations, ranging from 120 μmol/L to 120 × 10−8 μmol/L. To generate a fluorescence intensity/FITC concentration curve, four replicates of 100 μL solution at various concentrations were dispensed into a 96‐well plate and fluorescence values were measured using a fluorescence plate reader (Perker Elmer Life Sciences/Wallac Victor Multilabel Counter and Wallac 1420 Manager software) using 490 nm excitation and 530 nm emission. Calibration curves were later used to determine the FITC concentrations from the fluorescence intensity values during permeability experiments.
To perform FITC‐Dextran permeability measurements on our cultures, cell culture inserts were gently washed thrice with HBSS buffer to remove any media. Then, 100 μL of FITC‐dextran in HBSS buffer was added to the apical side and 1 mL of HBSS buffer was added to the basolateral side of the cell culture inserts. A quantity of 100 μL media samples were collected from the basolateral side every 10 min, for a total of 70 min, to measure the transport of FITC‐Dextran molecules from the apical to basolateral side. Each withdrawn sample was deposited into a 96 well plate, fluorescence intensity value measured, and the sample then added back to the basolateral side of the culture in order to maintain a constant fluid volume (see below). At the end of performing the transport experiment with 3 kDa FITC‐Dextran, the cell culture inserts were washed with HBSS three times and the transport of 70 kDa FITC ‐Dextran molecules was determined. For each experiment, the concentration of initial stock solutions of 3 kDa and 70 kDa FITC ‐Dextran molecules was determined from calibration graphs. Each sample replicate was individually plotted in order to calculate permeability values; the average permeability of 3‐5 replicates was calculated and presented here.
Relationship of permeability to FITC‐Dextran concentration
Because there are many published methods used to determine transepithelial permeability (Siflinger‐Birnboim et al. 1987; Artursson 1990; Abbott et al. 1997; Gaillard et al. 2001; Matter and Balda 2003; Balda and Matter 2007; Yuan and Rigor 2010), we briefly derive the relationship between time‐dependent changes in a tracer molecule (e.g., FITC‐Dextran) and the transepithelial permeability used in our measurement. We wish to emphasize that this derivation does not distinguish between transcellular and paracellular transport.
Beginning with the equation for mass flux of a tracer from the apical compartment through a semipermeable surface (area “A”) to the basolateral compartment (Fick's first law) (Fick 1855)
| (1) |
where “M bl” is the total mass of tracer particles in the basolateral side, “P” the permeability (units length/time), C(t)ap the time‐dependent concentration of tracer particle on the apical side and C(t)bl the time‐dependent concentration of tracer particle on the basolateral side.
Assuming that the apical and basolateral fluid volumes remain constant, dividing by the basolateral fluid volume V bl and using the conservation of mass M0 = C(t)ap V ap + C(t)bl V bl, we obtain:
| (2) |
Given the initial condition C bl(0) = 0, this equation has the solution:
| (3) |
where C0 is the initial tracer concentration C 0 = M 0/(V ap+V bl). For convenience we define the constant B = A(1/V bl + 1/V ap) and rearrange to solve for the permeability:
| (4) |
Thus, by measuring the basolateral concentration of FITC‐Dextran C(t)bl as a function of elapsed time “t”, we obtain the permeability “P” as the slope of a best‐fit line. We present our relevant parameter values here in table form: (Table 1).
Table 1.
Permeability calculation parameters
| Parameter | Value |
|---|---|
| Initial FITC‐Dextran concentration C0 | Variable |
| Area of semipermeable filter A | 1.13 cm2 |
| Volume of fluid in apical chamber Vap | 100 μL |
| Volume of fluid in basolateral chamber Vbl | 1 mL |
| “B” (see equation (4)) | 12.43 cm−1 |
Using this approach, the permeability of a cell‐free collagen coated cell culture insert was measured to be (1.21 ± 0.46) × 10−5 cm/sec (3 kDa) and (1.01 ± 0.40) × 10−6 cm/sec (70 kDa).
Measurement of Transepithelial resistance and voltage
Transepithelial voltage and resistance measurements were performed using Endohm chambers (ENDOHM‐24SNAP or ENDOHM‐12) from World Precision Instruments (WPI) connected to an EVOM2 epithelial voltohmmeter from WPI in voltage‐clamp short‐circuit mode. Short circuit equivalent current (I eq) was calculated from voltage and resistance read outs using Ohm's law, I = V/R. We report values of I eq relative to the control group. More than 95% of I eq was inhibited by 10 μmol/L apical amiloride and thus is considered to be proportional to the activity of ENaC in the apical plasma membrane. Before collecting electrophysiological read outs, 100 μL of apical differentiation media was gently added to cell culture inserts in addition to the 100 μL of apical differentiation media already present to ensure electrical contact between the upper electrodes and apical fluid.
Cobalt chloride treatment
Cobalt chloride (CoCl2) hexahydrate (S93179 from Fisher Scientific) was dissolved in 1X Phosphate Buffer Saline (PBS) buffer to make 100 mmol/L CoCl2 stock solution, which was further diluted in cell culture media to achieve the desired concentration of 100 μmol/L. Experiments were performed with CoCl2 added to apical differentiation media (APDM), basolateral differentiation media (BLDM), or to both APDM and BLDM.
Cell lysate preparation
Whole cell lysates were prepared using RIPA 1X cell lysis buffer. The 10X RIPA buffer from Cell Signaling Technology (Product no. 9806) was first diluted to prepare 1X buffer. The Halt Protease Inhibitor Cocktail from Thermo Scientific (Product no. 78430) was added at a final concentration of 1X. The RIPA buffer cell lysis protocol from Cell Signaling Technology was followed to prepare whole cell lysates. The EPO levels were compared in the whole cell lysates.
Nuclear extracts were prepared using NE‐PER Nuclear and Cytoplasmic Extraction Reagents from Thermo Scientific (Product no. 78833). The Halt Protease Inhibitor Cocktail was added to during the extraction as instructed by the manufacturer. The protocol from Thermo Scientific was followed to obtain nuclear extracts. The HIF1α levels were compared in the nuclear extracts.
The protein concentrations in each sample were determined using Bradford assay using Coomassie Plus Protein Assay Reagent from Thermo Scientific (Product No. 1856210). In each well of the gel same amount (μg) of proteins were loaded. Before loading the samples in the wells of the polyacrylamide gels, sample buffer was added and samples were heated for 6 min at 95°C.
Western blot
SDS‐PAGE: 12% acrylamide‐bisacrylamide gels and 4% stacking gels were used. The following antibody concentrations were used: mouse monoclonal β‐actin (Novus Biologicals# NB600‐501) at a concentration of 1:10,000, mouse monoclonal HIF1α (Santa Cruz # sc‐13515) at a concentration of 1:200, mouse monoclonal EPO (Santa Cruz Biotechnology# sc80995) at a concentration of 1:200, mouse monoclonal GAPDH (Santa Cruz Biotechnology# sc‐166545) at a concentration of 1: 1000, rat monoclonal zonula occludin 1 (ZO‐1) (Developmental Studies Hybridoma Bank at University of Iowa# R26.4C) at a concentration of 1:100, mouse monoclonal sodium‐potassium ATPase (NaKATPase) α1 subunit (Developmental Studies Hybridoma Bank at University of Iowa# a6F at a concentration of 1:600. Secondary HRP conjugated anti mouse antibody was used at a concentration of 1:2000. To compare β‐actin levels in the membrane which were first analyzed for EPO levels, a stripping buffer, Restore Plus Western Blot Stripping Buffer from Thermo scientific (product no. 46430) was used. Antibodies were stripped from the membrane for 10 min, followed by washing with TBST and the membrane was blocked again before addition of primary antibody, that is, monoclonal beta actin antibody. LI‐COR Image Studio™ Software was used to perform densitometric analysis of western blot results.
MTT cell viability assay
Cell Titer 96 Non‐Radioactive Cell Proliferation Assay (MTT), G4000 (Promega) was used to determine if cell viability was altered by the addition of CoCl2. Sample absorbance values were measured at 570 nm using an absorbance plate reader (Perker Elmer Life Sciences/Wallac Victor Multilabel Counter and Wallac 1420 Manager Software). Using trypan blue dye and a hemocytometer, cell enumeration was performed and a calibration graph was generated from cell seeding densities and absorbance values.
Statistical analysis
Using Microsoft Excel, a type three (two‐sample unequal variance, heteroscedastic) and a two‐tailed Student's t‐test was performed between the groups to determine the level of any significance difference. IBM‐SPSS software was used to perform One‐way ANOVA with post hoc Tukey to make comparisons among more than two groups. Standard errors were calculated from standard deviation values and are shown in the graphs.
Results
Application of 100 μmol/L CoCl2 increases HIF1α levels
We performed western blots to demonstrate that addition of 100 μmol/L CoCl2 to our culture media significantly increased nuclear HIF‐1α and slightly increased HIF‐1α effector molecule erythropoietin (EPO) in the whole cell extracts. The findings are in agreement with prior reports (Fisher and Langston 1967; Fandrey et al. 1997; Verghese et al. 2011). Stabilization of HIF1α resulted in significant decrease in the levels of ZO‐1 and NakATPase, α1 subunit. Western blots and densitometric analysis are shown in Figure 2.
Figure 2.
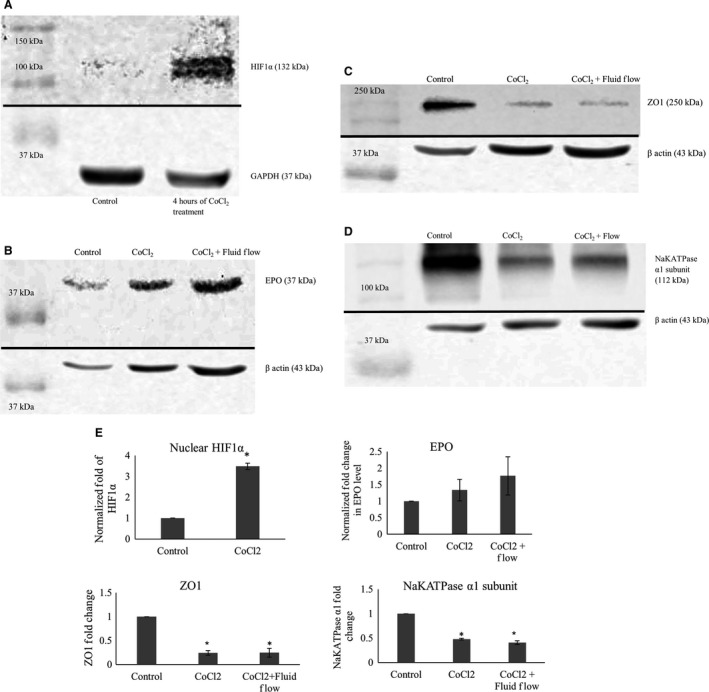
(A) shows western blots of nuclear extracts of mCCD cells treated with 100 μmol/L CoCl2. Treatment with CoCl2 increased stabilization of HIF1α in the nucleus of the cells. GAPDH levels are shown as loading controls. (B) shows western blots of whole cell extracts of mCCD cells treated with 100 μmol/L CoCl2 for 4 h. As shown in the images, treatment with CoCl2 increased the EPO production by cells. Beta actin levels are shown as loading controls. (C) shows western blots of whole cell extracts of mCCD cells treated with 100 μmol/L CoCl2 for 4 h and chronic fluid flow. As shown in the images, treatments decreased ZO‐1 production by cells independently of fluid flow stimulation. Beta actin levels are shown as loading controls. (D) shows western blots of whole cell extracts of mCCD cells treated with 100 μmol/L CoCl2 for 4 h and chronic fluid flow. As shown in the images, treatments decreased NaKATPase production by cells independently of fluid flow stimulation. Beta actin levels are shown as loading controls. (E) Densitometric analysis of Western blots presented in (A–D). HIF1α level: P = 0.004 (N = 3), t‐test, showing significant nuclear stabilization of HIF1α. EPO level: increases slightly though not statistically significant (N = 3, P > 0.05, One‐way ANOVA). ZO‐1 level: P < 0.0001 (N = 4), One‐way ANOVA, showing significant decrease in ZO‐1 levels, independent of fluid flow. NaKATPase α1 subunit level: P = 0.001 (N = 3), One‐way ANOVA, showing significant decrease in NaKATPase α1 subunit levels, largely independent of fluid flow.
Effect of Cobalt Chloride on cell viability
The MTT (MTT 3‐(4,5‐dimethylthiazol‐2‐yl)‐2,5‐diphenyltetrazolium bromide) assay is a colorimetric assay for assessing cell metabolic activity and reflects the number of viable cells present (Meerloo et al. 2011). Growing cells, being more active, have higher mitochondrial dehydrogenase activity and show higher MTT absorbance values.
As shown in Figure 3, MTT absorbance values showed that there were no significant differences between control and CoCl2 treatment groups either in the presence or absence of fluid flow, indicating that addition of 100 μmol/L CoCl2 to our culture media did not affect cellular viability.
Figure 3.
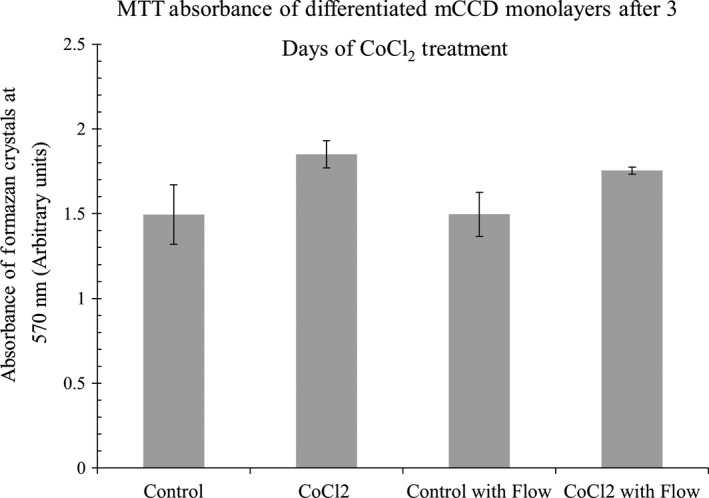
Shows that MTT absorbance values do not significantly change with addition of CoCl2, indicating cell viability is unchanged due to 3 days of treatment, either in the presence or absence of fluid flow. N = 4–5. One Way ANOVA, non‐significant, P > 0.05.
Transepithelial Permeability
As mCCD epithelial cells differentiate, they form tight junctions and tissue‐level gain‐of‐function properties such as directed transport of salt and water begin to emerge. Figure 4A presents transepithelial permeability data of mCCD monolayers during this differentiation process. As expected, permeability at day 1 was significantly higher as compared to fully differentiated mCCD monolayers after 10 days of differentiation. This measurement provides some evidence that the principal diffusion path for 3 kDa FITC‐Dextran in mCCD cells may be via paracellular route, as tight junctions form early in the differentiation process. In contrast, the permeability of 70 kDa FITC‐Dextran showed no changes during differentiation (Fig. 4B). During later phase of differentiation 3 kDa and 70 kDa permeability values were stable.
Figure 4.
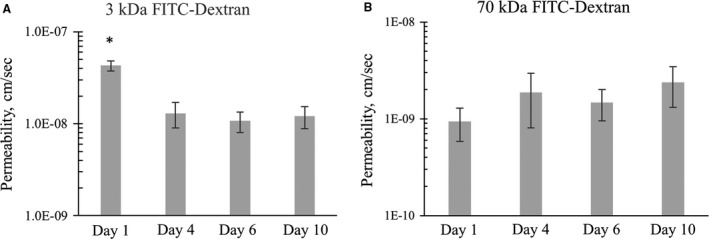
(A) Shows that 3 kDa FITC dextran transepithelial permeability at the onset of differentiation (day 1) is significantly higher as compared to fully differentiated mCCD monolayers (day 10). N = 3–6. One‐way ANOVA P < 0.002. (B) shows that the permeability of 70 kDa FITC‐dextran does not change significantly during differentiation. N = 3–6, One‐way ANOVA P > 0.05.
Once fully differentiated, mCCD monolayers showed 3 kDa FITC‐Dextran permeability of (1.9 ± 1.5) × 10−8 cm/s and 70 kDa FITC‐Dextran permeability of (2.2 ± 1.9) × 10−9 cm/sec (Fig. 5). Both of these are significantly reduced as compared to the cell‐free insert, demonstrating the efficacy of tight junctions in regulating transcellular transport.
Figure 5.
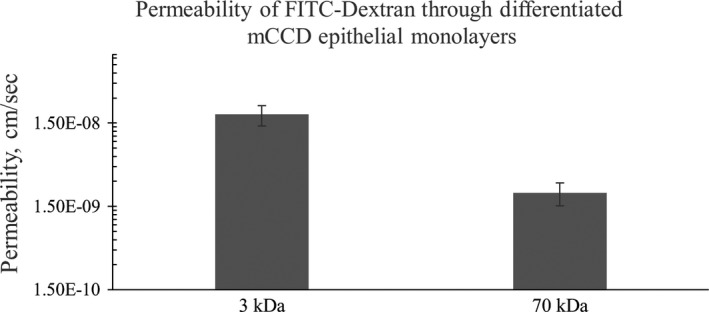
Shows the transepithelial permeability of fully differentiated mCCD monolayers. N = 8. T‐test: P value < 0.02.
CoCl2 increases monolayer permeability:
We investigated the effect of CoCl2 in altering monolayer permeability. Addition of 100 μmol/L CoCl2 to fully differentiated monolayers for 48 h increased 3 kDa FITC‐Dextran permeability to (4.02 ± 3.15) × 10−7 cm/s and addition of 100 μmol/L CoCl2 for 72 h increased the permeability further to (9.05 ± 8.13) × 10−7 cm/s (Fig. 6A). Similarly, the transepithelial permeability of 70 kDa FITC‐Dextran was (1.99 ± 2.13) × 10−8 cm/s at 48 h and (7.24 ± 6.47) ×10−8 cm/s at 72 h (Fig. 6B). That is, CoCl2 increased 3 kDa dextran‐fluorescein permeability more than 100‐fold and 70 kDa dextran‐fluorescein permeability nearly 40‐fold. In conclusion, CoCl2 was found to significantly increase the transepithelial permeability of FITC‐Dextran molecules through fully differentiated mCCD monolayers.
Figure 6.
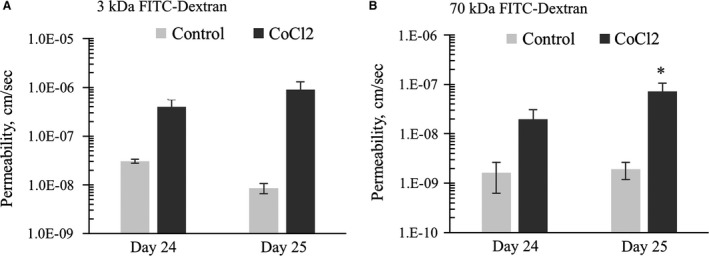
(A) CoCl2 added on day 22. Data shows that CoCl2 treatment for 48 h (Day 24) and 72 h (Day 25) increased the permeability of differentiated mCCD monolayers measured with 3 kDa FITC‐dextran. N = 4–5, One‐way ANOVA. CoCl2 treatment significantly (P value = 0.02) increases monolayer permeability on day 25. No other statistical significant difference was noticed among any other groups. (B) CoCl2 added on day 22. Data shows that CoCl2 treatment for 3 days increased the permeability of differentiated mCCD monolayers measured with 70 kDa FITC‐dextran. N = 4–5, One‐way ANOVA. CoCl2 treatment significantly (P value = 0.02) increases monolayer permeability on day 25. No other statistical significant difference was noticed among any other groups.
Transepithelial electrophysiology Results:
Transepithelial resistance
Due to tight junctions, an untreated confluent and fully differentiated mCCD monolayer has a transepithelial resistance (TER) value around 3 kΩ‐cm2. As shown in Figure 7A and B, extended application of CoCl2 results in a significant decrease in the TER value at day 2 and 3, consistent with the measured increase in transepithelial permeability. After 72 h with CoCl2 treatment, the TER of mCCD monolayers were found to decrease fourfold in the absence of fluid flow and threefold in the presence of fluid flow. Statistical analysis shows that the effect of HIF stabilization in decreasing monolayer resistance was enhanced when fluid flow was absent.
Figure 7.
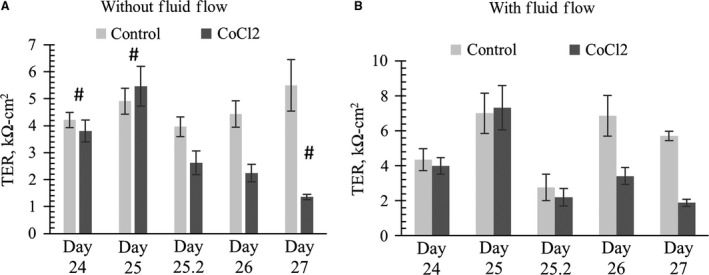
CoCl2 added to mCCD cultures on day 24 in the absence (A) or presence (B) of chronic steady flow. N = 4–16. Data shows that application of 100 μmol/L CoCl2 significantly decreased TER values of differentiated mCCD monolayers after 48 h (2 days) without fluid flow. One‐way ANOVA shows no significant (P > 0.05) TER changes among control groups in (A) or (B). ‘*’ denotes significant change (P < 0.05) between a control and CoCl2 treatment at a specific time‐point. ‘#’ denotes significant change (P < 0.05) between CoCl2‐treated sample at one time point with CoCl2‐treated or control sample at other time points. No statistical difference was found between CoCl2 treatment on day 26 and day 27 in (A). In figure (B) with fluid flow, at a specific time point, statistical significance (P > 0.05) was not detected between control and CoCl2. However, we noticed CoCl2 treatment group value was significantly decreased as compared to control value at a different time point (P < 0.05, denoted by #). TER on day 27 of CoCl2‐treated group was significantly decreased as compared to Day 26 control. Similarly, TER on day 26 of CoCl2‐treated group was significantly decreased as compared to Day 25 control.
Transepithelial Equivalent short‐circuit current I eq
Figure 8 shows that the effect of CoCl2 on I eq measurements was more prominent in the absence of fluid flow as compared to monolayers cultured in the presence of fluid flow. In response to CoCl2 treatment, significant decreases of I eq values were found after 30 h in the absence of flow (Fig. 8A). In response to CoCl2 treatment for 3 days in monolayer cultures not exposed to fluid flow, I eq values showed a significant change and, very significantly, a positive mean I eqvalue of 0.9 μA/cm2 was developed. Movement of positive sodium ions from the apical to basolateral side results in a negative I eq value. Thus, a positive I eq value implies that net ion transport may be moving in the opposite direction. It is tempting to interpret these results as confirmation of our hypothesis that increased levels of HIF can transform a normally absorptive epithelial monolayer into a secretory monolayer.
Figure 8.
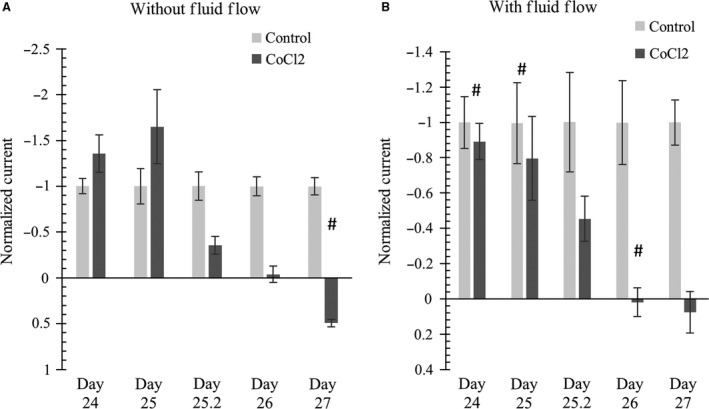
(left) without applied flow; (right) with applied flow. CoCl2 added on day 24. Data shows that application of 100 μmol/L CoCl2 significantly decreased I eq values of differentiated mCCD monolayers after 48 h (2 days). Interestingly, after 3 days of treatment, I eq value switched to the positive direction. Current values are plotted as relative to average I eq values as discussed in the main text. N = 4–16. One‐way ANOVA shows no significant (P > 0.05) I eq changes among control groups in (A) or (B). * denotes significant change (P < 0.05) between a control and CoCl2 treatment at a specific time‐point. # denotes CoCl2 treatment causes significant change (P < 0.05) between CoCl2‐treated sample at a specific time point with CoCl2‐treated or control sample at a different time point. In Figure (A) and (B), CoCl2 treatment shows gradual decrease in negative I eq; some of this gradual decrease was statistically significant (e.g., Figure (A) Day 25 CoCl2 vs. Day 26 CoCl2).
Comparison of normalized I eq values of mCCD monolayers cultured with chronic fluid flow showed that I eq values significantly decreased at day 2 in response to CoCl2 treatment as shown in Figure 8B. Control samples had a mean I eq value of −2.6 μA/cm2 , whereas CoCl2‐treated samples showed mean I eq values of 0.1 μA/cm2 (48 h) and 0.2 μA/cm2 (72 h).
Comparing Figures 8A and B, it should be noted that CoCl2 altered I eq values in the monolayers without fluid flow were significantly altered after 30 h, whereas in the monolayers cultured with fluid flow, significant changes occurred after 48 h. Therefore, it can possibly be inferred that the lack of fluid flow can intensify the effect of HIF stabilization.
CoCl2 Acts on Basolateral side
In our cell lines, the transporter responsible for couptake has not been clearly identified. In mammalian cells, the divalent metal cation transporters Slc11a1 and Sla11a2 may be responsible for couptake (Gunshin et al. 1997; Forbes and Gros 2003). We found that mCCD monolayers cultured in flow exposed to apical CoCl2 treatment showed an initial, transient, increase in TER but no chronic change to the TER. The I eq values mostly remained unaffected except for a transient change on day 23 in culture (i.e., 5 days of CoCl2 treatment), shown in Figure 9. However, when CoCl2 was added only to the basolateral media, we noted significant dose‐dependent decreases in both TER and I eq values, shown in Figure 10. Basolateral treatment with 100 μmol/L CoCl2 showed significant decreases in TER values after 2 days of treatment as shown in Figure 10A. Thus, it is interesting to find that CoCl2 affects the electrophysiological properties of our monolayers only when it is added in the basolateral media, potentially identifying the site of couptake.
Figure 9.
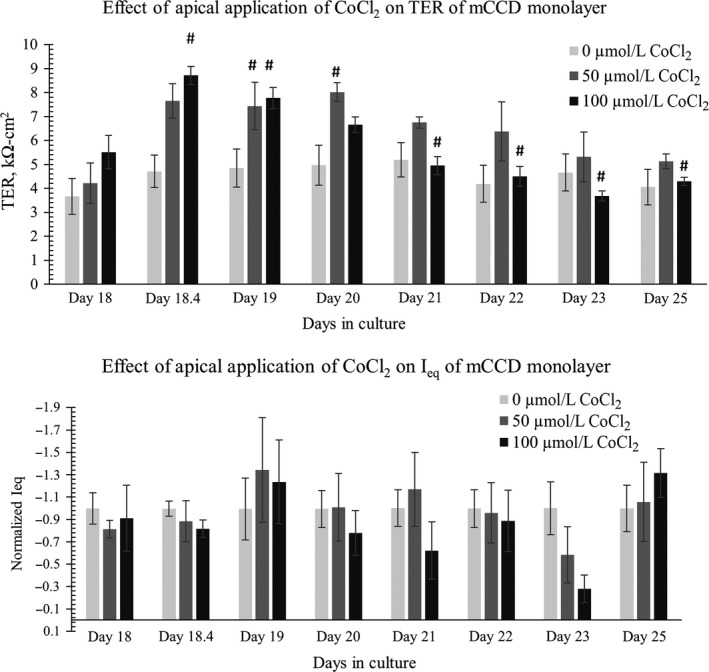
CoCl2 added to apical media on day 18. Data shows that application of CoCl2 in apical media does not cause a significant chronic change in (top) TER values or (bottom) I eq values of differentiated mCCD monolayers. N = 5–8. In the TER and I eq data, One‐way ANOVA shows no significant (P > 0.05) TER and Ieq changes among control groups. In the TER plot, * denotes significant change (P < 0.05) among 0 μmol/L CoCl2, 50, and μmol/L 100 CoCl2 treatment at a specific time‐point. # denotes CoCl2 treatment causes significant change (P < 0.05) between CoCl2‐treated sample at a specific time point with CoCl2‐treated or control sample at a different time point. Not all significance (#) are shown in the graph; all # are marked onto any noticeable change and applicable to group treated with CoCl2. There is no significant effect (P > 0.05) of apical application of 0, 50, or 100 μmol/L CoCl2 on I eq.
Figure 10.
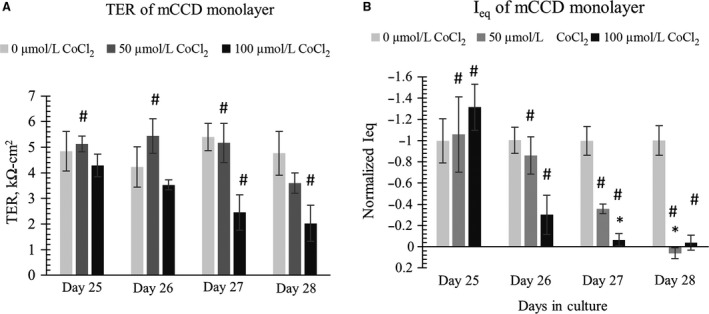
CoCl2 was withdrawn from apical media and added to basolateral media on day 25. Data shows that application of 100 μmol/L CoCl2 to basolateral media significantly decreased (left) TER values and (right) I eq values of differentiated mCCD monolayers in a dose‐dependent manner after 2 days of treatment (N = 5–6). In the TER and I eq data, One‐way ANOVA shows no significant (P > 0.05) TER and I eq changes among control groups. In the TER plot, * denotes significant change (P < 0.05) among 0 μmol/L CoCl2, 50, and μmol/L 100 CoCl2 treatment at a specific time‐point. # denotes CoCl2 treatment causes significant change (P < 0.05) between CoCl2‐treated sample at a specific time point with CoCl2‐treated or control sample at a different time point. In figure (A) we do not see statistically significant decrease in TER, * (P < 0.05) on day 27 or day 28 by 50 or 100 μmol/L CoCl2 as compared to control (0 μmol/L CoCl2) on that specific day. However, we notice some significant decrease in TER as compared to control at a different time point. For example on day 28, 100 μmol/L CoCl2 causes significant decrease in the TER value when compared to 0 μmol/L CoCl2 TER value on day 27, denoted by #. In figure (B) we notice significant loss of I eq with 100 μmol/L CoCl2 treatment on day 27 and significant loss of I eq with both 50 and 100 μmol/L CoCl2 treatment on day 28. Not all significance (#) are shown in the graph; all # are marked onto any noticeable change and applicable to group treated with CoCl2.
Discussion
100 μmol/L CoCl2 stabilizes HIF‐1α without affecting cell viability
In our mCCD monolayers 100 μmol/L CoCl2 was found to significantly stabilize HIF‐1α in the nucleus and also resulted in a slight increased production of EPO, not statistically significant. 100 μmol/L CoCl2 was previously reported to stabilize HIF1α in the nucleus of Madin‐Darby Canine Kidney (MDCK) epithelial cells (Verghese et al. 2011). Other studies showed cobalt can increase EPO production (Fisher and Langston 1967; Fandrey et al. 1997). CoCl2 was previously shown to prevent cell growth of mouse embryonic fibroblasts at a concentration of 100 μmol/L. However, our MTT assay showed 100 μmol/L CoCl2 did not have any significant effect on the cell viability of the fibroblasts after 72 h (Vengellur and LaPres 2004). Similarly, we did not notice any change in the cell viability levels of mCCD kidney epithelial cells by 100 μmol/L CoCl2.
As mentioned previously, in kidney cystic epithelia of rats and humans HIF‐1α protein level and mRNA levels of HIFα target genes, such as EPO, glucose transporter‐1 (Glut‐1), and vascular endothelial growth factor (VEGF) were found to be elevated (Bernhardt et al. 2007). Using CoCl2 we stabilized HIF‐1α in our kidney epithelial monolayers to better understand potential roles of ischemia‐hypoxia or otherwise HIF stabilized environment as experienced by normal kidney epithelial cells in an ischemic environment created by the presence of cysts in PKD.
Effect of Fluid Flow with HIF stabilization
Our electrophysiological results suggest that the presence of fluid flow may blunt HIF‐stabilized altered transepithelial transport. For example, both I eq and TER values decreased more rapidly in the absence of fluid flow as compared to monolayers cultured in the presence of chronic fluid flow.
While it is tempting to suggest that monolayers cultured in the absence of fluid flow may be hypoxic to some extent and may already have increased HIF to some extent, our use of thin apical fluid thickness ensures adequate O2 transport to the monolayer. Two possible alternative explanations for more prominent effects of CoCl2 in cultures lacking fluid flow are (1) the level of stabilized HIFα by CoCl2 may be higher in cultures lacking fluid flow, or (2) CoCl2 can stabilize HIFα in the cultures without fluid flow at an earlier time point as compared to cultures with fluid flow. We tried to directly measure alterations of HIF levels via Western blot, but our bands were too faint to provide meaningful results. We compared EPO levels but could not detect any statistically significant difference between CoCl2 treated with or without fluid flow. Moreover, comparing ZO‐1 and NaKATPase α1 subunit levels, we could not detect any statistically significant difference due to HIF‐1α stabilization with or without fluid flow. Taken together, this implies that the examined epithelial response to fluid flow is independent of HIF‐1α.
HIF Stabilization by CoCl2 alters transcellular and paracellular transport
In the mammalian kidney, paracellular permeability is known to decrease from proximal tubule to collecting duct due to the unique expression of claudins and higher levels of occludin and zonula occludin‐1 (ZO‐1) (Gonzalez‐Mariscal et al. 2000; Denker and Sabath 2011). Paracellular transport through epithelial tight junctions is driven by the ion gradient created due to transcellular active transport. In our mCCD monolayers HIF stabilization for 72 h with CoCl2 resulted in a 100 fold increase in 3 kDa FITC‐dextran permeability and 40 fold increase in 70 kDa FITC ‐dextran permeability. Thus, paracellular transport through tight mCCD monolayers was found to increase due to HIF stabilization.
Epithelial tight junctions maintain the high electrochemical gradient created by transcellular transport (Anderson and Van Itallie 2009). High TER values generally correspond to low paracellular flux and low TER values generally refer to monolayers with high paracellular flux. mCCD monolayers show high TER values, around 3 kΩ‐cm2. Increased FITC‐dextran permeability is consistent with decreased TER values due to HIF stabilization. The cortical collecting duct is responsible for 0.5% salt reabsorption and helps in fine‐tuning water and salt balance in the body. mCCD I eq is primarily generated by sodium transport through ENaC channels and 95% of I eq can be blocked by 10 μmol/L amiloride, a sodium channel blocker (Resnick and Hopfer 2007; Resnick 2011). We noticed that HIF stabilization by CoCl2 caused decreased I eq values, indicating mainly the loss of active sodium transport.
Similar observations to our results were made studying the effect of hypoxia on aleveolar epithelial cells (Mairbäurl et al. 2002). Hypoxia was found to decrease active sodium transport through rat alveolar epithelial monolayers and also decreased TER of monolayers, increasing permeability of 4 kDa dextran‐FITC through the epithelial monolayers (Mairbäurl et al. 2002; Bouvry et al. 2006). Hypoxia was found to decrease ZO‐1 protein levels in the same alveolar monolayer (Bouvry et al. 2006). Hypoxia can affect the actin cytoskeleton organization and can result in occludin mislocalization from tight junctions to the cell interior (Bouvry et al. 2006). Hypoxia was shown affect the expression or activity of apical ENaC and basolateral NaKATPase causing decrease in active sodium transport, resulting in reduced ability of alveolar epithelium to clear alveolar edema fluid (Vivona et al. 2001; Planès et al. 2002; Dada et al. 2003). Hypoxia was shown to alter tight junctions and permeability of other cell types, such as brain microvessel endothelial cells and intestinal epithelial cells (Xu et al. 1999; Yamagata et al. 2004; Engelhardt et al. 2014), supporting our findings that HIF stabilization can decrease monolayer resistance and can increase FITC‐dextran permeability. Similarly, our western blots showed that stabilization of HIF1α by CoCl2, decreased levels of ZO‐1 and NaKATPase α1 subunit independent of fluid flow.
Our measurements demonstrating altered transepithelial permeability is relevant is supported by other results demonstrating that epithelial tight junction morphology is regulated by HIF, with claudins (Saeedi et al. 2015) and occludins (Caraballo et al. 2011) being specific targets. Similarly, our electrophysiological measurements are in concordance with other results (Caraballo et al. 2011).
Stabilization of HIF1α by CoCl2 results in decreased TER values of mCCD monolayers corresponding to increased permeability of 3 kDa and 70 kDa dextran‐fluorescein. 3 kDa dextrans can be transported through epithelial monolayers either by fluid‐phase transcytosis or by paracellular transport, whereas large 70 kDa dextran molecules are known to be transported only through the paracellular pathway (Matter and Balda 2003). Thus, changes in 70 kDa transport through mCCD monolayers represent changes in the paracellular pathway.
Using 3 kDa and 70 kDa FITC‐Dextran molecules, we were able to identify that the size selectivity was maintained by mCCD epithelial monolayer tight junctions. Increased permeability of anionic FITC‐dextran from apical to basolateral side suggests increased paracellular transport which can also be indicative of increased water permeability.
Conclusion
In summary, in mCCD monolayers, we noted that HIF stabilization by CoCl2 caused loss of I eq and may show a positive I eq value in the absence of fluid flow, indicating that the net flux of sodium ions may be transported in the opposite direction and thus those epithelial monolayers may be secretory rather than absorptive. In mCCD monolayers HIF stabilization showed a significant decrease in the TER values and increase in 70 kDa permeability due to paracellular pathway changes. Thus, HIF stabilization seems to affect both the transcellular and paracellular pathways of kidney epithelial monolayers. Increased FITC‐dextran permeability through cellular monolayers of mCCD indicated altered selective epithelial barrier function. Decreased levels of tight junction protein, such as ZO‐1 causes decreased resistance and increased paracellular permeability of epithelial monolayer. Decreased levels of basolateral enzyme NaKATPase can be at least partly responsible for the loss of transcellular transport of sodium ions. Moreover, we identified that CoCl2 uptake may occur via basolateral side of monolayers.
In conclusion, we have provided preliminary evidence in support of our hypothesis that HIF stabilization can contribute to kidney cyst expansion by increasing tissue permeability and reversing net sodium transport through normal kidney epithelia. We suspect this path may also involve cAMP, as increased levels of cAMP are associated with microcysts. It has been shown that HIF‐1α contains a cAMP‐response element binding (CREB) binding site (Kvietikova et al. 1995). It has also been shown that HIF‐1α accumulates via the cAMP‐mediated induction of the mTOR pathway in beta cells (Van de Velde et al. 2011), but we did not directly test the role of cAMP in our cells.
Conflict of Interest
The authors have no conflicts of interest to declare.
Nag S., Resnick A.. Stabilization of hypoxia inducible factor by cobalt chloride can alter renal epithelial transport. Physiol Rep, 5 (24), 2017, e13531, https://doi.org/10.14814/phy2.13531
Funding Information
This research was supported by the Dr. John Vitullos Pilot and Bridge Funding. Program at the Center for Gene Regulation in Health and Disease (GRHD), NIH DK092716 award (both to AR) and Cleveland State University Dissertation Research Award to SN.
References
- Abbott, N. , Revest P., Greenwood J., Romero I., Nobles M., and Rist R., et al. 1997. Preparation of primary rat brain endothelial cell culture. Modified method of CCW Hughes. in De Boer A. G. and Sutanto W., eds. Drug transport across the blood‐brain barrier: in vitro and in vivo techniques. Harwood Academic Publishers, Amsterdam. [Google Scholar]
- Anderson, J. M. , and Van Itallie C. M.. 2009. Physiology and function of the tight junction. Cold Spring Harb Perspect Biol 1:a002584. [DOI] [PMC free article] [PubMed] [Google Scholar]
- Artursson, P. 1990. Epithelial transport of drugs in cell culture. I: a model for studying the passive diffusion of drugs over intestinal absorbtive (Caco‐2) cells. J. Pharm. Sci. 79:476–482. [DOI] [PubMed] [Google Scholar]
- Balda, M. S. , and Matter K.. 2007. Size‐selective assessment of tight junction paracellular permeability using fluorescently labelled dextrans. bmglabtech, Ortenberg, Germany. [Google Scholar]
- Belibi, F. , Zafar I., Ravichandran K., Segvic A. B., Jani A., Ljubanovic D. G., et al. 2011. Hypoxia‐inducible factor‐1α (HIF‐1α) and autophagy in polycystic kidney disease (PKD). American Journal of Physiology‐Renal Physiology 300:F1235–F1243. [DOI] [PMC free article] [PubMed] [Google Scholar]
- Bernhardt, W. M. , Wiesener M. S., Weidemann A., Schmitt R., Weichert W., Lechler P., et al. 2007. Involvement of hypoxia‐inducible transcription factors in polycystic kidney disease. Am. J. Pathol. 170:830–842. [DOI] [PMC free article] [PubMed] [Google Scholar]
- Bouvry, D. , Planes C., Malbert‐Colas L., Escabasse V., and Clerici C.. 2006. Hypoxia‐induced cytoskeleton disruption in alveolar epithelial cells. Am. J. Respir. Cell Mol. Biol. 35:519–527. [DOI] [PubMed] [Google Scholar]
- Buchholz, B. , Schley G., Faria D., Kroening S., Willam C., Schreiber R., et al. 2013. Hypoxia‐inducible factor‐1α causes renal cyst expansion through calcium‐activated chloride secretion. J. Am. Soc. Nephrol. 25:465–474. ASN. 2013030209. [DOI] [PMC free article] [PubMed] [Google Scholar]
- Calvet, J. P. , and Grantham J. J.. 2001. The genetics and physiology of polycystic kidney disease. Semin. Nephrol.Elsevier 21:107–123. [DOI] [PubMed] [Google Scholar]
- Caraballo, J. C. , Yshii C., Butti M. L., Westphal W., Borcherding J. A., Allamargot C., et al. 2011. Hypoxia increases transepithelial electrical conductance and reduces occludin at the plasma membrane in alveolar epithelial cells via PKC‐zeta and PP2A pathway. Am. J. Physiol. Lung Cell. Mol. Physiol. 300:L569–L578. [DOI] [PMC free article] [PubMed] [Google Scholar]
- Chandra, M. , Miller M., Mossey R., and McVicar M.. 1985. Serum immunoreactive erythropoietin levels in patients with polycystic kidney disease as compared with other hemodialysis patients. Nephron 39:26–29. [DOI] [PubMed] [Google Scholar]
- Cowley, B. D. , Ricardo S. D., Nagao S., and Diamond J. R.. 2001. Increased renal expression of monocyte chemoattractant protein‐1 and osteopontin in ADPKD in rats. Kidney Int. 60:2087–2096. [DOI] [PubMed] [Google Scholar]
- Dada, L. A. , Chandel N. S., Ridge K. M., Pedemonte C., Bertorello A. M., and Sznajder J. I.. 2003. Hypoxia‐induced endocytosis of Na, K‐ATPase in alveolar epithelial cells is mediated by mitochondrial reactive oxygen species and PKC‐ζ . J. Clin. Investig. 111:1057–1064. [DOI] [PMC free article] [PubMed] [Google Scholar]
- Denker, B. M. , and Sabath E.. 2011. The biology of epithelial cell tight junctions in the kidney. J. Am. Soc. Nephrol. 22:622–625. [DOI] [PubMed] [Google Scholar]
- Engelhardt, S. , Al‐Ahmad A. J., Gassmann M., and Ogunshola O. O.. 2014. Hypoxia Selectively Disrupts Brain Microvascular Endothelial Tight Junction Complexes Through a Hypoxia‐Inducible Factor‐1 (HIF‐1) Dependent Mechanism. J. Cell. Physiol. 229:1096–1105. [DOI] [PubMed] [Google Scholar]
- Fandrey, J. , Frede S., Ehleben W., Porwol T., Acker H., and Jelkmann W.. 1997. Cobalt chloride and desferrioxamine antagonize the inhibition of erythropoietin production by reactive oxygen species. Kidney Int. 51:492–496. [DOI] [PubMed] [Google Scholar]
- Fauci, A. S . 2008. Harrison's principles of internal medicine. McGraw‐Hill, Medical Publishing Division, NY, USA. [Google Scholar]
- Fick, A. V. 1855. On Liquid Diffusion. Philos. Mag. Series 4:30–39. [Google Scholar]
- Fisher, J. W. , and Langston J.. 1967. The influence of hypoxemia and cobalt on erythropoietin production in the isolated perfused dog kidney. Blood 29:114–125. [PubMed] [Google Scholar]
- Forbes, J. R. , and Gros P.. 2003. Iron, manganese, and cobalt transport by Nramp1 (Slc11a1) and Nramp2 (Slc11a2) expressed at the plasma membrane. Blood 102:1884–1892. [DOI] [PubMed] [Google Scholar]
- Gaillard, P. J. , Voorwinden L. H., Nielsen J. L., Ivanov A., Atsumi R., Engman H., et al. 2001. Establishment and functional characterization of an in vitro model of the blood–brain barrier, comprising a co‐culture of brain capillary endothelial cells and astrocytes. Eur. J. Pharm. Sci. 12:215–222. [DOI] [PubMed] [Google Scholar]
- Garty, H. , and Palmer L. G.. 1997. Epithelial sodium channels: function, structure, and regulation. Physiol. Rev. 77:359–396. [DOI] [PubMed] [Google Scholar]
- Gonzalez‐Mariscal, L. , Namorado M. C., Martin D., Luna J., Alarcon L., Islas S., et al. 2000. Tight junction proteins ZO‐1, ZO‐2, and occludin along isolated renal tubules1. Kidney Int. 57:2386–2402. [DOI] [PubMed] [Google Scholar]
- Grantham, J. J. 2001. Polycystic kidney disease: from the bedside to the gene and back. Curr. Opin. Nephrol. Hypertens. 10:533–542. [DOI] [PubMed] [Google Scholar]
- Gunshin, H. , Mackenzie B., Berger U. V., Gunshin Y., Romero M. F., Boron W. F., et al. 1997. Cloning and characterization of a mammalian proton‐coupled metal‐ion transporter. Nature 388:482–488. [DOI] [PubMed] [Google Scholar]
- Ivan, M. , Kondo K., Yang H., Kim W., Valiando J., Ohh M., et al. 2001. HIFα targeted for VHL‐mediated destruction by proline hydroxylation: implications for O2 sensing. Science 292:464–468. [DOI] [PubMed] [Google Scholar]
- Jat, P. S. , Noble M. D., Ataliotis P., Tanaka Y., Yannoutsos N., Larsen L., et al. 1991. Direct derivation of conditionally immortal cell lines from an H‐2Kb‐tsA58 transgenic mouse. Proc. Natl Acad. Sci. USA 88:5096–5100. [DOI] [PMC free article] [PubMed] [Google Scholar]
- Kaelin, W. G. 2002. How oxygen makes its presence felt. Genes Dev. 16:1441–1445. [DOI] [PubMed] [Google Scholar]
- Kvietikova, I. , Wenger R. H., Marti H. H., and Gassmann M.. 1995. The transcription factors ATF‐1 and CREB‐1 bind constitutively to the hypoxia‐inducible factor‐1 (HIF‐1) DNA recognition site. Nucleic Acids Res. 23:4542–4550. [DOI] [PMC free article] [PubMed] [Google Scholar]
- Mairbäurl, H. , Mayer K., Kim K.‐J., Borok Z., Bärtsch P., and Crandall E. D.. 2002. Hypoxia decreases active Na transport across primary rat alveolar epithelial cell monolayers. Am. J. Physiol. Lung Cell. Mol. Physiol. 282:L659–L665. [DOI] [PubMed] [Google Scholar]
- Mangoo‐Karim, R. , Uchic M., Lechene C., and Grantham J. J.. 1989. Renal epithelial cyst formation and enlargement in vitro: dependence on cAMP. Proc. Natl Acad. Sci. USA 86:6007–6011. [DOI] [PMC free article] [PubMed] [Google Scholar]
- Matter, K. , and Balda M. S.. 2003. Functional analysis of tight junctions. Methods 30:228–234. [DOI] [PubMed] [Google Scholar]
- vanMeerloo, J. , Kaspers G. J., and Cloos J.. 2011. Cell sensitivity assays: the MTT assay. Methods Protocols 731:237–245. [DOI] [PubMed] [Google Scholar]
- Planès, C. , Blot‐Chabaud M., Matthay M. A., Couette S., Uchida T., and Clerici C.. 2002. Hypoxia and β2‐agonists regulate cell surface expression of the epithelial sodium channel in native alveolar epithelial cells. J. Biol. Chem. 277:47318–47324. [DOI] [PubMed] [Google Scholar]
- Resnick, A. 2011. Chronic fluid flow is an environmental modifier of renal epithelial function. PLoS ONE 6:e27058. [DOI] [PMC free article] [PubMed] [Google Scholar]
- Resnick, A. , and Hopfer U.. 2007. Force‐response considerations in ciliary mechanosensation. Biophys. J . 93:1380–1390. [DOI] [PMC free article] [PubMed] [Google Scholar]
- Saeedi, B. J. , Kao D. J., Kitzenberg D. A., Dobrinskikh E., Schwisow K. D., Masterson J. C., et al. 2015. HIF‐dependent regulation of claudin‐1 is central to intestinal epithelial tight junction integrity. Mol. Biol. Cell 26:2252–2262. [DOI] [PMC free article] [PubMed] [Google Scholar]
- Semenza, G. L. 1999. Regulation of mammalian O2 homeostasis by hypoxia‐inducible factor 1. Annu. Rev. Cell Dev. Biol. 15:551–578. [DOI] [PubMed] [Google Scholar]
- Siflinger‐Birnboim, A. , del Vecchio P. J., Cooper J. A., Blumenstock F. A., Shepard J. M., and Malik A. B.. 1987. Molecular sieving characteristics of the cultured endothelial monolayer. J. Cell. Physiol. 132:111–117. [DOI] [PubMed] [Google Scholar]
- Sullivan, L. P. , Wallace D. P., and Grantham J. J.. 1998. Epithelial transport in polycystic kidney disease. Physiol. Rev. 78:1165–1191. [DOI] [PubMed] [Google Scholar]
- Van de Velde, S. , Hogan M. F., and Montminy M.. 2011. mTOR links incretin signaling to HIF induction in pancreatic beta cells. Proc. Natl Acad. Sci. USA 108:16876–16882. [DOI] [PMC free article] [PubMed] [Google Scholar]
- Vengellur, A. , and LaPres J.. 2004. The role of hypoxia inducible factor 1α in cobalt chloride induced cell death in mouse embryonic fibroblasts. Toxicol. Sci. 82:638–646. [DOI] [PubMed] [Google Scholar]
- Verghese, E. , Zhuang J., Saiti D., Ricardo S. D., and Deane J. A.. 2011. In vitro investigation of renal epithelial injury suggests that primary cilium length is regulated by hypoxia‐inducible mechanisms. Cell Biol. Int. 35:909–913. [DOI] [PubMed] [Google Scholar]
- Vivona, M. L. , Matthay M., Chabaud M. B., Friedlander G., and Clerici C.. 2001. Hypoxia reduces alveolar epithelial sodium and fluid transport in rats: reversal by β‐adrenergic agonist treatment. Am. J. Respir. Cell Mol. Biol. 25:554–561. [DOI] [PubMed] [Google Scholar]
- Wang, G. L. , and Semenza G. L.. 1993. General involvement of hypoxia‐inducible factor 1 in transcriptional response to hypoxia. Proc. Natl Acad. Sci. 90:4304–4308. [DOI] [PMC free article] [PubMed] [Google Scholar]
- Wang, C. J. , Grantham J. J., and Wetmore J. B.. 2013. The medicinal use of water in renal disease. Kidney Int. 84:45–53. [DOI] [PubMed] [Google Scholar]
- Xu, D.‐Z. , Lu Q., Kubicka R., and Deitch E. A.. 1999. The effect of hypoxia/reoxygenation on the cellular function of intestinal epithelial cells. J. Trauma 46:280–285. [DOI] [PubMed] [Google Scholar]
- Yamagata, K. , Tagami M., Takenaga F., Yamori Y., and Itoh S.. 2004. Hypoxia‐induced changes in tight junction permeability of brain capillary endothelial cells are associated with IL‐1beta and nitric oxide. Neurobiol. Dis. 17:491–499. [DOI] [PubMed] [Google Scholar]
- Yuan, S. Y. , and Rigor R. R.. 2010. Methods for measuring permeability.
- Yuan, Y. , Hilliard G., Ferguson T., and Millhorn D. E.. 2003. Cobalt inhibits the interaction between hypoxia‐inducible factor‐α and von Hippel‐Lindau protein by direct binding to hypoxia‐inducible factor‐α . J. Biol. Chem. 278:15911–15916. [DOI] [PubMed] [Google Scholar]
- Zeier, M. , Jones E., and Ritz E.. 1996. Autosomal dominant polycystic kidney disease—the patient on renal replacement therapy. Nephrol. Dial. Transplant. 11:18–20. [DOI] [PubMed] [Google Scholar]
- Zheng, D. , Wolfe M., Cowley B. D., Wallace D. P., Yamaguchi T., and Grantham J. J.. 2003. Urinary excretion of monocyte chemoattractant protein‐1 in autosomal dominant polycystic kidney disease. J. Am. Soc. Nephrol. 14:2588–2595. [DOI] [PubMed] [Google Scholar]


