

Abstract
Background
Alcohol abuse frequently causes niacin deficiency in association with the development of alcoholic liver disease. The objective of the present study was to determine if dietary nicotinic acid (NA) deficiency exaggerates and if dietary NA supplementation alleviates alcohol-induced fatty liver.
Methods
Male Sprague-Dawley rats were pair-fed with 4 isocaloric liquid diets, control ethanol, ethanol with dietary NA deficiency, and ethanol with dietary NA supplementation, respectively, for 8 weeks. The control and ethanol diets contained normal levels of NA (7.5 mg/L). Dietary NA deficiency (0 mg NA/L) was achieved by removing NA from the vitamin mix, while NA was added to the liquid diet at 750 mg/L for dietary NA supplementation.
Results
Chronic ethanol feeding induced significant lipid accumulation in the liver, which was not worsened by dietary NA deficiency, but was ameliorated by dietary NA supplementation. Liver total NAD, NAD+, and NADH levels were remarkably higher in the NA supplemented group than the NA deficient or ethanol alone groups. Dietary NA supplementation to ethanol-fed rats increased the protein levels of hepatic cytochrome P450 4A1 (CYP4A1) and acyl-Coenzyme A oxidase 1 without affecting their mRNA levels. Interestingly, we found dietary NA supplementation reduced the ubiquitination level of CYP4A1. In addition, hepatic fatty acid synthase expression was reduced, while the serum β-hydroxybutyrate and adiponectin concentrations were significantly elevated by dietary NA supplementation. Moreover, dietary NA supplementation modulated ethanol-perturbed liver and serum metabolite profiles.
Conclusions
These results demonstrate that alcoholic fatty liver was not exaggerated by dietary NA deficiency, but was ameliorated by dietary NA supplementation. Increased hepatic fatty acid oxidation and decreased hepatic de novo lipogenesis contribute to the effects of dietary NA supplementation.
Keywords: Alcoholic fatty liver, lipid metabolism, nicotinic acid
Introduction
Excess alcohol consumption is a major etiologic factor in the development of fatty liver (steatosis), which is characterized by the accumulation of large lipid droplets (macrovesicle steatosis) in hepatocytes (Lakshman, 2004; Sozio and Crabb, 2008). In the liver, alcohol is metabolized by alcohol dehydrogenase to acetaldehyde, which is further metabolized by aldehyde dehydrogenase to acetate; both enzymes use nicotinamide adenine dinucleotide (NAD+) as a cofactor, favoring the accumulation of the reducing equivalent, NADH, in hepatocytes. This shift in the redox state could affect multiple hepatic carbohydrate and lipid metabolic pathways, including the citric acid cycle and fatty acid oxidation, which can lead to lipid deposition in the liver (Purohit et al., 2009; Nagy, 2004; Gyamfi and Wan, 2010). Although liver steatosis was initially considered benign, it is now being recognized that excess fat accumulation plays a direct role in the progression to more advanced alcoholic liver injury, whereby the severity of damage is proportional to the extent of steatosis (Nagy, 2004; Gyamfi and Wan, 2010; Sorensen et al., 1984). Alcoholic steatosis is reversible and prevention or reduction of the condition during alcohol consumption may block or delay the progression of alcoholic liver disease.
Nicotinic acid (NA), also known as niacin, is one of the naturally occurring B3 vitamins. Other forms of vitamin B3 include nicotinamide. Vitamin B3 is the precursor of NAD+ and its analog NAD phosphate (NADP), both of which play crucial roles in energy metabolism and cell protection pathways (Godin et al., 2012). In addition to being a nutrient, NA has been used for decades as a broad-spectrum lipid-regulating medication and the first lipid-based intervention to prevent cardiovascular disease (Kamanna and Kashyap, 2008; Karpe and Frayn, 2004). Moreover, in recent years, accumulating evidence from in vitro and in vivo studies supports the hypothesis that NA possesses potent antioxidant and anti-inflammatory properties (Godin et al., 2012; Dou et al., 2013).
Alcohol abuse is frequently associated with multiple nutritional deficiencies, including niacin deficiency (Varella Morandi Junqueira-Franco et al., 2006). While this is known to cause pellagra, it is also a pathophysiological factor in the development of alcoholic liver disease (Varella Morandi Junqueira-Franco et al., 2006; Vannucchi and Moreno, 1989). The objective of the present study was to determine if dietary NA deficiency exaggerates and if dietary NA supplementation alleviates alcohol-induced lipid accumulation in the liver. The possible mechanisms of how NA affects hepatic lipid metabolism were also examined.
Materials and Methods
Animals and ethanol feeding experiments
Male Sprague-Dawley rats were obtained from Charles River (Wilmington, MA) and treated according to the experimental procedures approved by the Institutional Animal Care and Use Committee of our institution. Three-month-old rats were divided into 4 groups: control (Ctrl, n = 6), ethanol (EtOH, n = 8), ethanol with dietary NA deficiency (EtOH/ND, n = 8), and ethanol with dietary NA supplementation (EtOH/NS, n = 8). All rats were pair-fed with isocaloric maltose dextrin control or ethanol liquid diets based on Lieber-DeCarli liquid diet formula. For the control liquid diet, 16% of the energy was derived from protein, 34% from fat, and 50% from carbohydrate. A portion of carbohydrate in the control diet was replaced by ethanol in the ethanol liquid diet. To promote generation of alcoholic liver injury, a step-wise feeding procedure was introduced. The ethanol content (%, w/v) in the ethanol liquid diet was 5%, 5.14%, 5.29%, and 5.43% for 1-2, 3-4, 5-6, and 7-8 weeks of feeding, respectively. The ethanol energy consisted of 35%, 36%, 37%, and 38% of the total dietary calories, respectively. To achieve equal daily energy intake, the ethanol group was fed ad libitum, and the other groups were pair-fed the amount consumed by the ethanol-fed rats during the prior day. All gradients for the liquid diets were obtained from Dyets (Bethlehem, PA), with the exception of 95% ethanol (Sigma-Aldrich, St. Louis, MO). The Ctrl and EtOH diets contained normal levels of NA (7.5 mg/L). Dietary NA deficiency (0 mg NA/L) was achieved by removing NA from the vitamin mix, while NA was added to the liquid diet at 750 mg/L for dietary NA supplementation. At the end of the experiment, rats were euthanized with isoflorane, and serum and liver tissue samples were harvested for subsequent assays.
Blood parameters Assay
Blood glucose was measured using OneTouch Ultra2 blood glucose meter (Life Scan, Milpitas, CA). Serum β-hydroxybutyrate was determined using the Cayman Chemical β-hydroxybutyrate assay kit (Ann Arbor, MI). Serum triglyceride (TG) and cholesterol were measured using the Infinity Assay Reagents (Thermo Scientific, Waltham, MA). Serum free fatty acids (FFA) were determined with a BioVision FFA Kit (Milpitas, CA). Activities of alanine aminotransferase (ALT) and aspartate aminotransferase (AST) were measured with Infinity kit (Thermo Scientific). Serum adiponectin and leptin levels were determined using ELISA kits (Millipore, Billerica, MA). Serum ethanol concentration was measured using BioVision ethanol assay kit.
Determination of hepatic lipid accumulation
Liver tissues were frozen in Tissue-Tek OTC (Optimum cutting temperature) Compound (VWR, Batavia, IL). Cryostat liver tissue sections were cut at 7 μm, fixed and processed for the staining of neutral lipid with Oil red O solution. Quantitative assay of lipids was conducted by measuring the concentrations of triglycerides, cholesterol and FFA in liver tissues using BioVision Assay kits.
Hepatic NAD determination
Liver contents of total NAD, NAD+, and NADH were measured using BioVision NAD+/NADH Quantitation Colorimetric Kit.
Metabolomics Analysis
Liver and serum samples were prepared and analyzed with high performance liquid chromatography-time of flight mass spectrometry (HPLC-TOFMS) (Xie et al., 2013; Zhong et al., 2013). Agilent HPLC 1200 system (Agilent Corporation, Santa Clara, CA) was used with chromatographic separations performed on a 4.6 × 150 mm 5 μm Agilent ZoRbax Eclipse XDB-C18 chromatography column. Mass spectrometry was performed using an Agilent model 6220 MSD TOF mass spectrometer. The raw data generated from HPLC-TOFMS was analyzed by MassHunter Qualitative Analysis Program (vB.05.01, Agilent). Data were subjected to orthogonal partial least squares-discriminant analysis (OPLS-DA) to establish characteristic metabolomic profiles of different groups. Student's t-test was applied to determine the significance difference of each metabolite between groups. The corresponding fold change shows how these selected differential metabolites varied between groups (Chen et al., 2011). Compounds identification was performed by comparing the accurate mass and retention time with reference standards available in our laboratory, or comparing the accurate mass with online database such as the Human Metabolome Database (http://www.hmdb.ca/).
Immunoblot analysis
Liver tissue proteins were extracted by RIPA buffer containing protease inhibitors (Sigma-Aldrich). Aliquots containing 50μg protein were loaded onto 4-12% SDS-PAGE and transferred to PVDF membranes. The membrane was probed with antibodies against ADH (Alcohol dehydrogenase), DGAT1 (Diacylglycerol acyltransferase 1) (Novus Biotechnologies, Littleton, CO); Catalase, PMP70 (70kDa Peroxisomal membrane protein), PGC1α (Peroxisome proliferator-activated receptor gamma coactivator 1-alpha) (EMD Millipore, Billerica, MA); CYP4A1, ALDH2 (Aldehyde dehydrogenase 2) (Santa Cruz Biotechnologies, Santa Cruz, CA); CPT1A (Carnitine palmitoyltransferase 1 A), ACADL (Acyl-CoA dehydrogenase, long chain), ACOX1 (Acyl-coenzyme A oxidase 1) (Proteintech Group, Chicago, IL); FAS (Fatty acid synthase), ACC (Acetyl-CoA carboxylase), RXRα (Retinoid X receptor alpha) (Cell Signaling Technology, Danvers, MA); CYP2E1, LIPIN1, Ubiquitin (Abcam, Cambridge, MA); DGAT2 (Diacylglycerol acyltransferase 2) (Acris Antibodies, San Diego, CA), followed by incubation with HRP-conjugated anti-rabbit or anti-mouse IgG antibody. Protein bands were visualized by an Enhanced Chemiluminescence detection system (GE Healthcare, Piscataway, NJ) and quantified by densitometry analysis.
Immunoprecipitation
Liver tissue protein was extracted with immunoprecipitation buffer and diluted into a concentration of 2 mg/ml. After pre-clearing of the lysates, mouse monoclonal antibody against CYP4A1 was added to 500μl lysates at a dilution of 1:100, and the samples were incubated overnight at 4 °C with gentle agitation. At the end of incubation, 30 μL of protein A/G-Sepharose bead suspension (Cell Signaling Technology) was added to each sample and gently mixed for 4 h at 4 °C. Samples were centrifuged at 12,000 rpm for 30 s; the supernatant was aspirated, and the beads were washed three times in 1 mL of IP buffer. The isolated beads were re-suspended in 20μl 2 × SDS-PAGE loading buffer, heated to 95 °C for 5 min, vortexed, and flash-centrifuged. The supernatants were loaded onto a 10% SDS-PAGE and immunoblotting with mouse monoclonal antibody against CYP4A1 and rabbit polyclonal antibody against ubiquitin.
qRT-PCR analysis
Total RNA was isolated from liver tissues and reverse transcribed with TaqMan Reverse Transcription Reagents (Life Technologies, Carlsbad, CA). The primers of ACOX1 and CYP4A1 were purchased from Integrated DNA Technologies (Coralville, IA). qRT-PCR analysis with SYBR green PCR Master Mix (Qiagen, Valencia, CA) was performed on an Applied Biosystems 7500 PCR System. The data were normalized to 18S rRNA mRNA expression and presented as fold changes, setting the values of control as one.
Statistical analysis
Results are expressed as mean ± SD. Comparisons of the liver and serum metabolites were analyzed by independent samples t-test, while all the other data were analyzed by one way analysis of variance (ANOVA) followed by Student-Newman-Keuls test. Differences between groups were considered significant at p < 0.05.
Results
Body weight, liver weight, and blood parameters of rats after 8 weeks of liquid diet feeding
As shown in Table 1, there was no significant difference in body weight among all the feeding groups. Ethanol exposure significantly increased the liver weight (p < 0.05), which was not influenced by dietary NA levels. The blood glucose level was not affected by ethanol alone, but was reduced by dietary NA supplementation (p < 0.05). The serum β-hydroxybutyrate concentration was remarkably elevated in EtOH and EtOH/ND groups (p < 0.001), and it was further increased by dietary NA supplementation (p < 0.05). Serum triglyceride level was reduced by ethanol feeding regardless of the dietary NA level (p < 0.001). In addition, the serum cholesterol level was increased in EtOH (p < 0.05) and EtOH/ND (p < 0.05) groups, but not in the EtOH/NS group. Serum ALT activity, which is an indicator of liver injury, was elevated in all ethanol-fed groups (p < 0.05). Serum FFA level and AST activity showed no significant differences among all groups. Adiponectin and leptin concentrations in the serum were also not altered in the EtOH group compared to the Ctrl group. However, the EtOH/NS group showed a significantly higher adiponectin level (p < 0.001) and a significantly lower leptin level (p < 0.01) than other groups. Ethanol feeding remarkably increased serum ethanol concentration (p < 0.0001), which was not influenced by dietary NA levels.
Table 1. Body weight, liver weight, and blood parameters of rats after 8 weeks of liquid diet feeding.
| Ctrl | EtOH | EtOH/ND | EtOH/NS | |
|---|---|---|---|---|
| Body weight (g) | 398.71 ± 28.75 | 399.22 ± 22.51 | 408.42 ± 14.29 | 377.62 ± 26.94 |
| Liver weight (g) | 11.02 ± 1.15a | 12.72 ± 1.08b | 13.27 ± 1.24b | 13.84 ± 1.37b |
| Blood glucose (mg/dL) | 95.50 ± 14.82a | 73.83 ± 10.26ab | 89.50 ± 16.74ab | 67.38 ± 21.10b |
| Serum β-hydroxybutyrate (mM) | 0.26 ± 0.05a | 1.42 ± 0.41b | 1.37 ± 0.59b | 2.10 ± 0.49c |
| Serum TG (mg/dL) | 153.57 ± 20.06a | 96.81 ± 13.24 b | 107.34 ± 21.04 b | 114.20 ± 21.46b |
| Serum FFA (mM) | 0.58 ± 0.12 | 0.57 ± 0.23 | 0.54 ± 0.13 | 0.93 ± 0.83 |
| Serum cholesterol (mg/dL) | 63.38 ± 4.13a | 79.66 ± 7.94b | 80.81 ± 13.89b | 68.52 ± 14.96ab |
| Serum ALT (U/L) | 25.02 ± 3.73a | 54.88 ± 37.39b | 62.52 ± 31.32b | 68.20 ± 22.16b |
| Serum AST (U/L) | 38.12 ± 6.38 | 58.81 ± 40.08 | 73.38 ± 43.11 | 54.83 ± 11.45 |
| Serum adiponectin (μg/mL) | 35.66 ± 5.02a | 40.86 ± 7.69ab | 54.21 ± 7.61b | 86.82 ± 23.82c |
| Serum leptin (ng/mL) | 4.40 ± 1.36a | 4.76 ± 1.73a | 4.74 ± 1.38a | 1.97 ± 1.00b |
| Serum ethanol (mM) | 0.79 ± 0.65a | 40.91 ± 11.16b | 50.43 ± 10.91b | 42.54 ±7.09b |
Rats were pair-fed control or ethanol liquid diets for 8 weeks. Data are means ± SD of 6-8 rats. Means without a common letter differ at p<0.05, absence of a symbol indicates no significant difference. Ctrl, control group; EtOH, ethanol group; EtOH/ND, ethanol with dietary nicotinic acid deficiency group; EtOH/NS, ethanol with dietary nicotinic acid supplementation group.
Dietary nicotinic acid supplementation attenuates ethanol-induced hepatic lipid accumulation
Oil red O staining demonstrated that there was significant lipid droplet accumulation in the liver of EtOH and EtOH/ND groups, while the number and size of lipid droplets were reduced in the livers of EtOH/NS group (Fig.1A). Quantitative measurements of hepatic lipid contents showed that chronic ethanol feeding significantly increased hepatic triglyceride (p < 0.001), free fatty acid (p < 0.05) and cholesterol (p < 0.01) concentrations compared to the Ctrl group. Dietary NA deficiency did not further increase ethanol-induced hepatic triglyceride, free fatty acid and cholesterol accumulation. Dietary NA supplementation attenuated ethanol-increased hepatic triglyceride level (p < 0.05), but not free fatty acid and cholesterol level (Fig.1B).
Figure 1.
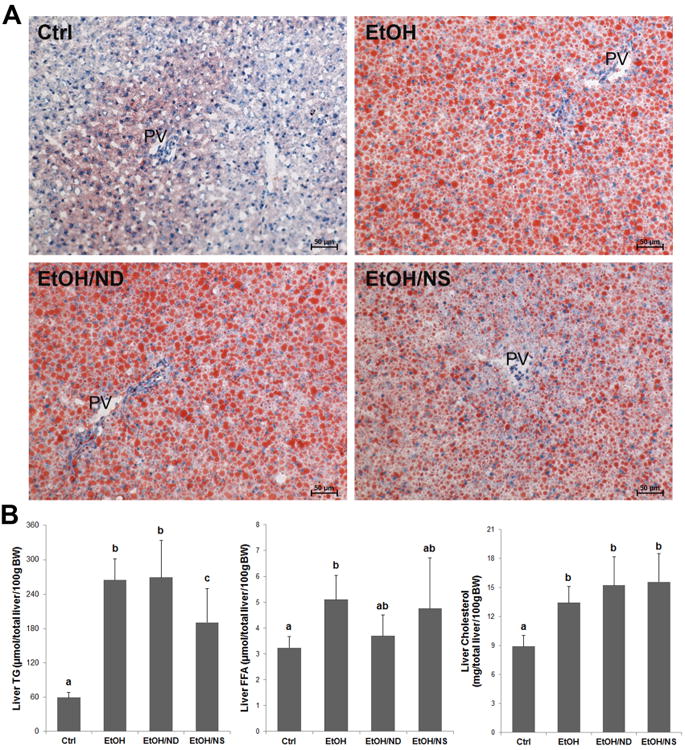
Dietary nicotinic acid supplementation ameliorates alcohol-induced hepatic lipid accumulation in rats. (A) Oil red O staining of the neutral lipids in the liver of Ctrl, EtOH, EtOH/ND, and EtOH/NS rats. Lipid droplets are stained with red color. (B) Quantitative measurements of hepatic concentrations of triglycerides, free fatty acids, and cholesterol. Data are expressed as mean ± SD from 6-8 rats. Statistical differences were analyzed by ANOVA followed by Student-Newman-Keuls test. Means without a common letter differ at p < 0.05, and the absence of a symbol indicates no significant difference. BW, body weight; Ctrl, control group; EtOH, ethanol group; EtOH/ND, ethanol with dietary nicotinic acid deficiency group; EtOH/NS, ethanol with dietary nicotinic acid supplementation group.
Hepatic NAD+ and NADH levels in rats after 8 weeks of liquid diet feeding
The concentrations of total NAD, NAD+, and NADH as well as NAD+/NADH ratio in the liver are shown in Figure 2. Hepatic total NAD and NAD+ levels in both EtOH and EtOH/ND groups were significantly lower than that of the Ctrl group (p < 0.05). Dietary NA supplementation to ethanol-fed rats remarkably increased hepatic total NAD (p < 0.01) and hepatic NAD+ (p < 0.01). Moreover, liver NADH level in EtOH/NS group was remarkably higher than all other groups (p < 0.001). The NAD+/NADH ratio was decreased in all the three ethanol groups compared to the Ctrl group (p < 0.001). For these four indicators, no significant difference was observed between the EtOH and EtOH/ND groups
Figure 2.
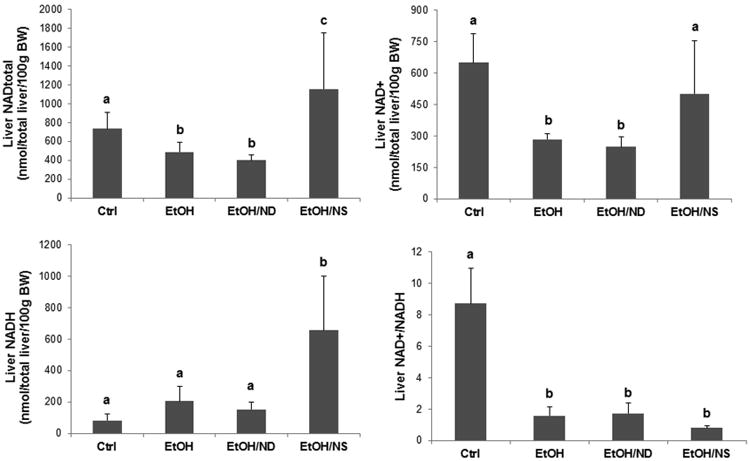
Hepatic NAD levels in rats after 8 weeks of liquid diet feeding. Liver total NAD, NAD+, and NADH concentrations as well as the NAD+/NADH ratio in the Ctrl, EtOH, EtOH/ND, and EtOH/NS rats were measured. Data are expressed as the mean ± SD from 6-8 rats. Means without a common letter differ at p < 0.05. BW, body weight; Ctrl, control group; EtOH, ethanol group; EtOH/ND, ethanol with dietary nicotinic acid deficiency group; EtOH/NS, ethanol with dietary nicotinic acid supplementation group.
Alterations of liver and serum metabolites in rats after 8 weeks of liquid diet feeding
A total of 221 metabolites in liver samples and 168 metabolites in serum samples were identified by HPLC-TOFMS. The score plots of OPLS-DA analysis of metabolites showed clearly separated clusters of the Ctrl, EtOH, and EtOH/NS groups for both liver and serum; however, the clusters of EtOH and EtOH/ND groups were very close (Fig. 3).
Figure 3.
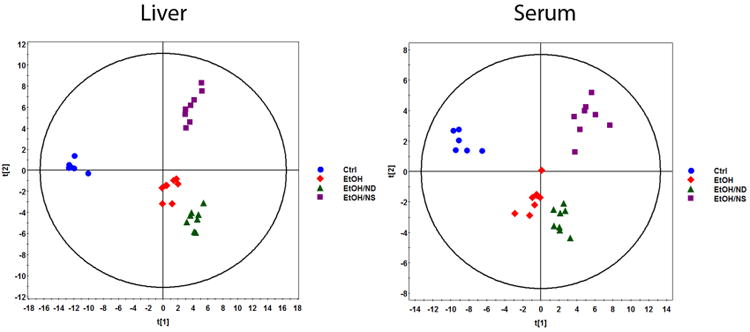
OPLS-DA score plots of spectral data of liver and serum metabolites in rats after 8 weeks of liquid diet feeding. Metabolite profiles of liver tissue homogenates and serum were analyzed by HPLC-TOFMS. The ES+ and ES- raw data generated from HPLC-TOFMS were analyzed using the MassHunter Qualitative Analysis Program (vB.05.01, Agilent). The resulting data were then subjected to OPLS-DA to establish characteristic metabolomic profiles associated with different groups. (A) OPLS-DA score plots of liver metabolites. (B) OPLS-DA score plots of serum metabolites. Ctrl, control group; EtOH, ethanol group; EtOH/ND, ethanol with dietary nicotinic acid deficiency group; EtOH/NS, ethanol with dietary nicotinic acid supplementation group.
A list of 30 liver metabolites which were significantly different between the EtOH/NS and EtOH groups (p < 0.05) is shown in Table 2. Hepatic levels of 16 metabolites were increased, while 14 were decreased, by dietary NA supplementation. NA supplementation remarkably increased the hepatic level of NA (∼12.89-fold) as well as its metabolites nicotinamide, nicotinamide riboside, and N-methylnicotinamide. NA supplementation increased amino acids and peptide metabolites (S-acetyl dihydrolipoamide and S-nitrosoglutathione), and nucleoside molecules and analogues (cytidine, adenosine monophosphate, ethenodeoxyadenosine, and 7,8-dihydroneopterin). NA also increased organic acids and lipid metabolites, including 3-pyridylacetic acid, deoxycholic acid, ureidosuccinic acid, 3-oxohexadecanoic acid, Lyso PC (16:1(9Z)), and palmitoleic acid. The decreased liver metabolites included several organic acids, such as maleic acid, α-ketoglutaric acid, pyruvic acid, malic acid, adrenic acid, and LPA (0:0/18:2(9Z;12Z)). Phenylacetylglycine, a fatty acid metabolite, was significantly increased by ethanol feeding (2.058-fold), but decreased by NA supplementation (0.466-fold).
Table 2. Liver metabolites.
| Compounds | EtOH vs.Ctrl | EtOH/ND vs.EtOH | EtOH/NS vs.EtOH | |||
|---|---|---|---|---|---|---|
| FCa | pb | FCa | pb | FCa | pb | |
| Nicotinic acid | 1.198 | 0.543 | 1.271 | 0.284 | 12.89 | 0.023 |
| Nicotinamide | 1.155 | 0.476 | 0.863 | 0.51 | 1.94 | 0.006 |
| Nicotinamide ribotide | 1.822 | 0.122 | 0.429 | 0.047 | 3.519 | 0.013 |
| N-Methylnicotinamide | 0.57 | 0.07 | 1.181 | 0.153 | 3.24 | 1E-04 |
| 3-Pyridylacetic acid | 1.159 | 0.213 | 1.293 | 0.166 | 4.748 | 0.038 |
| S-Acetyldihydrolipoamide | 1.241 | 0.1 | 1.156 | 0.324 | 1.35 | 0.023 |
| S-Nitrosoglutathione | 2.032 | 0.003 | 0.831 | 0.191 | 5.824 | 0.019 |
| Cytidine | 0.797 | 0.246 | 0.88 | 0.119 | 1.429 | 0.044 |
| Adenosine monophosphate | 2.133 | 7E-05 | 0.956 | 0.654 | 1.409 | 0.001 |
| Ethenodeoxyadenosine | 1.405 | 0.079 | 0.872 | 0.408 | 2.535 | 0.003 |
| 7,8-Dihydroneopterin | 1.634 | 0.01 | 0.83 | 0.244 | 2.3 | 0.006 |
| Deoxycholic acid | 0.973 | 0.936 | 1.692 | 0.178 | 2.048 | 0.026 |
| Ureidosuccinic acid | 2.383 | 0.155 | 1.397 | 0.323 | 2.55 | 0.006 |
| 3-Oxohexadecanoic acid | 0.437 | 0.032 | 1.922 | 0.028 | 1.741 | 0.029 |
| LysoPC(16:1(9Z)) | 0.254 | 0.046 | 3.644 | 0.012 | 9.289 | 6E-07 |
| Palmitoleic acid | 0.397 | 0.091 | 4.807 | 0.002 | 10.16 | 1E-05 |
| Methylcysteine | 1.239 | 0.137 | 1.097 | 0.322 | 0.573 | 4E-04 |
| Creatinine | 0.846 | 0.144 | 1.086 | 0.435 | 0.788 | 0.01 |
| Phenylacetylglycine | 2.058 | 0.015 | 0.796 | 0.247 | 0.466 | 0.008 |
| 5-Methoxytryptophol | 0.841 | 0.435 | 0.656 | 0.041 | 0.591 | 0.018 |
| S-Glutaryldihydrolipoamide | 1.412 | 0.007 | 0.964 | 0.777 | 0.758 | 0.03 |
| Pseudouridine | 0.98 | 0.81 | 0.937 | 0.468 | 0.836 | 0.034 |
| Maleic acid | 1.189 | 0.242 | 1.024 | 0.816 | 0.536 | 6E-04 |
| α-Ketoglutaric acid | 1.101 | 0.547 | 0.819 | 0.411 | 0.576 | 0.043 |
| Pyruvic acid | 0.431 | 0.009 | 0.582 | 0.114 | 0.436 | 0.041 |
| Malic acid | 1.251 | 0.124 | 1.094 | 0.342 | 0.555 | 3E-04 |
| Sebacic acid | 0.947 | 0.816 | 0.663 | 0.031 | 0.689 | 0.048 |
| Gamma-CEHC | 1.092 | 0.529 | 1.075 | 0.601 | 0.559 | 0.001 |
| Adrenic acid | 1.12 | 0.742 | 1.322 | 0.357 | 0.214 | 0.009 |
| LPA(0:0/18:2(9Z;12Z)) | 5.35 | 1E-06 | 1.207 | 0.187 | 0.803 | 0.047 |
Fold change (FC) was obtained by comparing the concentrations of liver metabolites between groups.
p values from Student's t-test between groups to determine the significance difference of each metabolite. Ctrl, control group; EtOH, ethanol group; EtOH/ND, ethanol with dietary nicotinic acid deficiency group; EtOH/NS, ethanol with dietary nicotinic acid supplementation group.
A list of 18 serum metabolites which were significantly different between the EtOH/NS and EtOH groups (p < 0.05) is shown in Table 3. Dietary NA supplementation significantly increased the serum levels of 14 metabolites, and decreased 4 metabolites. NA supplementation increased serum NA and nicotinamide levels, and several organic acids, including 3-pyridylacetic acid, γ-aminobutyric acid, pipecolic acid, 3-hydroxyglutaric acid, and 5-hydroxyhexanoic acid. The serum metabolites with reduced levels were 4-hydroxyproline, dihydrothymine, 1,7-dimethylguanosine, and creatine.
Table 3. Serum metabolites.
| Compounds | EtOH vs.Ctrl | EtOH/ND vs.EtOH | EtOH/NS vs.EtOH | |||
|---|---|---|---|---|---|---|
| FCa | pb | FCa | pb | FCa | pb | |
| Nicotinic acid | 0.798 | 0.259 | 0.941 | 0.761 | 424.7 | 0.035 |
| Nicotinamide | 1.002 | 0.993 | 0.578 | 0.124 | 21.3 | 7E-04 |
| 3-Pyridylacetic acid | 1.386 | 0.145 | 0.976 | 0.896 | 3.647 | 0.009 |
| γ-Aminobutyric acid | 1.736 | 6E-04 | 1.267 | 0.063 | 1.889 | 0.019 |
| N-Acetylornithine | 6.692 | 0.007 | 1.025 | 0.918 | 1.76 | 0.013 |
| Uridine | 0.88 | 0.024 | 1.066 | 0.28 | 1.344 | 1E-04 |
| Pipecolic acid | 1.472 | 0.059 | 0.947 | 0.74 | 1.709 | 0.009 |
| 2,3,4-Trihydroxybutyric acid | 1.075 | 0.415 | 1.008 | 0.918 | 1.209 | 0.02 |
| N-Acetylneuraminic acid | 0.843 | 0.216 | 1.024 | 0.718 | 1.254 | 0.034 |
| Methylmalonic acid | 1.197 | 0.076 | 1.257 | 0.168 | 1.301 | 0.01 |
| 3-Hydroxyglutaric acid | 1.546 | 0.003 | 1.285 | 0.037 | 1.433 | 0.023 |
| 5-Hydroxyhexanoic acid | 1.038 | 0.727 | 1.092 | 0.393 | 1.372 | 0.032 |
| LysoPC(16:1(9Z)) | 0.662 | 0.331 | 2.857 | 0.017 | 4.739 | 0.004 |
| LysoPC(18:3(9Z;12Z;15Z)) | 1.434 | 0.447 | 1.865 | 0.027 | 1.573 | 0.037 |
| 4-Hydroxy-proline | 0.701 | 0.03 | 1.003 | 0.985 | 0.521 | 0.018 |
| Dihydrothymine | 0.701 | 0.077 | 0.871 | 0.418 | 0.533 | 0.009 |
| 1,7-Dimethylguanosine | 0.608 | 0.005 | 1.153 | 0.225 | 0.67 | 0.024 |
| Creatine | 0.603 | 0.005 | 1.177 | 0.201 | 0.63 | 0.017 |
Fold change (FC) was obtained by comparing the concentrations of serum metabolites between groups.
p values from Student's t-test between groups to determine the significance difference of each metabolite. Ctrl, control group; EtOH, ethanol group; EtOH/ND, ethanol with dietary nicotinic acid deficiency group; EtOH/NS, ethanol with dietary nicotinic acid supplementation group.
Dietary nicotinic acid supplementation does not affect ethanol metabolism in chronic ethanol-fed rats
To explore whether dietary NA could influence ethanol metabolism, serum ethanol concentration and liver ethanol metabolism enzyme levels were measured. As shown in Table 1, remarkably higher concentrations of ethanol were found in all the ethanol-fed groups, and there were no differences among these groups. For the ethanol metabolism enzymes, ethanol feeding, regardless of dietary NA levels, increased hepatic CYP2E1 protein level (p < 0.001), but did not affect ADH, catalase, or ALDH2 protein levels (Fig. 4).
Figure 4.
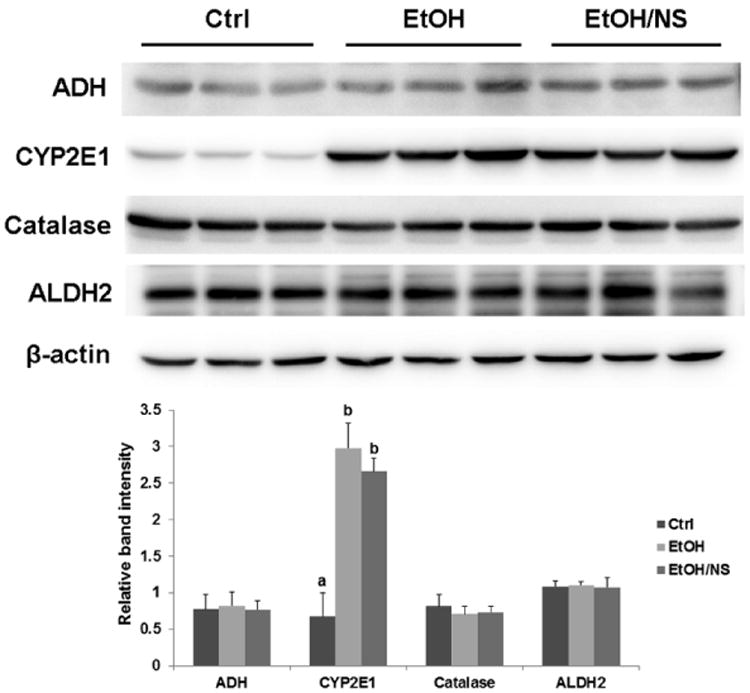
Dietary nicotinic acid supplementation does not affect ethanol metabolism enzymes in chronic ethanol-fed rats. Representative immunoblots showing hepatic ADH, CYP2E1, catalase, and ALDH2 protein levels in Ctrl, EtOH, and EtOH/NS groups are presented with quantification of the band intensities. Data are expressed as the mean ± SD from 6 rats. Means without a common letter differ at p < 0.05, and absence of a symbol indicates no significant difference. Ctrl, control group; EtOH, ethanol group; EtOH/NS, ethanol with dietary nicotinic acid supplementation group.
Dietary nicotinic acid supplementation improves hepatic lipid metabolism in chronic ethanol-fed rats
To determine the mechanisms of how NA improves ethanol-induced hepatic lipid dyshomeostasis, protein levels of enzymes involved in lipid metabolism were measured. Figure 5A shows protein levels of 4 enzymes related to mitochondrial fatty acid β-oxidation (CPT1A and ACADL), peroxisomal fatty acid β-oxidation (ACOX1), and endoplasmic reticulum fatty acid ω-oxidation (CYP4A1). Ethanol feeding increased ACADL (p < 0.01), ACOX1 (p < 0.01), and CYP4A1 (p < 0.05) levels, and dietary NA supplementation to ethanol-fed rats further increased ACOX1 (p < 0.01) and CYP4A1 (p < 0.001) levels, particularly the latter. There were no differences in protein levels of CPT1A and PMP70 (a peroxisomal membrane marker) among the Ctrl, EtOH, and EtOH/NS groups. Figure 5B shows the expression levels of proteins related to fatty acid synthesis (FAS and ACC) and triglyceride synthesis (LIPIN1, DGAT1, and DGAT2). FAS protein level was reduced in both EtOH (p < 0.05) and EtOH/NS (p < 0.05) groups with a much lower value in the latter. A reduction of ACC protein level was observed in the EtOH/NS group (p < 0.05). In addition, DGAT2 protein level was increased in both EtOH (p < 0.05) and EtOH/NS (p < 0.05) groups, and LIPIN1 and DGAT1 protein levels showed no differences among all of the groups.
Figure 5.
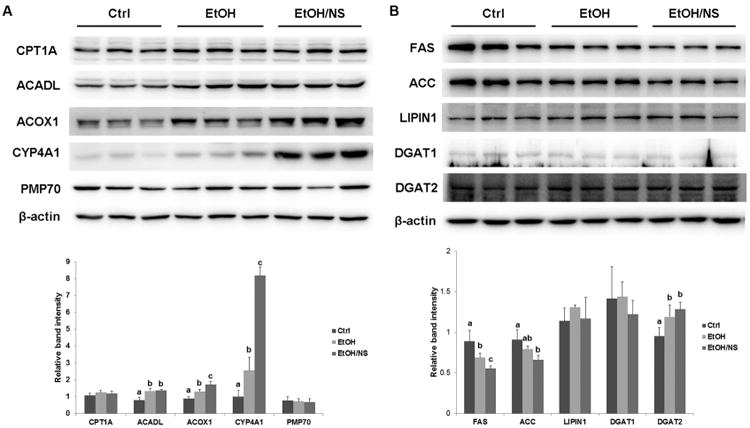
Dietary nicotinic acid supplementation improves hepatic lipid metabolism in chronic ethanol-fed rats. (A) Representative immunoblots showing hepatic proteins related to fatty acid oxidation in Ctrl, EtOH, and EtOH/NS groups are presented with quantification of the band intensities. (B) Representative immunoblots showing hepatic proteins related to fatty acid and triglyceride synthesis are presented with quantification of the band intensities. Data are expressed as the mean ± SD from 6 rats. Means without a common letter differ at p < 0.05, and absence of a symbol indicates no significant difference. Ctrl, control group; EtOH, ethanol group; EtOH/NS, ethanol with dietary nicotinic acid supplementation group.
Dietary nicotinic acid supplementation does not affect the PPARα pathway, but does reduce CYP4A1 ubiquitination in the liver of chronic ethanol-fed rats
To determine the mechanisms of how NA up-regulates hepatic CYP4A1 and ACOX1 protein levels, transcription factors/cofactors related to the PPARα pathway were measured. As shown in Figure 6A, the protein levels of PPARα and RXRα were not affected, while PGC1α level was significantly increased by ethanol feeding (p < 0.05). No difference was found between the EtOH/NS and EtOH groups. The mRNA levels of CYP4A1 and ACOX1, which are target genes of PPARα activation, were also measured. Chronic ethanol feeding significantly increased the hepatic mRNA levels of CYP4A1 (p < 0.01) and ACOX1 (p < 0.01), which were not affected by dietary NA supplementation (Fig. 6B). To explore how NA increased the protein level of CYP4A1 without affecting its mRNA level, CYP4A1 ubiquitination was assessed after immunoprecipitation of CYP4A1. As shown in Figure 6C, ethanol feeding reduced the ubiquitination level of CYP4A1 (p < 0.05) in the liver, which was further decreased by dietary NA supplementation (p < 0.01).
Figure 6.
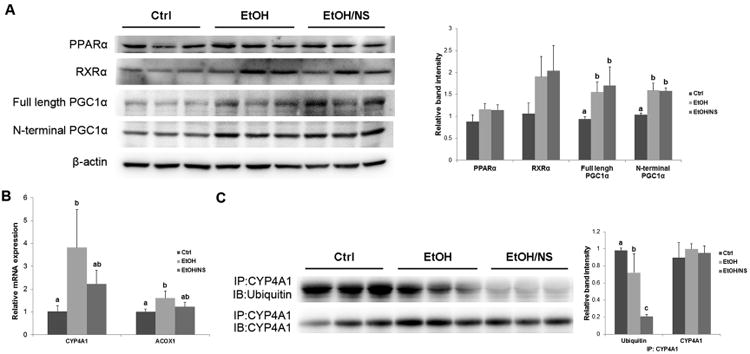
Dietary nicotinic acid supplementation does not affect the PPARα pathway, but does reduce the ubiquitination of CYP4A1 in the liver of chronic ethanol-fed rats. (A) Representative immunoblots showing hepatic protein levels of transcription factors/cofactors related to the PPARα pathway in Ctrl, EtOH, and EtOH/NS groups are presented with quantification of band intensities. (B) The mRNA levels of CYP4A1 and ACOX1 in the liver of Ctrl, EtOH, and EtOH/NS rats. (C) Ubiquitination levels of CYP4A1 in the liver of Ctrl, EtOH, and EtOH/NS rats. Hepatic CYP4A1 was immunoprecipitated and then subjected to Western blot using a rabbit polyclonal anti-ubiquitin antibody. Data are expressed as the mean ± SD from 6 rats. Means without a common letter differ at p < 0.05, and absence of a symbol indicates no significant difference. Ctrl, control group; EtOH, ethanol group; EtOH/NS, ethanol with dietary nicotinic acid supplementation group.
Discussion
NA and nicotinamide, which function as vitamin B3, are biosynthetically converted to NAD+ in the body. NAD+ is traditionally known as a coenzyme for hydride transfer enzymes, which is essential for a variety of energy-producing catabolic reactions, such as the degradation of carbohydrates, fats, proteins, and alcohol (Sauve, 2008). Mammalian NAD+ biosynthesis is achieved through either the salvage pathway from NA and nicotinamide or de novo pathway from L-tryptophan (Bogan and Brenner, 2008). Thus, dietary L-tryptophan can be classified as a niacin equivalent. In addition, the liver can also synthesize niacin from L-tryptophan (Bogan and Brenner, 2008). In the present study, we found that dietary NA supplementation remarkably increased the levels of NA and its metabolites in both the liver and serum of rats. The dose of NA used was approximately 150 mg/kg body weight. Hepatic total NAD, NAD+, and NADH levels were also increased in the rats of the EtOH/NS group. However, both NA and hepatic NAD levels showed no significant differences between EtOH and EtOH/ND rats, which indicated the possible existence of L-tryptophan in the diet of the EtOH/ND group. Accordingly, dietary NA deficiency did not further increase liver lipid accumulation. In fact, previous studies have found that a niacin deficiency cannot be induced merely by removing NA and nicotinamide from a complete diet (Terakata et al., 2012). Thus, these results demonstrate that there were no differences in the niacin nutritional status between EtOH and EtOH/ND rats. We then used Ctrl, EtOH, and EtOH/NS groups to explore the effects and mechanisms of dietary NA supplementation.
Oxidation of alcohol causes an increase of NADH and decrease of NAD+ in the liver. This redox state alteration has been implicated in the disruption of many NADH-producing reactions in the cytoplasm and mitochondria, including the β-hydroxyacyl CoA dehydrogenase reaction in mitochondrial fatty acid β-oxidation as well as isocitrate dehydrogenase and α-ketoglutarate dehydrogenase reactions in the citric acid cycle, all of which use NAD+ as a coenzyme (Purohit et al., 2009; Baraona and Lieber, 1979). In this manner, fatty acid oxidation via mitochondrial β-oxidation and the citric acid cycle is inhibited, and ketogenesis is induced, thus leading to alcoholic fatty liver (Ryle, 1986; French, 1989). In the present study, chronic ethanol feeding induced hepatic triglyceride accumulation accompanied with a decreased NAD+/NADH ratio. However, dietary NA supplementation significantly ameliorated the ethanol-induced increase in triglycerides. Hepatic NAD+ and NADH levels in EtOH/NS rats were remarkably enhanced compared to EtOH rats. Higher NAD+ levels indicated greater NAD+ coenzyme availability, while higher NADH levels may reflect more complete NADH-producing reactions and inadequate oxidation of NADH via the respiratory chain. Since ethanol metabolism was not affected by dietary NA supplementation, these results suggest that greater mitochondrial fatty acid β-oxidation and a more active citric acid cycle occurred in rats of the EtOH/NS group than those from the EtOH group. Furthermore, previous studies have demonstrated that elevated levels of phenylacetylglycine in body fluids, which is a type of fatty acid metabolite, may indicate impairment of mitochondrial fatty acid β-oxidation (Zhang et al., 2012). Our metabolomics analysis showed that phenylacetylglycine levels in the liver were increased after ethanol exposure and decreased in rats from the EtOH/NS group. In addition, increased serum β-hydroxybutyrate concentrations in the EtOH/NS rats may also indicate more mitochondrial fatty acid β-oxidation than EtOH rats. Since fatty acids undergo either oxidation or lipid synthesis, including triglyceride and cholesterol esters in the liver, increasing fatty acid oxidation could reduce triglyceride production. However, dietary NA supplementation was unable to correct the ethanol-induced decrease in the NAD+/NADH ratio, which means the possible consequences of this redox state change for hepatic lipid disposal could still exist in the EtOH/NS group (Lieber, 2000; French, 1989). When NAD+ was biosynthesized from dietary NA, it would be reduced to NADH in order to oxidize more fatty acid, until the new NAD+/NADH ratio formed. Thus, both the NAD+ and NADH levels in EtOH/NS rats were remarkably enhanced, but their NAD+/NADH ratio was the same as the EtOH group. Moreover, the oxidation of NADH within the mitochondria is dependent on oxygen uptake which means there would be a limit of NAD+ and NADH increase (French, 1989). Taken together, these results demonstrate that dietary NA supplementation to ethanol-fed rats can, to some extent, increase hepatic mitochondrial fatty acid β-oxidation by increasing the NAD+ concentration, which may contribute to reduced triglyceride accumulation in the liver.
Alcohol exposure impairs mitochondrial fatty acid β-oxidation. However, inhibition of mitochondrial oxidation can result in enhanced oxidation of fatty acids by extra-mitochondrial pathways, particularly ω-oxidation in the endoplasmic reticulum (Ma et al., 1993; Ronis et al., 2004). Fatty acid ω-oxidation is catalyzed mainly by cytochromes P450 4A subfamily, producing water soluble dicarboxylic acid (Wanders et al., 2011). The resulting dicarboxylic acid can then be shortened through the peroxisomal β-oxidation pathway, with ACOX1 being the main enzyme (Ferdinandusse et al., 2004). Our results showed that ethanol feeding up-regulates ACADL, ACOX1, and CYP4A1 protein expression in the liver. The increased CYP4A1 and ACOX1 levels suggest an enhancement of fatty acid ω-oxidation and subsequent peroxisomal β-oxidation after chronic ethanol exposure, while enhanced ACADL levels indicate an adaptive response. Dietary NA supplementation to ethanol-fed rats further increased CYP4A1 and ACOX1 levels, indicating that EtOH/NS rats had greater fatty acid ω-oxidation and peroxisomal β-oxidation than EtOH rats, which may contribute to the improvements of the fatty liver. Significantly increased levels of serum 5-hydroxyhexanoic acid, which is one type of hydroxylation products of fatty acid ω-oxidation (Kamerling et al., 1982), in EtOH/NS rats, also suggest that fatty acid ω-oxidation may be increased to some extent. However, there were no differences in liver PMP70 expression, which excluded the possibility of peroxisome proliferation in EtOH/NS rats. These results demonstrate that dietary NA supplementation to ethanol-fed rats can increase hepatic fatty acid ω-oxidation and peroxisomal β-oxidation, which may contribute to the reduced triglyceride accumulation in the liver.
Both CYP4A1 and ACOX1 are target genes of transcription factor PPARα, and RXRα and PGC1α are cofactors of PPARα activation (Nanji et al., 2004; Aldridge et al., 1995). We found that chronic ethanol treatment increased PGC1α expression without affecting PPARα and RXRα protein levels. Both CYP4A1 and ACOX1 mRNA levels were increased after ethanol feeding. However, dietary NA supplementation did not regulate hepatic PPARα, RXRα, or PGC1α protein levels in chronic ethanol-fed rats. The mRNA levels of CYP4A1 and ACOX1 were not significantly different between the EtOH/NS and EtOH groups, indicating that dietary NA may modulate CYP4A1 and ACOX1 levels though post-transcriptional regulation. In fact, we also found that the ubiquitination levels of CYP4A1 in the liver of EtOH/NS rats were significantly lower than EtOH rats. As ubiquitin-proteasome pathway may be a highly effective degradation pathway for cytochrome P450 enzymes (Lee et al., 2008), and therefore we postulate that dietary NA supplementation to ethanol-fed rats increases hepatic CYP4A1 protein levels, likely by preventing or decreasing degradation.
Adiponectin, an adipose-derived hormone, has emerged as an important regulator for alcoholic fatty liver in recent years. Adiponectin protects against alcoholic liver steatosis through multiple signaling pathways mediated by SIRT1-AMPK-SREBP-1c, PGC-1α/PPARα, and CD36 pathways, which leads to reduced lipogenesis, enhanced fat oxidation, and prevention of hepatic lipid accumulation (You and Rogers, 2009; Shen et al., 2010). NA treatment has been shown to increase circulating concentrations of adiponectin, which occurs due to GPR109A receptor activation and a subsequent increase in adiponectin secretion by adipocytes (Plaisance et al., 2009). In the present study, EtOH/NS rats had significantly higher serum adiponectin concentrations than all other groups. Hepatic expression of FAS, which is the target gene of SREBP-1c and a critical enzyme in fatty acid de novo lipogenesis, was significantly lower in rats of the EtOH/NS group compared to those in the EtOH group. These results indicate that dietary NA supplementation to ethanol-fed rats may decrease hepatic fatty acid de novo lipogenesis, possibly by stimulating adiponectin secretion.
Metabolomics data in the present study also reflect the effect of dietary NA. OPLS-DA analysis yielded good separation of the data sets obtained from the Ctrl, EtOH, and EtOH/NS groups in both liver and serum. However, the EtOH and EtOH/ND groups were very similar due to the alternative pathway of niacin production in the EtOH/ND rats (Bogan and Brenner, 2008). NA and several of its metabolites were remarkably elevated in EtOH/NS rats. In addition, 3-pyridylacetic acid, which is an analog of nicotinic acid (Ginoulhiac et al., 1962), was also increased in both liver and serum of rats from the EtOH/NS group. Dietary NA supplementation to ethanol-fed rats increased several nucleoside molecules in the liver, including cytidine, adenosine monophosphate, ethenodeoxyadenosine, and 7,8-dihydroneopterin, which was most likely due to the increase in NAD breakdown. Reduced phenylacetylglycine levels in the liver indicate elevated mitochondrial fatty acid β-oxidation (Zhang et al., 2012). Pyruvic acid, α-ketoglutaric acid, and malic acid, three intermediate metabolites in the citric acid cycle, were lower in rats from the EtOH/NS group compared to those from the EtOH group, most likely due to an increased NAD+ concentration and increased citric acid cycle activity after NA treatment. Increased 5-hydroxyhexanoic acid levels in the serum may also reflect increased fatty acid ω-oxidation in EtOH/NS rats (Kamerling et al., 1982).
Dietary NA may also improve alcoholic fatty liver via inhibiting DGAT2 activity. DGAT2, as well as DGAT1, are key enzymes catalyzing the final step of triglyceride biosynthesis (Hu et al., 2012). Previous studies suggested that upregulation of hepatic DGAT2 plays a critical role in the development of alcoholic fatty liver. Chronic alcohol consumption caused fatty liver and increased hepatic DGAT2 gene and protein expression in mice through suppressing MEK/ERK1/2 activation. Attenuation of DGAT2 upregulation by Betaine supplementation to alcohol-fed mice was associated with alleviated fatty liver and liver injury (Wang et al., 2010). Niacin was demonstrated to directly and noncompetitively inhibit the DGAT2 activity in HepG2 cell lines, with no effect on its mRNA level (Ganji et al., 2004). Moreover, recent animal and human studies also indicated that NA could inhibit hepatic DGAT2, which resulted in a decreased triglyceride synthesis and significantly improved hepatic steatosis (Hu et al., 2012; Le Bloc'h et al., 2010). Thus, these previous studies suggest that dietary NA may also improve alcoholic fatty liver via inhibiting DGAT2 activity.
In conclusion, the present study demonstrated that alcoholic fatty liver was not exaggerated by dietary NA deficiency, but was alleviated by dietary NA supplementation. Dietary NA supplementation increased hepatic NAD levels and CYP4A1 and ACOX1 proteins, but decreased hepatic FAS expression. These results demonstrate that dietary NA supplementation corrects ethanol-induced hepatic lipid dyshomeostasis by increasing hepatic fatty acid oxidation and decreasing hepatic de novo lipogenesis.
Acknowledgments
This research was supported by the National Institutes of Health (R01AA018844 and R01AA020212)
Abbreviations
- ACADL
Acyl-CoA dehydrogenase, long chain
- ACC
Acetyl-CoA carboxylase
- ACOX1
Acyl-coenzyme A oxidase 1
- ADH
Alcohol dehydrogenase
- ALDH2
Aldehyde dehydrogenase 2
- CPT1A
Carnitine palmitoyltransferase 1 A
- Ctrl
Control
- CYP4A1
Cytochrome P450 4A1
- DGAT1
Diacylglycerol acyltransferase 1
- DGAT2
Diacylglycerol acyltransferase 2
- EtOH
Ethanol
- EtOH/ND
Ethanol with dietary nicotinic acid deficiency
- EtOH/NS
Ethanol with dietary nicotinic acid supplementation
- NA
Nicotinic acid
- NAD+
Nicotinamide adenine dinucleotide
- PGC1α
Peroxisome proliferator-activated receptor gamma coactivator 1-alpha
- PMP70
70kDa Peroxisomal membrane protein
- RXRα
Retinoid X receptor alpha
References
- Aldridge TC, Tugwood JD, Green S. Identification and characterization of DNA elements implicated in the regulation of CYP4A1 transcription. Biochem J. 1995;306(Pt 2):473–479. doi: 10.1042/bj3060473. [DOI] [PMC free article] [PubMed] [Google Scholar]
- Baraona E, Lieber CS. Effects of ethanol on lipid metabolism. J Lipid Res. 1979;20:289–315. [PubMed] [Google Scholar]
- Bogan KL, Brenner C. Nicotinic acid, nicotinamide, and nicotinamide riboside: a molecular evaluation of NAD+ precursor vitamins in human nutrition. Annu Rev Nutr. 2008;28:115–130. doi: 10.1146/annurev.nutr.28.061807.155443. [DOI] [PubMed] [Google Scholar]
- Chen T, Xie G, Wang X, Fan J, Qiu Y, Zheng X, Qi X, Cao Y, Su M, Wang X, Xu LX, Yen Y, Liu P, Jia W. Serum and urine metabolite profiling reveals potential biomarkers of human hepatocellular carcinoma. Mol Cell Proteomics. 2011;10:M110 004945. doi: 10.1074/mcp.M110.004945. [DOI] [PMC free article] [PubMed] [Google Scholar]
- Dou X, Shen C, Wang Z, Li S, Zhang X, Song Z. Protection of nicotinic acid against oxidative stress-induced cell death in hepatocytes contributes to its beneficial effect on alcohol-induced liver injury in mice. J Nutr Biochem. 2013;24:1520–1528. doi: 10.1016/j.jnutbio.2012.12.012. [DOI] [PMC free article] [PubMed] [Google Scholar]
- Ferdinandusse S, Denis S, Van Roermund CW, Wanders RJ, Dacremont G. Identification of the peroxisomal beta-oxidation enzymes involved in the degradation of long-chain dicarboxylic acids. J Lipid Res. 2004;45:1104–1111. doi: 10.1194/jlr.M300512-JLR200. [DOI] [PubMed] [Google Scholar]
- French SW. Biochemical basis for alcohol-induced liver injury. Clin Biochem. 1989;22:41–49. doi: 10.1016/s0009-9120(89)80067-0. [DOI] [PubMed] [Google Scholar]
- Ganji SH, Tavintharan S, Zhu D, Xing Y, Kamanna VS, Kashyap ML. Niacin noncompetitively inhibits DGAT2 but not DGAT1 activity in HepG2 cells. J Lipid Res. 2004;45:1835–1845. doi: 10.1194/jlr.M300403-JLR200. [DOI] [PubMed] [Google Scholar]
- Ginoulhiac E, Tenconi LT, Chiancone FM. 3-Pyridineacetic acid and nicotinic acid: blood levels, urinary elimination and excretion of nicotinic acid derivatives in man. Nature. 1962;193:948–949. doi: 10.1038/193948a0. [DOI] [PubMed] [Google Scholar]
- Godin AM, Ferreira WC, Rocha LT, Ferreira RG, Paiva AL, Merlo LA, Nascimento EB, Jr, Bastos LF, Coelho MM. Nicotinic acid induces antinociceptive and anti-inflammatory effects in different experimental models. Pharmacol Biochem Behav. 2012;101:493–498. doi: 10.1016/j.pbb.2012.02.012. [DOI] [PubMed] [Google Scholar]
- Gyamfi MA, Wan YJ. Pathogenesis of alcoholic liver disease: the role of nuclear receptors. Exp Biol Med (Maywood) 2010;235:547–560. doi: 10.1258/ebm.2009.009249. [DOI] [PMC free article] [PubMed] [Google Scholar]
- Hu M, Chu WC, Yamashita S, Yeung DK, Shi L, Wang D, Masuda D, Yang Y, Tomlinson B. Liver fat reduction with niacin is influenced by DGAT-2 polymorphisms in hypertriglyceridemic patients. J Lipid Res. 2012;53:802–809. doi: 10.1194/jlr.P023614. [DOI] [PMC free article] [PubMed] [Google Scholar]
- Kamanna VS, Kashyap ML. Mechanism of action of niacin. Am J Cardiol. 2008;101:20B–26B. doi: 10.1016/j.amjcard.2008.02.029. [DOI] [PubMed] [Google Scholar]
- Kamerling JP, Duran M, Bruinvis L, Ketting D, Wadman SK, Vliegenthart JF. The absolute configuration of urinary 5-hydroxyhexanoic acid - a product of fatty acid (omega-1)-oxidation - in patients with non-ketotic dicarboxylic aciduria. Clin Chim Acta. 1982;125:247–254. doi: 10.1016/0009-8981(82)90254-6. [DOI] [PubMed] [Google Scholar]
- Karpe F, Frayn KN. The nicotinic acid receptor--a new mechanism for an old drug. Lancet. 2004;363:1892–1894. doi: 10.1016/S0140-6736(04)16359-9. [DOI] [PubMed] [Google Scholar]
- Lakshman MR. Some novel insights into the pathogenesis of alcoholic steatosis. Alcohol. 2004;34:45–48. doi: 10.1016/j.alcohol.2004.08.004. [DOI] [PubMed] [Google Scholar]
- Le Bloc'h J, Leray V, Chetiveaux M, Freuchet B, Magot T, Krempf M, Nguyen P, Ouguerram K. Nicotinic acid decreases apolipoprotein B100-containing lipoprotein levels by reducing hepatic very low density lipoprotein secretion through a possible diacylglycerol acyltransferase 2 inhibition in obese dogs. J Pharmacol Exp Ther. 2010;334:583–589. doi: 10.1124/jpet.110.167478. [DOI] [PubMed] [Google Scholar]
- Lee CM, Kim BY, Li L, Morgan ET. Nitric oxide-dependent proteasomal degradation of cytochrome P450 2B proteins. J Biol Chem. 2008;283:889–898. doi: 10.1074/jbc.M708821200. [DOI] [PMC free article] [PubMed] [Google Scholar]
- Lieber CS. ALCOHOL: its metabolism and interaction with nutrients. Annu Rev Nutr. 2000;20:395–430. doi: 10.1146/annurev.nutr.20.1.395. [DOI] [PubMed] [Google Scholar]
- Ma X, Baraona E, Lieber CS. Alcohol consumption enhances fatty acid omega-oxidation, with a greater increase in male than in female rats. Hepatology. 1993;18:1247–1253. [PubMed] [Google Scholar]
- Nagy LE. Molecular aspects of alcohol metabolism: transcription factors involved in early ethanol-induced liver injury. Annu Rev Nutr. 2004;24:55–78. doi: 10.1146/annurev.nutr.24.012003.132258. [DOI] [PubMed] [Google Scholar]
- Nanji AA, Dannenberg AJ, Jokelainen K, Bass NM. Alcoholic liver injury in the rat is associated with reduced expression of peroxisome proliferator-alpha (PPARalpha)-regulated genes and is ameliorated by PPARalpha activation. J Pharmacol Exp Ther. 2004;310:417–424. doi: 10.1124/jpet.103.064717. [DOI] [PubMed] [Google Scholar]
- Plaisance EP, Lukasova M, Offermanns S, Zhang Y, Cao G, Judd RL. Niacin stimulates adiponectin secretion through the GPR109A receptor. Am J Physiol Endocrinol Metab. 2009;296:E549–558. doi: 10.1152/ajpendo.91004.2008. [DOI] [PubMed] [Google Scholar]
- Purohit V, Gao B, Song BJ. Molecular mechanisms of alcoholic fatty liver. Alcohol Clin Exp Res. 2009;33:191–205. doi: 10.1111/j.1530-0277.2008.00827.x. [DOI] [PMC free article] [PubMed] [Google Scholar]
- Ronis MJ, Korourian S, Zipperman M, Hakkak R, Badger TM. Dietary saturated fat reduces alcoholic hepatotoxicity in rats by altering fatty acid metabolism and membrane composition. J Nutr. 2004;134:904–912. doi: 10.1093/jn/134.4.904. [DOI] [PubMed] [Google Scholar]
- Ryle PR. Hepatic redox state alterations as a mechanism of fatty liver production after ethanol: fact or fiction? Alcohol Alcohol. 1986;21:131–135. [PubMed] [Google Scholar]
- Sauve AA. NAD+ and vitamin B3: from metabolism to therapies. J Pharmacol Exp Ther. 2008;324:883–893. doi: 10.1124/jpet.107.120758. [DOI] [PubMed] [Google Scholar]
- Shen Z, Liang X, Rogers CQ, Rideout D, You M. Involvement of adiponectin-SIRT1-AMPK signaling in the protective action of rosiglitazone against alcoholic fatty liver in mice. Am J Physiol Gastrointest Liver Physiol. 2010;298:G364–374. doi: 10.1152/ajpgi.00456.2009. [DOI] [PMC free article] [PubMed] [Google Scholar]
- Sorensen TI, Orholm M, Bentsen KD, Hoybye G, Eghoje K, Christoffersen P. Prospective evaluation of alcohol abuse and alcoholic liver injury in men as predictors of development of cirrhosis. Lancet. 1984;2:241–244. doi: 10.1016/s0140-6736(84)90295-2. [DOI] [PubMed] [Google Scholar]
- Sozio M, Crabb DW. Alcohol and lipid metabolism. Am J Physiol Endocrinol Metab. 2008;295:E10–16. doi: 10.1152/ajpendo.00011.2008. [DOI] [PMC free article] [PubMed] [Google Scholar]
- Terakata M, Fukuwatari T, Sano M, Nakao N, Sasaki R, Fukuoka S, Shibata K. Establishment of true niacin deficiency in quinolinic acid phosphoribosyltransferase knockout mice. J Nutr. 2012;142:2148–2153. doi: 10.3945/jn.112.167569. [DOI] [PubMed] [Google Scholar]
- Vannucchi H, Moreno FS. Interaction of niacin and zinc metabolism in patients with alcoholic pellagra. Am J Clin Nutr. 1989;50:364–369. doi: 10.1093/ajcn/50.2.364. [DOI] [PubMed] [Google Scholar]
- Varella Morandi Junqueira-Franco M, Ernesto Troncon L, Garcia Chiarello P, do Rosario Del Lama Unamuno M, Afonso Jordao A, Vannucchi H. Intestinal permeability and oxidative stress in patients with alcoholic pellagra. Clin Nutr. 2006;25:977–983. doi: 10.1016/j.clnu.2006.03.010. [DOI] [PubMed] [Google Scholar]
- Wanders RJ, Komen J, Kemp S. Fatty acid omega-oxidation as a rescue pathway for fatty acid oxidation disorders in humans. FEBS J. 2011;278:182–194. doi: 10.1111/j.1742-4658.2010.07947.x. [DOI] [PubMed] [Google Scholar]
- Wang Z, Yao T, Song Z. Involvement and mechanism of DGAT2 upregulation in the pathogenesis of alcoholic fatty liver disease. J Lipid Res. 2010;51:3158–3165. doi: 10.1194/jlr.M007948. [DOI] [PMC free article] [PubMed] [Google Scholar]
- Xie G, Zhong W, Li H, Li Q, Qiu Y, Zheng X, Chen H, Zhao X, Zhang S, Zhou Z, Zeisel SH, Jia W. Alteration of bile acid metabolism in the rat induced by chronic ethanol consumption. FASEB J. 2013;27:3583–3593. doi: 10.1096/fj.13-231860. [DOI] [PMC free article] [PubMed] [Google Scholar]
- You M, Rogers CQ. Adiponectin: a key adipokine in alcoholic fatty liver. Exp Biol Med (Maywood) 2009;234:850–859. doi: 10.3181/0902-MR-61. [DOI] [PubMed] [Google Scholar]
- Zhang Y, Li F, Patterson AD, Wang Y, Krausz KW, Neale G, Thomas S, Nachagari D, Vogel P, Vore M, Gonzalez FJ, Schuetz JD. Abcb11 deficiency induces cholestasis coupled to impaired beta-fatty acid oxidation in mice. J Biol Chem. 2012;287:24784–24794. doi: 10.1074/jbc.M111.329318. [DOI] [PMC free article] [PubMed] [Google Scholar]
- Zhong W, Li Q, Xie G, Sun X, Tan X, Sun X, Jia W, Zhou Z. Dietary fat sources differentially modulate intestinal barrier and hepatic inflammation in alcohol-induced liver injury in rats. Am J Physiol Gastrointest Liver Physiol. 2013 doi: 10.1152/ajpgi.00226.2013. [DOI] [PMC free article] [PubMed] [Google Scholar]