Abstract
Pro-inflammatory cytokines play a vital role in the pathogenesis of alcoholic steatohepatitis. The present study was to determine the role of alcohol-induced oxidative stress in modulating cytokine production. A rat model of alcohol consumption was used to determine alcohol-induced hepatic cytokine expression. Chronic alcohol exposure caused lipid accumulation, oxidative stress, and inflammation in the livers of Wistar rats. The role of oxidative stress in regulating cell type-specific cytokine production was further dissected in vitro. Lipopolysaccharide (LPS) dose-dependently upregulated TNF-α, MIP-1α, MCP-1, and CINC-1 in Kupffer cells-SV40, whereas TNF-α dose-dependently induced CINC-1, IP-10, and MIP-2 expression in H4IIEC3 hepatoma cells. An addictive effect on cytokine production was observed in both Kupffer cells-SV40 and hepatocytes when combined hydrogen peroxide with LPS or TNF-α, respectively, which was associated with NF-κB activation and histone H3 hyper-acetylation. Unexpectedly, an inhibiting effect of 4-hydroxynonenal on cytokine production was revealed in LPS-treated Kupffer cells-SV40. Mechanistic study showed that 4-hydroxynonenal significantly enhanced mRNA degradation of TNF-α, MCP-1, and MIP-1α, and decreased the protein levels of MCP-1 in LPS-stimulated Kupffer cells-SV40 through reducing the phosphorylation of mRNA binding proteins. This study suggests that Kupffer cells and hepatocytes express distinct pro-inflammatory cytokines/chemokines in response to alcohol intoxication, and oxidative products (4-hydroxynonenal) differentially modulate pro-inflammatory cytokine/chemokine production via NF-κB signaling, histone acetylation, and mRNA stability.
Keywords: alcohol, Kupffer cells, hepatocytes, 4-HNE, cytokines, chemokines
1. Introduction
It is well documented that the progression of ALD is associated with imbalanced immune responses and increased production of pro-inflammatory cytokines/chemokines [1-3]. Chronic alcohol consumption increases tumor necrosis factor-α (TNF-α) production and leads to liver injury [4]. The expression of chemokines, including CXCL1, CXCL8, and CCL2, is also up-regulated both in patients with alcoholic hepatitis and in experimental models of ALD [5-7]. Moreover, increased hepatic cytokine/chemokine expression is associated with worse prognosis [8]. In a clinical study of patients with alcoholic hepatitis, the serum interleukin-8 (IL-8), TNF-α, and bilirubin levels correlated with the severity of liver damage over a 6-month hospitalization period [9].
Cytokines and chemokines are low molecular weight peptides that mediate the communication and recruitment of inflammatory cells and subsequent liver injury [1]. The production and release of cytokines/chemokines involve different types of cells in the liver. The consumption of alcohol increases the permeability of intestinal membrane and the portal concentration of blood endotoxin (lipopolysaccharide, LPS). The translocation of gut-derived endotoxins to the portal circulation and activation of Kupffer cells through the LPS/Toll-like receptor 4 pathway promote hepatic pro-inflammatory cytokine production including TNF-α [10]. This is able to activate other kinds of liver cells including hepatocytes to aggravate hepatic inflammation, which implies an interaction between Kupffer cells and other kinds of liver cells in pro-inflammatory cytokine/chemokine production [11]. Monocyte chemoattractant protein-1 (MCP-1; CCL2) was increased in Kupffer cells as well as in hepatocytes in alcohol-fed mice [5]. Our previous study showed that the expression of cytokine-induced neutrophil chemoattractant 1 (CINC-1), a rat homolog of human IL-8, was increased in hepatocytes upon stimulation of alcohol or TNF-α [6].
NF-κB is a key transcription factor in up-regulation of cytokine/chemokine genes in ALD [12]. Increasing evidence suggest that NF-κB-mediated gene transcription is critically regulated by epigenetic factors. An elevated level of histone acetylation facilitates the binding of transcription factors, including NF-κB, to nucleosomal DNA and the subsequent gene transcription [13]. Acute alcohol intoxication has been shown to induce histone hyper-acetylation in the liver via increasing the histone acetyltransferase activity [14]. Alcohol-exposed macrophages developed enhanced cytokine responses to lipopolysaccharide (LPS) in association with increased histone acetylation in macrophages [15]. Our previous study showed that inactivation of histone deacetylation enzymes as a result of zinc deficiency induced CINC-1 production in hepatocytes [6]. However, the role of epigenetic regulation of pro-inflammatory cytokine/chemokine production by different types of cells in the liver (Kupffer cells and hepatocytes) has not been fully elucidated in ALD.
Both Kupffer cells and hepatocytes generate reactive oxygen species (ROS) by different mechanisms after alcohol intake [16, 17]. Above a certain limit, ROS cannot be efficiently removed by antioxidant systems and consequently induce a further release of cytokines/chemokines. These complex cascades result in a vicious cycle during ALD progression [18]. Hydrogen peroxide (H2O2) is a stable ROS and an important signaling molecule in cell apoptosis [19], proliferation, and protein kinase activation [20-22]. Products of lipid peroxidations, such as 4-hydroxynonenal (4-HNE), is one of the most abundant and reactive aldehydic products in ALD. Although increases in both H2O2 and 4-HNE are critically involved in the development of ALD, it remains unclear if H2O2 and 4-HNE may serve as sensitizers to LPS- and/or TNF-α-induced pro-inflammatory cytokine/chemokine production. The present study was conducted to test this hypothesis. It also aimed at dissecting the contributions of Kupffer cells and hepatocytes to cytokine/chemokine production in ALD, respectively, and exploring the underlying epigenetic mechanism.
2. Materials and Methods
2.1. Animals and treatments
Male Wistar rats were obtained from Charles River Laboratories (Durham, NC). All rats were treated according to the protocol approved by the North Carolina Research Campus Animal Care and Use Committee (Protocol Number: 13-016). Eight-week-old rats were pair-fed the modified Lieber-DeCarli liquid diets containing ethanol (n=8) and isocaloric maltose dextrin as control (n=8) for 12 weeks with a stepwise feeding procedure as described previously [23]. The ethanol content (%, w/v) in the diet was 4.86% (34% of total calories) for the first 2 weeks, increased by 0.14% every 2 weeks, and reached to 5.56% (39% of total calories) for the last 2 weeks. The amount of food given to the control rats was that the ethanol consumption rats consumed in the previous day. All ingredients for the liquid diets were obtained from Dyets (Bethlehem, PA), except for ethanol (Sigma, St. Louis, MO). At the end of the experiment, the rats were anesthetized with isoflurane, and liver samples were harvested for assays.
2.2. Cell culture and treatments
Immortalized rat Kupffer cells-SV40 were obtained from Applied Biological Materials (Richmond, BC, Canada) and H4IIEC3 rat hepatoma cells were obtained from ATCC (Rockville, MD). The cells were maintained in Dulbecco's modified Eagle medium (Sigma) with 10% fetal bovine serum and 1% penicillin/streptomycin (Life Technologies, Carlsbad, CA) in a 37°C, 5% CO2 incubator. Kupffer cells were treated with 5 μmol/l 4-hydroxynonenal (4-HNE; Cayman Chemical, Ann Arbor, MI) or 100 μmol/l hydrogen peroxide (H2O2; Sigma) for 24 hr with or without 0.1, 0.5, 2.5 ng/ml lipopolysaccharide (LPS; Sigma) for another 2 hr. Hepatocytes were treated with 10 μmol/l 4-HNE or 100 μmol/l H2O2 for 24 hr followed by 25, 50, 100 pg/ml tumor nerosis factor-α (TNF-α) for another 2 hr. For mRNA stability assay, cells were treated with 5 μg/ml Actinomycin D (Sigma) after certain treatment for 1, 2 or 4 hr.
2.3. Histopathological analysis of liver
Liver tissues were fixed in 10% formalin, subjected to paraffin embedding, and then were cut at 5 μm for Hematoxylin and eosin (H&E) staining as described previously [23].
2.4. Immunoperoxidase procedure
Liver paraffin sections were prepared to detect neutrophils, CYP2E1, or 4-HNE in the liver. Antigen retrieval was performed by microwave the slides in 0.01 mol/l citrate buffer and the endogenous peroxidase was blocked by incubation with 3% H2O2 for 10 min. Tissue sections were incubated with rabbit anti-CYP2E1 (Abcam, Cambridge, MA), mouse anti-4-HNE (Northwest Life Science Specialties, Vancouver, WA), or rabbit anti-myeloperoxidase (LifeSpan BioSciences, Seattle, WA) antibody overnight at 4°C. After being rinsed with PBS, the sections were incubated with EnVision+ Labeled Polymer-horseradish peroxidase (HRP) anti-rabbit IgG, or anti-mouse IgG (DAKO, Carpinteria, CA) for 30 min. Visualization was conducted using 3,3′-diaminobenzidine as substrate. The nuclei were counterstained by methyl green (Vector Laboratories, Burlingame, CA).
2.5. qPCR
Total RNAs from liver or cells were extracted with TRIzol reagent (Life Technologies) followed the manufacturer's instruction. RNA concentration was quantified with nanodrop 2000 spectrophotometer (Thermo Scientific). Complementary DNAs were synthesized using the Taqman Reverse Transcription Reagent Kit (Applied Biosystems, Foster City, CA). qPCR was conducted using the SYBR green PCR Master Mix (Qiagen, Valencia, CA) on the 7500 Real Time PCR System (Applied Biosystems). The primer sequences for TNF-α, MCP-1, MIP-1α, CINC-1, IP-10, and MIP-2 (Table 1) were designed and synthesized by Integrated DNA Technologies (Coralville, IA). Data were normalized to 18s rRNA and expressed as relative changes setting the values of control as one.
Table 1.
Primer sequences for qPCR
| Gene | GeneBank ID | Primers | Sequences | Amplicon Size |
|---|---|---|---|---|
| CXCL1/CINC-1 | NM_030845 | Forward Reverse |
ACCCAAACCGAAGTCATAGCCACA ACTAGTGTTGTCAGAAGCCAGCGT |
181 bp |
| CCL2/MCP-1 | NM_031530 | Forward Reverse |
TGCTGTCTCAGCCAGATGCAGTTA TACAGCTTCTTTGGGACACCTGCT |
131 bp |
| CCL3/MIP-1α | NM_013025 | Forward Reverse |
TGTTTGCTGCCAAGTAGCCACATC AGGAATGTGCCCTGAGGTCTTTCA |
155 bp |
| CXCL10/IP-10 | NM_139089 | Forward Reverse |
TGCAAGTCTATCCTGTCCGCATGT CCTTCTTTGGCTCACCGCTTTCAA |
124 bp |
| TNF-α | NM_012675 | Forward Reverse |
AGAACAGCAACTCCAGAACACCCT TGCCAGTTCCACATCTCGGATCAT |
160 bp |
| CXCL2/MIP-2 | NM_053647 | Forward Reverse |
GCC TCG CTG TCT GAG TTT ATC GAG CTG GCC AAT GCA TAT CT |
113 bp |
| Rn18S/18S rRNA | NR_046237 | Forward Reverse |
ACGGACCAGAGCGAAAGCAT TGTCAATCCTGTCCGTGTCC |
152 bp |
2.6. mRNA stability assay
Calculation of mRNA half-life was based on the method described elsewhere [24-26]. Briefly, the mRNA levels of cytokines/chemokines were determined at indicated times by qPCR. Half-life of a particular mRNA transcript was calculated as follows. First, degradation rate (d) of mRNA was estimated using linear regression of fold change value (y) versus time (t):
where t is time, b is the slope, a is intercept, and d = b*ln(10) is instantaneous decay rate. Since mRNAs generally decay with first-order kinetics [26], half-lives of mRNA (t1/2) was represented by the equation:
2.7. Immunofluorescence
Kupffer cells or hepatocytes were seeded on 4-well chamber slides at a density of 3 × 10⁵/well. After treatments, cells were fixed with 100% methanol for 10 min at −20°C, washed twice with PBS, and blocked with 10% normal donkey serum for 1 hr at room temperature. Primary antibody against acetylated histone H3 at lysine 9 (anti-AcH3K9) was incubated at 4°C overnight, followed by Alexa Fluor 594-conjugated donkey anti-rabbit IgG (Jackson ImmunoResearch Laboratories, West Grove, PA)) for 1 hour at room temperature.
2.8. NF-κB (p65) DNA-binding activity assay
Nuclear extracts were prepared using the Nuclear Extract Kit according to manufacturer's instruction (Active Motif, Carlsbad, California). NF-κB (p65) activity in the nuclear fraction of cultured cells was determined using a colorimetric DNA-binding enzyme-linked immunosorbent assay (ELISA) kit (Active Motif) following the instructions provided by the manufacturer.
2.9. Chemokine ELISA
MCP-1 and CINC-1 concentrations in cell culture media were determined by ELISA kits (R&D systems), respectively. The results are presented as pg/106 cells.
2.10. Immunoprecipitation and Western Blot
The phosphorylation level of tristetraprolin (TTP), AU-rich element RNA binding protein 1 (AUF1), or human antigen R (HuR) was determined by immunoprecipitation. Scraped cells were washed 3 times in PBS and lysated using Mammalian Cell Protein Isolation Reagent (Thermo Scientific). Phosphor-Ser/Thr antibody (1:100; Cell Signaling, Danvers, MA) was added to 500 μg total proteins in a final volume of 500 μl and incubated at 4°C overnight. Protein A agarose beads (Thermo Scientific) were added to the samples and incubated for 4 hr at 4°C. The samples were centrifuged at 14,000 × g at 4°C for 10 minutes. The supernatant was discarded, and the beads were washed twice, pelleted by centrifugation, and resuspended by adding 50 μL of 1 × sample buffer and boiled. Samples were loaded onto a 8%-12% sodium dodecyl sulfatepolyacrylamide gel, transblotted onto polyvinylidene difluoride membrane (Bio-Rad), blocked with 5% nonfat dry milk in tris-buffered saline with 0.1% Tween-20, and then incubated with goat anti-TTP (Santa Cruz Biotechnology, Dallas, TX), rabbit anti-AUF1 (Abcam) or rabbit anti-HuR (Cell Signaling) antibody overnight at 4°C. The membrane was then incubated with HRP-conjugated donkey anti-rabbit IgG or rabbit anti-goat IgG (Fisher Scientific). The bound complexes were detected with enhanced chemiluminescence (Fisher Scientific).
2.11. Statistics
Data were obtained from three separate experiments and presented as mean values ± S.E.M. For two group comparison, independent Student's t-test was used. For multiple groups, one-way ANOVA was used followed by the Student-Newman-Keuls test. Differences were considered significant at P < 0.05.
3. Results
3.1. Alcohol exposure causes liver injury in association with hepatic oxidative stress and inflammation
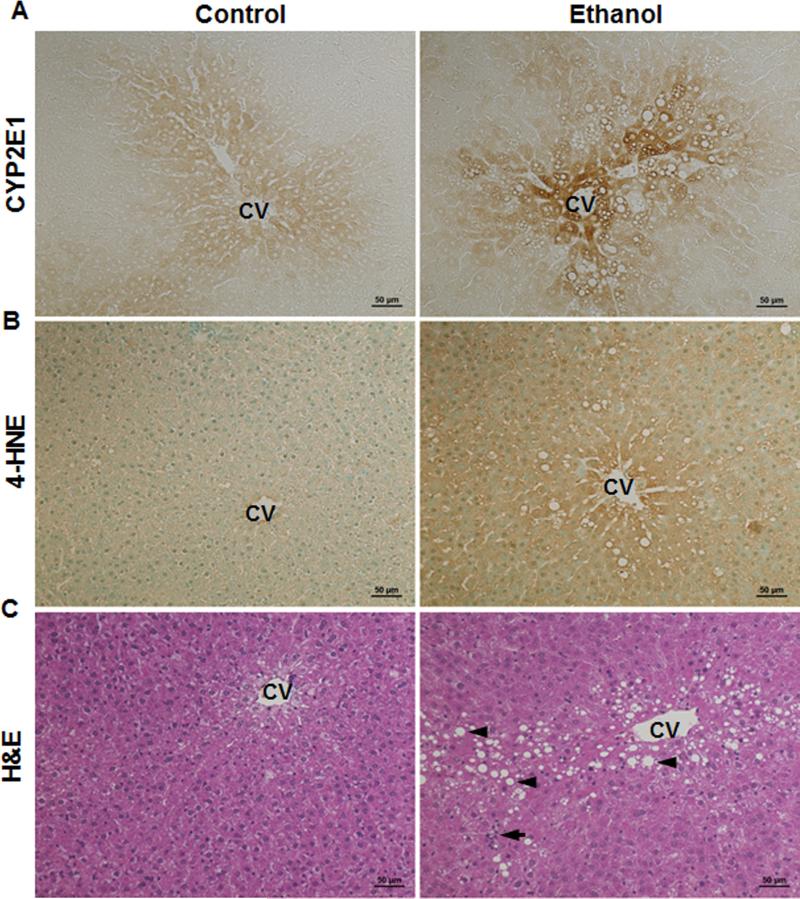
Twelve-week alcohol exposure to the rats resulted in excessive hepatic CYP2E1 induction, especially around the vein areas, compared to the pair-fed rats (Fig. 1A). Immunohistochemical staining of hepatic 4-HNE showed increased positive staining in the alcohol-fed rats than that in the pair-fed controls (Fig. 1B). Moreover, accumulation of lipid droplets (Fig. 1C arrow head) and aggregation of inflammatory cells (Fig. 1C arrow) were observed in the liver sections of the alcohol-fed rats.
Figure 1.
Alcohol exposure caused oxidative stress, lipid accumulation, and inflammatory cell infiltration in the liver of Wistar rats consumed ethanol for 12 weeks. A. Immunohistochemistry staining of hepatic CYP2E1. B. Immunohistochemistry staining of hepatic 4-HNE. C. H&E staining of liver. Arrow: inflammatory cells; arrow head: lipid droplet. CV: central vein. Scale bar: 50 μm.
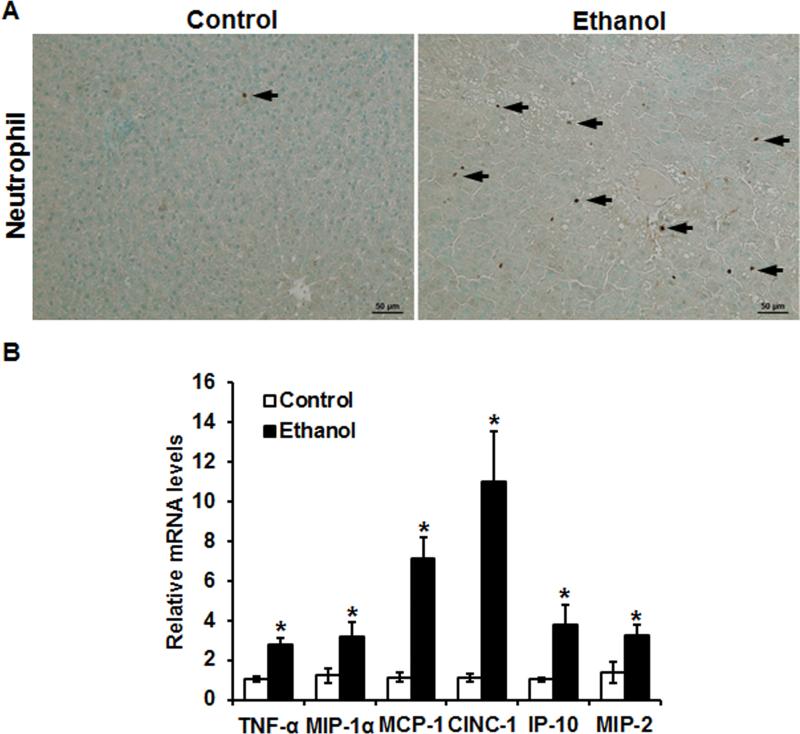
As shown in Fig. 2A (arrow), alcohol exposure caused neutrophil infiltration in the liver. The expression levels of pro-inflammatory cytokines/chemokines genes, including TNF-α, macrophage inflammatory protein-1α (MIP-1α), monocyte chemoattractant protein-1 (MCP-1), CINC-1, interferon gamma-induced protein-10 (IP-10), and macrophage inflammatory protein-2 (MIP-2), were all significantly increased in the livers of the alcohol-fed rats compared to that in the controls (Fig. 2B). Notably, the mRNA levels of CINC-1 and MCP-1 were up-regulated by over 10-fold and 6-fold, respectively, in the alcohol-fed rats compared with that of the pair-fed rats (Fig. 2B).
Figure 2.
Alcohol exposure induced neutrophil infiltration and pro-inflammatory cytokine/chemokine expression in the liver of Wistar rats consumed ethanol for 12 weeks. A. Hepatic immunohistochemistry staining of neutrophil marker myeloperoxidase (MPO). Arrow: MPO+ cell. Scale bar: 50 μm. B. Hepatic pro-inflammatory cytokine/chemokine expression determined by qPCR. Data are expressed as the mean ± SEM (n = 6) setting the values of the control as one. * P < 0.05 versus control.
3.2. Kupffer cells and hepatocytes differentially contribute to pro-inflammatory cytokine/chemokine production
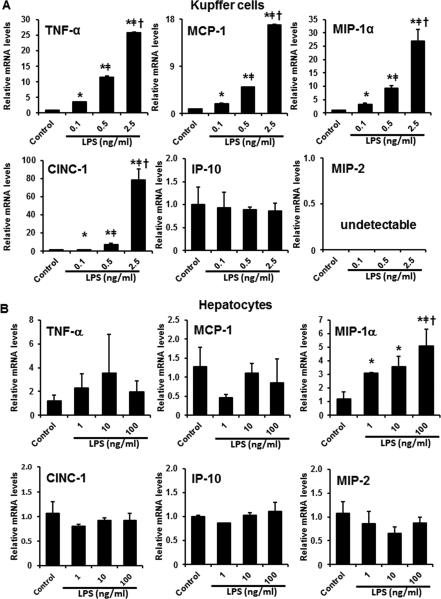
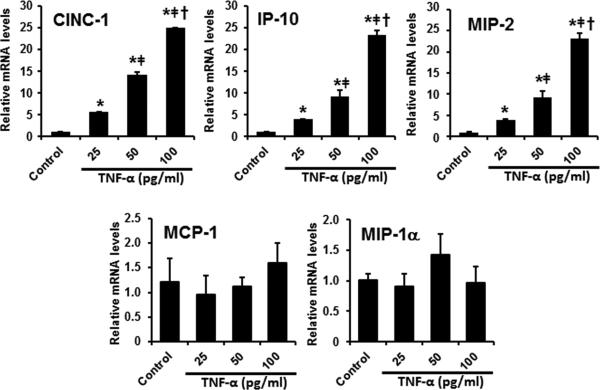
To dissect the roles of Kupffer cells and hepatocytes in alcohol-induced hepatic pro-inflammatory cytokine/chemokine production, rat Kupffer cells (Immortalized rat Kupffer cells-SV40) and hepatocytes (H4IIEC3) were treated with LPS and/or TNF-α, respectively, and the production of cytokines/chemokines was determined. As shown in Figure 3A, treatment of LPS to Kupffer cells in vitro resulted in a dose-dependent induction of cytokines/chemokines, including TNF-α, MCP-1, MIP-1α, and CINC-1. The expression of IP-10 was not affected by LPS, whereas the expression of MIP-2 was undetectable, in Kupffer cells (Figure 3A). On the other hand, LPS treatment dose-dependently increased MIP-1α expression in the hepatocytes, without affecting the expression of TNF-α, MCP-1, CINC-1, IP-10, or MIP-2 (Figure 3B). Moreover, treatment of TNF-α significantly increased the mRNA levels of CINC-1, IP-10, and MIP-2 (but not MCP-1 and MIP-1α) in a dose-dependent manner in H4IIEC3 cells (Figure 4).
Figure 3.
LPS promoted pro-inflammatory cytokine expression in Kupffer cells and hepatocytes. A. Pro-inflammatory cytokine expression in immortalized rat Kupffer cells-SV40 exposed to LPS for 2 hr. B. Pro-inflammatory cytokine expression in rat hepatoma H4IIEC3 cells exposed to LPS for 2 hr. Relative mRNA levels were determined by qPCR. Data are expressed as the mean ± SEM (n = 3). * P < 0.05 versus control, [uni01C2] P < 0.05 versus 0.1 ng/ml LPS; † P < 0.05 versus 0.5 ng/ml LPS (panel A). * P < 0.05 versus control, ǂ P < 0.05 versus 1 ng/ml LPS; † P < 0.05 versus 10 ng/ml LPS (panel B).
Figure 4.
TNF-α triggered pro-inflammatory cytokine expression in hepatocytes. H4IIEC3 cells were exposed to TNF-α for 2 hr. Relative mRNA levels of pro-inflammatory cytokines were determined by qPCR. Data are expressed as the mean ± SEM (n = 3). * P < 0.05 versus control, ǂ P < 0.05 versus 25 pg/ml TNF-α; † P < 0.05 versus 50 pg/ml TNF-α.
3.3. Hydrogen peroxide and 4-HNE differentially affect LPS- or TNF-α-induced pro-inflammatory cytokine/chemokine production in Kupffer cells and hepatocytes
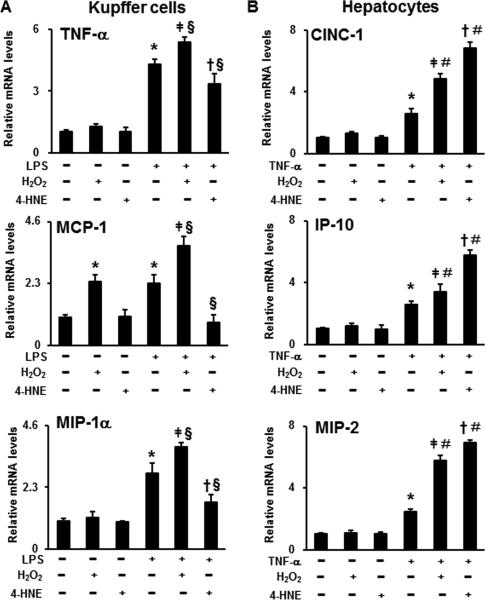
To explore the effect of oxidative stress on LPS- or TNF-α-induced pro-inflammatory cytokine/chemokine production, H2O2 or 4-HNE were treated to Kupffer cells and hepatocytes, respectively, in combination with LPS or TNF-α. Treatment of H2O2 alone significantly increased MCP-1 expression in Kupffer cells (Fig. 5A). Hydrogen peroxide also additively augmented LPS-induced TNF-α, MCP-1, and MIP-1α expression in the Kupffer cells (Fig. 5A) and TNF-α-stimulated CINC-1, IP-10, and MIP-2 expression in the hepatocytes (Fig. 5B). Similar to H2O2, an additive effect of 4-HNE on TNF-α-induced CINC-1, IP-10, and MIP-2 expression production was observed in the hepatocytes (Fig. 5B). Surprisingly, 4-HNE exhibited inhibitory effect on cytokine/chemokine production (TNF-α, MCP-1, and MIP-1α) in Kupffer cells stimulated with LPS (Fig. 5A).
Figure 5.
The effects of H2O2 or 4-HNE on LPS- or TNF-α-induced pro-inflammatory cytokine expression in Kupffer cells or hepatocytes. A. Pro-inflammatory cytokine expression in Kupffer cells treated with 100μmol/l H2O2 or 5μmol/l 4-HNE for 24 hr followed by 0.2 ng/ml LPS for another 2 hr. B. Pro-inflammatory cytokine expression in hepatocytes treated with 100μmol/l H2O2 or 10μmol/l 4-HNE for 24 hr followed by 25 pg/ml TNF-α for another 2 hr. Relative mRNA levels of pro-inflammatory cytokines were determined by qPCR. Data are expressed as the mean ± SEM (n = 3). * P < 0.05 versus control, ǂ P < 0.05 versus H2O2 only; † P < 0.05 versus 4-HNE only; § P < 0.05 versus LPS only (panel A) or TNF-α only (panel B).
3.4. Hydrogen peroxide and 4-HNE promote NF-κB activation and induce histone H3 acetylation in Kupffer cells and hepatocytes stimulated by LPS- or TNF-α
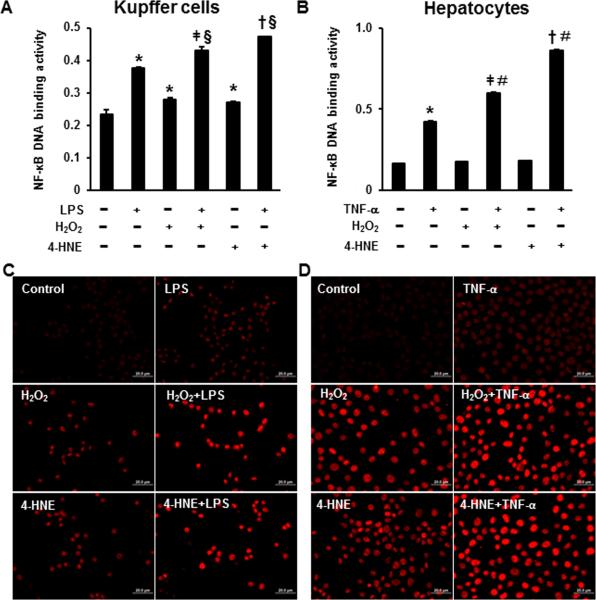
As shown in Fig. 6, LPS or TNF-α significantly elevated the NF-κB DNA-binding activity in the Kupffer cells or hepatocytes, respectively. Hydrogen peroxide or 4-HNE alone increased the NF-κB DNA-binding activity in the Kupffer cells but not in the hepatocytes. Compared to the LPS only group, combination of H2O2 or 4-HNE with LPS further activated NF-κB (Fig. 6A). A similar trend of NF-κB activation was also detected in the hepatocytes treated with H2O2 or 4-HNE along with TNF-α in comparison with the TNF-α only group (Fig. 6B).
Figure 6.
The effects of H2O2 or 4-HNE on LPS- or TNF-α-induced NF-κB activation and histone H3 acetylation in Kupffer cells or hepatocytes. A. NF-κB activity in Kupffer cells treated with 100μmol/l H2O2 or 5μmol/l 4-HNE for 24 hr followed by 0.2 ng/ml LPS treatment for 2 hr. B. NF-κB activity in hepatocytes treated with 100μmol/l H2O2 or 10μmol/l 4-HNE for 24 hr followed by 25 pg/ml TNF-α treatment for 2 hr. The NF-κB activity was measured using NF-κB DNA binding ELISA kit. Data are expressed as the mean ± SEM (n = 3). * P < 0.05 versus control, ǂ P < 0.05 versus H2O2 only; † P < 0.05 versus 4-HNE only; § P < 0.05 versus LPS only (panel A) or TNF-α only (panel B). C. Immunofluorescence of AcH3H9 in Kupffer cells treated with 100μmol/l H2O2 or 5μmol/l 4-HNE for 24 hr followed by 0.2 ng/ml LPS treatment for 2 hr. D. Immunofluorescence of AcH3H9 in hepatocytes treated with 100μmol/l H2O2 or 10μmol/l 4-HNE for 24 hr followed by 25 pg/ml TNF-α treatment for 2 hr. Scale bar: 20 μm.
Immunofluorescence staining of acetylated histone H3 at lysine 9 (AcH3H9) showed that treatment of LPS or TNF-α, H2O2, and 4-HNE, respectively, increased histone H3 acetylation in the Kupffer cells (Fig. 6C) and hepatocytes (Fig. 6D). Further, additive effect on histone H3 acetylation was observed when combined an oxidative product (H2O2 or 4-HNE) with LPS or TNF-α in either Kupffer cells or hepatocytes (Fig. 6C and D).
3.5. Stabilities of pro-inflammatory cytokine/chemokine mRNA are differentially regulated in LPS- or TNF-α-stimulated Kupffer cells and hepatocytes in response to 4-HNE
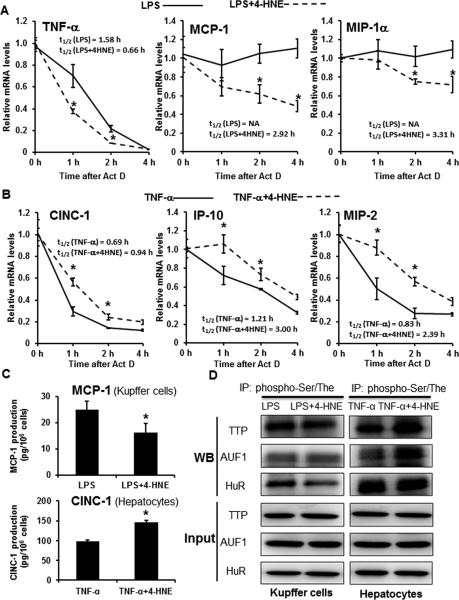
To explore the mechanism of why 4-HNE exhibited opposite trends in inducing cytokine/chemokine production in Kupffer cells and hepatocytes stimulated with LPS or TNF-α, the mRNA stability of cytokines/chemokines and regulatory proteins were determined. The half-lives of TNF-α, MCP-1, and MIP-1α mRNAs were significantly shorter in 4-HNE plus LPS group compared to the LPS only group in the Kupffer cells (Fig. 7A). On the contrary, the half-lives of CINC-1, IP-10, and MIP-2 mRNAs were significantly longer in 4-HNE plus TNF-α group compared to the TNF-α only group (Fig. 7B). ELISA assays of MCP-1 secreted by Kupffer cells and CINC-1 secreted by Hepatocytes further validated that 4-HNE decreased LPS-induced MCP-1 production by Kupffer cells and increased TNF-α stimulated CINC-1 production by hepatocytes (Fig. 7C). Enzymes involved in post-transcriptionally regulating the mRNA stability were analyzed to investigate the underlying molecular mechanism. As shown in Fig. 7D, phosphorylation of a RNA-binding protein, HuR, was decreased in the LPS plus 4-HNE group compared to that in the LPS only group in the Kupffer cells, while phosphorylation of another two RNA-binding proteins, TTP and AUF1, showed no difference between the two groups. In comparison to the TNF-α only group, the 4-HNE plus TNF-α group showed increased phosphorylation of TTP and AUF1 and no difference in HuR phosphorylation in the hepatocytes (Fig. 7D).
Figure 7.
Differentially regulated mRNA stabilities of pro-inflammatory cytokines/chemokines in LPS-treated Kupffer cells and TNF-α-treated hepatocytes in response to 4-HNE. A. The mRNA stabilities and half-lives of pro-inflammatory cytokines/chemokines in Kupffer cells. Kupffer cells-SV40 were treated with 5μmol/l 4-HNE for 24 hr followed by 0.2 ng/ml LPS for 2 hr, then treated with actinomycin D (Act D) at 5μg/ml for 1, 2, or 4 hr. Relative mRNA levels of pro-inflammatory cytokines/chemokines were determined by qPCR. Data are expressed as the mean ± SEM (n = 3). * P < 0.05 versus LPS only. B. The mRNA stabilities and half-lives of pro-inflammatory cytokines/chemokines in hepatocytes. H4IIECs cells were treated with 10μmol/l 4-HNE for 24 hr followed by 25 pg/ml TNF-α for 2 hr, then treated with Act D at 5μg/ml for 1, 2, or 4 hr. Relative mRNA levels of pro-inflammatory cytokines/chemokines were determined by qPCR. Data are expressed as the mean ± SEM (n = 3). * P < 0.05 versus TNF-α only. C. ELISA of MCP-1 secreted by Kupffer cells-SV40 and CINC-1 secreted by H4IIEC3 cells after treatments as described in legends 7A & 7B. ActD was added to the media for 4 hr. Data are expressed as the mean ± SEM (n = 3). * P < 0.05. D. Representative Western blots of phosphorylated TTP, AUF1, and HuR after immunoprecipitation.
4. Discussion
The present study demonstrated that H2O2 and 4-HNE differentially modulates pro-inflammatory cytokine/chemokine production in Kupffer cells and hepatocytes through transcriptional and post-transcriptional modulations. It also showed that Kupffer cells and hepatocytes differentially contribute to pro-inflammatory cytokines/chemokines in ALD; Kupffer cells mainly express TNF-α, MCP-1, and MIP-1α in response to LPS, whereas hepatocytes mainly express CINC-1, IP-10, and MIP-2 in response to TNF-α. NF-κB activation and histone acetylation were both involved in the production of cytokines/chemokines in H2O2-or 4-HNE-primed Kupffer cells and hepatocytes upon LPS or TNF-α stimulation, respectively. Interestingly, unlike H2O2, which additively augmented LPS-induced cytokine/chemokine production in Kupffer cells, 4-HNE inhibited the production. Further studies showed that 4-HNE-induced mRNA degradation was responsible to the inhibition of LPS-induced pro-inflammatory cytokine/chemokine production. Pro-inflammatory cytokines/chemokines, such as TNF-α, CINC-1, and MCP-1, play a crucial role in modulating the systemic manifestations of ALD [3, 27]. Cytokines such as TNF-α are well-known to be secreted by activated Kupffer cells and activated Kupffer cells or hepatocytes produce more cytokines, which subsequently induces hepatocyte apoptosis and liver injury. The role of chemokines, such as CINC-1 and MCP-1, is to attract inflammatory cell infiltration in order to clean xenobiotics and damaged tissues. The present study showed that the expression of TNF-α, MCP-1, MIP-1α, CINC-1, MIP-2, and IP-10 were significantly induced after alcohol intoxication in rats. Among those cytokines/chemokines, Kupffer cells mainly express TNF-α, MCP-1, and MIP-1α in response to LPS, while hepatocytes mainly express CINC-1, IP-10, and MIP-2 upon TNF-α stimulation. These findings provide experimental evidence of targeting different cell types in terms of balancing cytokine/chemokine metabolism during ALD progression. Indeed, depletion of Kupffer cells, a major source of TNF-α, significantly blunted early alcohol-induced liver injury [28, 29]. MCP-1 was increased in both Kupffer cells and hepatocytes in the alcohol-fed mice, and deficiency of MCP-1 inhibited pro-inflammatory cytokine production and protected the mice from developing ALD [5]. Some studies indicated that hepatic stellate cells and endothelial cells also participated in cytokine/chemokine production which was not investigated in the present study. The comprehensive contribution of all kind of hepatic cells to cytokine/chemokine production during ALD requires future investigations.
It is well-known that an important feature of ALD is oxidative stress, which induces inflammation and liver injury [16, 17]. Excess ROS are important signaling mediators for receptor-mediated activation of NF-κB and are associated with downstream pro-inflammatory cytokine/chemokine production [30, 31]. The present study showed that although nontoxic level of H2O2 did not affect cytokine/chemokine expression in Kupffer cells or hepatocytes, it primed LPS- or TNF-α-induced cytokine/chemokine production in Kupffer cells and hepatocytes, respectively. This effect was regulated at the transcriptional level through elevating NF-κB signaling and increasing histone acetylation. The enhancement of histone acetylation by H2O2 may result from the decreased histone deacetylase (HDAC) activity. It is reported that H2O2 reduced HDAC2 activity via tyrosine nitration and eventually enhanced IL-8 gene expression in human airway epithelial cells (BEAS-2B cells) [32]. A recent study found that oxidative stress (H2O2) transiently alters the epigenetic program through modulating the activity of enzymes for histone demethylation and deacetylation [33].
The accumulation of 4-HNE, an aldehyde product of membrane lipid peroxidation, has been found in a great number of oxidative stress-related diseases including ALD. As a highly reactive aldehyde, 4-HNE strongly attacks nucleophilic centers in proteins, phospholipids, and nucleotides [34]. It has also been shown that 4-HNE increases monocyte adhesion [35, 36] and stimulates cytokine production in endothelial cells and macrophages [37]. Stimulation of lipid peroxidation is associated with a marked induction of TNF-α, IL-6, and TGF-β1 by Kupffer cells in rats intragastrically fed alcohol [38]. Several studies have reported an inhibitory effect of 4-HNE in LPS-induced NF-κB activation in Kupffer cells through stabilizing IκBα [39] or suppressing TLR-4 dimerization [40]. The present study found that 4-HNE reduced LPS-induced pro-inflammatory cytokine/chemokine production in Kupffer cells. Mechanistic study showed that 4-HNE increased LPS-induced NF-κB activation but reduced the cytokine/chemokine mRNA stability. This discrepancy in the observation of changes in NF-κB activation may result from different models and exposure times of 4-HNE. In our experiment, cells were treated with 4-HNE for 24 hr, which was used to stimulate long-term exposure.
Our studies demonstrated that in response to 4-HNE, Kuppfer cells produced less cytokines/chemokines under stimulation of LPS. However, Hepatocytes produced more cytokines/chemokines under stimulation of TNF-α. The difference may come from the diverse metabolic abilities. The ability of cells to maintain submicromolar concentrations of 4-HNE during mild oxidative stress can be attributed to enzymatic pathways that rapidly metabolize this strong electrophile to less reactive intermediates. Reports demonstrated that 4-HNE can be oxidized via aldehyde dehydrogenases, alcohol dehydrogenases, and glutathione S-transferases in liver [41]. Esterbauer et al. already suggested that the liver has the highest capacity to metabolize 4-HNE [42]. Their further studies showed the highest 4-HNE degradation rate in hepatocytes [43]. It is therefore implied that the quickly elimination by the hepatocytes has an influence to cellular metabolism and function.
The control of mRNA stability has been shown to be a significant regulatory mechanism involved in the expression of inflammatory cytokines, growth factors, and certain protooncogenes [13, 44, 45]. The present study demonstrated that 4-HNE promoted mRNA degradation in LPS-stimulated Kupffer cells, but decreased mRNA degradation in hepatocytes stimulated by TNF-α. Further studies showed that 4-HNE participated in the regulation of phosphorylation of RNA binding proteins, including TTP, AUF1, and HuR. Collectively, post-transcriptional regulation of pro-inflammatory cytokines/chemokines is an important mechanism of cell type-specific responses to 4-HNE stimulation.
5. Conclusion
The present study showed that Kupffer cells and hepatocytes produce different pro-inflammatory cytokines/chemokines upon alcohol intoxication. Oxidative stress-generated products H2O2 and 4-HNE differentially modulate cytokine/chemokine production in Kupffer cells and hepatocytes in response to LPS or TNF-α stimulation through regulating NF-κB activation, histone acetylation, and mRNA stability. These findings provide experimental evidence of the role of oxidative products in modulating cell type-specific inflammatory signaling cascade in the progression of alcohol-induced hepatitis.
Highlights.
Kupffer cells and hepatocytes produce different cytokines/chemokines in ALD.
4-HNE inhibits LPS-induced cytokine production in Kupffer cells.
4-HNE exaggerates TNF-α-induced cytokine production in hepatocytes.
The diverse effect of 4-HNE involves differentially modulated mRNA stability.
Acknowledgement
This work was supported by the National Institutes of Health (R01AA020212 and 2R01AA018844).
Footnotes
Publisher's Disclaimer: This is a PDF file of an unedited manuscript that has been accepted for publication. As a service to our customers we are providing this early version of the manuscript. The manuscript will undergo copyediting, typesetting, and review of the resulting proof before it is published in its final citable form. Please note that during the production process errors may be discovered which could affect the content, and all legal disclaimers that apply to the journal pertain.
Conflict of Interestes
The authors declare no conflict of interests.
REFERENCES
- 1.McClain CJ, Song Z, Barve SS, Hill DB, Deaciuc I. Recent advances in alcoholic liver disease. IV. Dysregulated cytokine metabolism in alcoholic liver disease. American journal of physiology Gastrointestinal and liver physiology. 2004;287:G497–502. doi: 10.1152/ajpgi.00171.2004. [DOI] [PubMed] [Google Scholar]
- 2.Tilg H, Diehl AM. Cytokines in alcoholic and nonalcoholic steatohepatitis. The New England journal of medicine. 2000;343:1467–76. doi: 10.1056/NEJM200011163432007. [DOI] [PubMed] [Google Scholar]
- 3.An L, Wang X, Cederbaum AI. Cytokines in alcoholic liver disease. Archives of toxicology. 2012;86:1337–48. doi: 10.1007/s00204-012-0814-6. [DOI] [PubMed] [Google Scholar]
- 4.Iimuro Y, Gallucci RM, Luster MI, Kono H, Thurman RG. Antibodies to tumor necrosis factor alfa attenuate hepatic necrosis and inflammation caused by chronic exposure to ethanol in the rat. Hepatology. 1997;26:1530–7. doi: 10.1002/hep.510260621. [DOI] [PubMed] [Google Scholar]
- 5.Mandrekar P, Ambade A, Lim A, Szabo G, Catalano D. An essential role for monocyte chemoattractant protein-1 in alcoholic liver injury: regulation of proinflammatory cytokines and hepatic steatosis in mice. Hepatology. 2011;54:2185–97. doi: 10.1002/hep.24599. [DOI] [PMC free article] [PubMed] [Google Scholar]
- 6.Zhao Y, Zhong W, Sun X, Song Z, Clemens DL, Kang YJ, et al. Zinc deprivation mediates alcohol-induced hepatocyte IL-8 analog expression in rodents via an epigenetic mechanism. The American journal of pathology. 2011;179:693–702. doi: 10.1016/j.ajpath.2011.04.006. [DOI] [PMC free article] [PubMed] [Google Scholar]
- 7.Saiman Y, Friedman SL. The role of chemokines in acute liver injury. Frontiers in physiology. 2012;3:213. doi: 10.3389/fphys.2012.00213. [DOI] [PMC free article] [PubMed] [Google Scholar]
- 8.Dominguez M, Miquel R, Colmenero J, Moreno M, Garcia-Pagan JC, Bosch J, et al. Hepatic expression of CXC chemokines predicts portal hypertension and survival in patients with alcoholic hepatitis. Gastroenterology. 2009;136:1639–50. doi: 10.1053/j.gastro.2009.01.056. [DOI] [PubMed] [Google Scholar]
- 9.Hanck C, Rossol S, Bocker U, Tokus M, Singer MV. Presence of plasma endotoxin is correlated with tumour necrosis factor receptor levels and disease activity in alcoholic cirrhosis. Alcohol and alcoholism. 1998;33:606–8. doi: 10.1093/alcalc/33.6.606. [DOI] [PubMed] [Google Scholar]
- 10.Roberts RA, Ganey PE, Ju C, Kamendulis LM, Rusyn I, Klaunig JE. Role of the Kupffer cell in mediating hepatic toxicity and carcinogenesis. Toxicological sciences : an official journal of the Society of Toxicology. 2007;96:2–15. doi: 10.1093/toxsci/kfl173. [DOI] [PubMed] [Google Scholar]
- 11.Szabo G, Dolganiuc A, Dai Q, Pruett SB. TLR4, ethanol, and lipid rafts: a new mechanism of ethanol action with implications for other receptor-mediated effects. Journal of immunology. 2007;178:1243–9. doi: 10.4049/jimmunol.178.3.1243. [DOI] [PubMed] [Google Scholar]
- 12.Zeldin G, Yang SQ, Yin M, Lin HZ, Rai R, Diehl AM. Alcohol and cytokine-inducible transcription factors. Alcoholism, clinical and experimental research. 1996;20:1639–45. doi: 10.1111/j.1530-0277.1996.tb01710.x. [DOI] [PubMed] [Google Scholar]
- 13.Mino T, Takeuchi O. Post-transcriptional regulation of cytokine mRNA controls the initiation and resolution of inflammation. Biotechnology & genetic engineering reviews. 2013;29:49–60. doi: 10.1080/02648725.2013.801236. [DOI] [PubMed] [Google Scholar]
- 14.Holownia A, Mroz RM, Wielgat P, Jakubow P, Jablonski J, Sulek J, et al. Histone acetylation and arachidonic acid cytotoxicity in HepG2 cells overexpressing CYP2E1. Naunyn-Schmiedeberg's archives of pharmacology. 2014;387:271–80. doi: 10.1007/s00210-013-0942-4. [DOI] [PMC free article] [PubMed] [Google Scholar]
- 15.Kendrick SF, O'Boyle G, Mann J, Zeybel M, Palmer J, Jones DE, et al. Acetate, the key modulator of inflammatory responses in acute alcoholic hepatitis. Hepatology. 2010;51:1988–97. doi: 10.1002/hep.23572. [DOI] [PubMed] [Google Scholar]
- 16.De Minicis S, Bataller R, Brenner DA. NADPH oxidase in the liver: defensive, offensive, or fibrogenic? Gastroenterology. 2006;131:272–5. doi: 10.1053/j.gastro.2006.05.048. [DOI] [PubMed] [Google Scholar]
- 17.De Minicis S, Brenner DA. Oxidative stress in alcoholic liver disease: role of NADPH oxidase complex. Journal of gastroenterology and hepatology. 2008;23(Suppl 1):S98–103. doi: 10.1111/j.1440-1746.2007.05277.x. [DOI] [PubMed] [Google Scholar]
- 18.Hoek JB, Pastorino JG. Ethanol, oxidative stress, and cytokine-induced liver cell injury. Alcohol. 2002;27:63–8. doi: 10.1016/s0741-8329(02)00215-x. [DOI] [PubMed] [Google Scholar]
- 19.Brown MR, Miller FJ, Jr., Li WG, Ellingson AN, Mozena JD, Chatterjee P, et al. Overexpression of human catalase inhibits proliferation and promotes apoptosis in vascular smooth muscle cells. Circulation research. 1999;85:524–33. doi: 10.1161/01.res.85.6.524. [DOI] [PMC free article] [PubMed] [Google Scholar]
- 20.Machino T, Hashimoto S, Maruoka S, Gon Y, Hayashi S, Mizumura K, et al. Apoptosis signal-regulating kinase 1-mediated signaling pathway regulates hydrogen peroxide-induced apoptosis in human pulmonary vascular endothelial cells. Critical care medicine. 2003;31:2776–81. doi: 10.1097/01.CCM.0000098027.49562.29. [DOI] [PubMed] [Google Scholar]
- 21.Konishi A, Aizawa T, Mohan A, Korshunov VA, Berk BC. Hydrogen peroxide activates the Gas6-Axl pathway in vascular smooth muscle cells. The Journal of biological chemistry. 2004;279:28766–70. doi: 10.1074/jbc.M401977200. [DOI] [PubMed] [Google Scholar]
- 22.Niwa K, Inanami O, Yamamori T, Ohta T, Hamasu T, Karino T, et al. Roles of protein kinase C delta in the accumulation of P53 and the induction of apoptosis in H2O2-treated bovine endothelial cells. Free radical research. 2002;36:1147–53. doi: 10.1080/1071576021000016409. [DOI] [PubMed] [Google Scholar]
- 23.Sun Q, Zhong W, Zhang W, Li Q, Sun X, Tan X, et al. Zinc deficiency mediates alcohol-induced apoptotic cell death in the liver of rats through activating ER and mitochondrial cell death pathways. American journal of physiology Gastrointestinal and liver physiology. 2015;308:G757–66. doi: 10.1152/ajpgi.00442.2014. [DOI] [PMC free article] [PubMed] [Google Scholar]
- 24.Coller J. Methods to determine mRNA half-life in Saccharomyces cerevisiae. Methods in enzymology. 2008;448:267–84. doi: 10.1016/S0076-6879(08)02614-1. [DOI] [PubMed] [Google Scholar]
- 25.Sharova LV, Sharov AA, Nedorezov T, Piao Y, Shaik N, Ko MS. Database for mRNA half-life of 19 977 genes obtained by DNA microarray analysis of pluripotent and differentiating mouse embryonic stem cells. DNA research : an international journal for rapid publication of reports on genes and genomes. 2009;16:45–58. doi: 10.1093/dnares/dsn030. [DOI] [PMC free article] [PubMed] [Google Scholar]
- 26.Winzeler EA, Shoemaker DD, Astromoff A, Liang H, Anderson K, Andre B, et al. Functional characterization of the S. cerevisiae genome by gene deletion and parallel analysis. Science. 1999;285:901–6. doi: 10.1126/science.285.5429.901. [DOI] [PubMed] [Google Scholar]
- 27.Kawaratani H, Tsujimoto T, Douhara A, Takaya H, Moriya K, Namisaki T, et al. The effect of inflammatory cytokines in alcoholic liver disease. Mediators of inflammation. 2013;2013:495156. doi: 10.1155/2013/495156. [DOI] [PMC free article] [PubMed] [Google Scholar]
- 28.Thurman RG. II. Alcoholic liver injury involves activation of Kupffer cells by endotoxin. The American journal of physiology. 1998;275:G605–11. doi: 10.1152/ajpgi.1998.275.4.G605. [DOI] [PubMed] [Google Scholar]
- 29.Adachi Y, Bradford BU, Gao W, Bojes HK, Thurman RG. Inactivation of Kupffer cells prevents early alcohol-induced liver injury. Hepatology. 1994;20:453–60. [PubMed] [Google Scholar]
- 30.Lawrence T. The nuclear factor NF-kappaB pathway in inflammation. Cold Spring Harbor perspectives in biology. 2009;1:a001651. doi: 10.1101/cshperspect.a001651. [DOI] [PMC free article] [PubMed] [Google Scholar]
- 31.Ambade A, Mandrekar P. Oxidative stress and inflammation: essential partners in alcoholic liver disease. International journal of hepatology. 2012;2012:853175. doi: 10.1155/2012/853175. [DOI] [PMC free article] [PubMed] [Google Scholar]
- 32.Ito K, Hanazawa T, Tomita K, Barnes PJ, Adcock IM. Oxidative stress reduces histone deacetylase 2 activity and enhances IL-8 gene expression: role of tyrosine nitration. Biochemical and biophysical research communications. 2004;315:240–5. doi: 10.1016/j.bbrc.2004.01.046. [DOI] [PubMed] [Google Scholar]
- 33.Niu Y, DesMarais TL, Tong Z, Yao Y, Costa M. Oxidative stress alters global histone modification and DNA methylation. Free radical biology & medicine. 2015;82:22–8. doi: 10.1016/j.freeradbiomed.2015.01.028. [DOI] [PMC free article] [PubMed] [Google Scholar]
- 34.Esterbauer H, Schaur RJ, Zollner H. Chemistry and biochemistry of 4-hydroxynonenal, malonaldehyde and related aldehydes. Free radical biology & medicine. 1991;11:81–128. doi: 10.1016/0891-5849(91)90192-6. [DOI] [PubMed] [Google Scholar]
- 35.Go YM, Halvey PJ, Hansen JM, Reed M, Pohl J, Jones DP. Reactive aldehyde modification of thioredoxin-1 activates early steps of inflammation and cell adhesion. The American journal of pathology. 2007;171:1670–81. doi: 10.2353/ajpath.2007.070218. [DOI] [PMC free article] [PubMed] [Google Scholar]
- 36.Rittner HL, Hafner V, Klimiuk PA, Szweda LI, Goronzy JJ, Weyand CM. Aldose reductase functions as a detoxification system for lipid peroxidation products in vasculitis. The Journal of clinical investigation. 1999;103:1007–13. doi: 10.1172/JCI4711. [DOI] [PMC free article] [PubMed] [Google Scholar]
- 37.Henriksen PA, Hitt M, Xing Z, Wang J, Haslett C, Riemersma RA, et al. Adenoviral gene delivery of elafin and secretory leukocyte protease inhibitor attenuates NF-kappa B-dependent inflammatory responses of human endothelial cells and macrophages to atherogenic stimuli. Journal of immunology. 2004;172:4535–44. doi: 10.4049/jimmunol.172.7.4535. [DOI] [PubMed] [Google Scholar]
- 38.Kamimura S, Gaal K, Britton RS, Bacon BR, Triadafilopoulos G, Tsukamoto H. Increased 4-hydroxynonenal levels in experimental alcoholic liver disease: association of lipid peroxidation with liver fibrogenesis. Hepatology. 1992;16:448–53. doi: 10.1002/hep.1840160225. [DOI] [PubMed] [Google Scholar]
- 39.Luckey SW, Taylor M, Sampey BP, Scheinman RI, Petersen DR. 4-hydroxynonenal decreases interleukin-6 expression and protein production in primary rat Kupffer cells by inhibiting nuclear factor-kappaB activation. The Journal of pharmacology and experimental therapeutics. 2002;302:296–303. doi: 10.1124/jpet.102.033522. [DOI] [PubMed] [Google Scholar]
- 40.Kim YS, Park ZY, Kim SY, Jeong E, Lee JY. Alteration of Toll-like receptor 4 activation by 4-hydroxy-2-nonenal mediated by the suppression of receptor homodimerization. Chemico-biological interactions. 2009;182:59–66. doi: 10.1016/j.cbi.2009.07.009. [DOI] [PubMed] [Google Scholar]
- 41.Hartley DP, Ruth JA, Petersen DR. The hepatocellular metabolism of 4-hydroxynonenal by alcohol dehydrogenase, aldehyde dehydrogenase, and glutathione S-transferase. Archives of biochemistry and biophysics. 1995;316:197–205. doi: 10.1006/abbi.1995.1028. [DOI] [PubMed] [Google Scholar]
- 42.Esterbauer H, Zollner H, Lang J. Metabolism of the lipid peroxidation product 4-hydroxynonenal by isolated hepatocytes and by liver cytosolic fractions. The Biochemical journal. 1985;228:363–73. doi: 10.1042/bj2280363. [DOI] [PMC free article] [PubMed] [Google Scholar]
- 43.Siems WG, Zollner H, Grune T, Esterbauer H. Metabolic fate of 4-hydroxynonenal in hepatocytes: 1,4-dihydroxynonene is not the main product. Journal of lipid research. 1997;38:612–22. [PubMed] [Google Scholar]
- 44.Tiedje C, Holtmann H, Gaestel M. The role of mammalian MAPK signaling in regulation of cytokine mRNA stability and translation. Journal of interferon & cytokine research : the official journal of the International Society for Interferon and Cytokine Research. 2014;34:220–32. doi: 10.1089/jir.2013.0146. [DOI] [PubMed] [Google Scholar]
- 45.Hollams EM, Giles KM, Thomson AM, Leedman PJ. MRNA stability and the control of gene expression: implications for human disease. Neurochemical research. 2002;27:957–80. doi: 10.1023/a:1020992418511. [DOI] [PubMed] [Google Scholar]


