

Abstract
The distinct morphological and functional properties of the cardiac chambers arise from an elaborate developmental program involving cell lineage determination, morphogenesis, and dynamic spatiotemporal gene expression patterns. Although a number of transcription factors have been identified for proper gene regulation in the chambers, the complete transcriptional network that controls these patterns remains poorly defined. Previous studies have implicated the MEF2C transcription factor in the regulation of chamber-restricted enhancers. To better understand the mechanisms of MEF2-mediated regional gene regulation in the heart, we took advantage of MEF2A knock-out (KO) mice, a model that displays a predominantly ventricular chamber phenotype. Transcriptomic analysis of atrial and ventricular tissue from adult MEF2A KO hearts revealed a striking difference in chamber gene expression, with a larger proportion of dysregulated genes in the atrial chambers. Canonical pathway analysis of genes preferentially dysregulated in the atria and ventricles revealed distinct MEF2A-dependent cellular processes in each cardiac chamber. In the atria, MEF2A regulated genes involved in fibrosis and adhesion, whereas in the ventricles, it controlled inflammation and endocytosis. Finally, analysis of transcription factor–binding site motifs of differentially dysregulated genes uncovered distinct MEF2A co-regulators for the atrial and ventricular gene sets, and a subset of these was found to cooperate with MEF2A. In conclusion, our results suggest a mechanism in which MEF2 transcriptional activity is differentially recruited to fine-tune gene expression levels in each cardiac chamber. This regulatory mechanism ensures optimal output of these gene products for proper physiological function of the atrial and ventricular chambers.
Keywords: cardiac development, gene knockout, gene regulation, mouse, transcription factor, transcriptomics
Introduction
The atrial and ventricular chambers of the mammalian heart have distinct anatomical and functional properties that are necessary for the coordinated and efficient pumping of blood. These differences arise from morphogenetic events coupled to cell specification pathways within myocyte and non-myocyte lineages that create the atria and ventricles from a linear heart tube (1, 2). Moreover, these developmental programs lead to regional gene expression patterns that are unique to the atrial and ventricular chambers (3–5). The importance of these gene expression patterns is highlighted by cardiac defects in mouse model systems that display distinct atrial and ventricular chamber dysregulation (6–11).
The establishment of atrial and ventricular identity from cardiomyocyte precursors occurs early in the developing heart (12–14). Throughout development these gene programs undergo dynamic gene regulation to ultimately express a fixed compartment-specific gene expression pattern postnatally. Investigating the transcriptional regulation of chamber-restricted genes has led to the identification of a number of enhancers and transcription factors required for distinct regional expression patterns in the heart (15, 16).
The myocyte enhancer factor 2 (MEF2) family of transcription factors is a key regulator of cardiac muscle differentiation and development (17, 18). Interestingly, MEF2 proteins have been implicated in the regulation of atrial and ventricular chamber-restricted genes (19–23). Based on their reported uniform expression throughout the heart, it is unlikely that MEF2 proteins alone drive chamber-specific gene programs. Nevertheless, these observations suggest that MEF2 proteins play an important modulatory role in the regional expression of cardiac genes.
Previously, we described the variable penetrance of cardiac defects in global MEF2A knock-out (KO) mice. Perinatal MEF2A-deficient hearts displayed dilation of the right and left ventricles, including structurally compromised cardiomyocytes (24, 25). By contrast, adult MEF2A mutant hearts did not display ventricular dilation but showed compensatory activation of a MEF2-dependent reporter that was largely restricted to the ventricles. Because both young and adult mutant hearts display predominantly ventricular phenotypes, these observations suggest that the atria and ventricles are differentially affected by the loss of MEF2A.
To delve deeper into a potential regional requirement of MEF2A in the heart, we performed genome-wide expression profiling of atrial and ventricular chambers from adult MEF2A KO mice. We found that genes uniformly expressed throughout the chambers of the heart were dysregulated preferentially in the atria or ventricles. Consequently, each cardiac chamber had perturbations in disparate cell-signaling pathways. Only a small fraction of the total dysregulated genes were similarly affected in both atria and ventricles of MEF2A mutant hearts. To understand the transcriptional basis of this regional gene dysregulation pattern, we computationally analyzed the promoter regions of genes preferentially dysregulated in the atrial and ventricular chambers, and we identified a distinct complement of transcription factor–binding sites in each gene set. Our results demonstrate that MEF2A is required for proper atrial and ventricular gene expression but does not confer chamber identity. These findings provide insight into the complex transcriptional mechanisms of region-specific gene expression in the mammalian heart.
Results
Differential gene dysregulation in cardiac chambers of MEF2A knock-out mice
Global MEF2A deficiency in mice results in two distinct cardiac phenotypes (23). Most MEF2A knock-out (KO) mice (∼80%) die perinatally and display various cardiac defects, including dilation of the right and left ventricles. A subset of KO mice survive to adulthood and also have cardiac abnormalities. However, these adult mutant hearts do not display ventricular dilation, instead a MEF2-responsive lacZ reporter is primarily up-regulated in the right and left ventricles, likely resulting from stress-induced activation of MEF2D (23). Given the predominant ventricular phenotypes in MEF2A mutant hearts, we hypothesized that the atria and ventricles have a differential requirement for MEF2A in cardiac chamber gene regulation.
To characterize potential differences in cardiac chamber gene regulation mediated by MEF2A, we dissected atrial (left and right combined) and ventricular (left and right) tissue from adult wild-type (WT) and MEF2A KO hearts, and we analyzed the extracted RNA via microarray. As shown in Fig. 1A, this analysis revealed a combined total of 686 genes dysregulated by ±1.5-fold or more. Interestingly, the scatter plots showed a greater number of genes dysregulated in MEF2A KO atria compared with KO ventricles. Indeed, detailed examination of the 686 dysregulated genes revealed that 481 genes (70%) were preferentially dysregulated in the atrial chambers of MEF2A knock-out hearts (Fig. 1A, Venn diagram), even though the vast majority of these genes are uniformly expressed in the atrial and ventricular chambers of WT hearts (Fig. 1B). By contrast, only 158 genes (23%) were preferentially dysregulated in mutant ventricles, and the majority of these do not display chamber-enriched expression in WT hearts. The remaining 47 genes (7%) were dysregulated by ±1.5-fold or more in both chambers of the mutant hearts. Chamber-enriched genes, i.e. genes displaying ±2.0-fold or more expression in one WT chamber relative to the other, accounted for a small percentage of the dysregulated genes in each KO chamber (Fig. 1B).
Figure 1.

MEF2A regulates overlapping but distinct genes in the atria and ventricles of the adult heart. A, top, scatter plots depicting gene expression differences in MEF2A KO atria and ventricles. Wild-type (WT) and MEF2A KO atria microarray intensities (top left graph) and WT and MEF2A KO ventricle microarray intensities (top right graph) were plotted against one another. n each graph, genes up-regulated by at least 1.5-fold are plotted in green (FC ≥ 1.5); genes down-regulated by at least −1.5-fold are plotted in red (FC ≥ −1.5); and genes dysregulated by no greater than 1.5-fold in either direction are plotted in black (−1.5 < FC < 1.5), where FC is fold-change. Of the 21,212 gene probe sets on the Mouse Affymetrix GeneChip® gene 1.0 ST array system, 686 well-annotated genes were dysregulated by at least 1.5-fold or greater in adult Mef2a KO hearts. Bottom, Venn diagram summarizes dysregulated gene expression profile in KO atria (A), KO ventricles (V), and both (A+V). B, of the total 686 dysregulated genes, 481 genes (70%) were preferentially dysregulated in KO atria; 158 genes (23%) were preferentially dysregulated in KO ventricles, and the remaining 47 genes (7%) were dysregulated in both KO cardiac chambers. These genes were further categorized based on their chamber expression profile (chamber enrichment is specified as 2.0-fold or greater expression in one chamber relative to the other) in WT hearts. Most of the preferentially dysregulated genes are similarly expressed in both atria and ventricles of WT hearts. C, average fold dysregulation of each three gene sets. Averages are calculated as absolute values. D, analysis of direction of dysregulation in each gene set. Similar number of genes were up- and down-regulated in each. 6 out of the 47 genes dysregulated in both KO atria and ventricles are up- and down-regulated in different chamber types.
Although the atrial chambers had more dysregulated genes, the extent of dysregulation was found to be similar in each compartment. Genes preferentially affected in the atria were dysregulated on average by ±1.76-fold, and those in the ventricles were dysregulated on average by ±1.87-fold (Fig. 1C). Interestingly, the average fold dysregulation was far greater for those genes affected in both chambers, ±2.4-fold in atria and ±2.6-fold in ventricles. Although there were more dysregulated genes in the MEF2A KO atria, the proportion of up- and down-regulated genes was similar in both KO atria and ventricles (Fig. 1D). Taken together, this expression profiling analysis revealed differential chamber sensitivity of genes to the loss of MEF2A despite its reported uniform expression throughout all chambers of the heart. Furthermore, most genes sensitive to the loss of MEF2A in both chambers were dysregulated in a similar direction. Finally, the abundance of preferentially dysregulated genes in MEF2A KO atria is in stark contrast to the more obvious ventricular phenotypes in these mutant hearts.
Validation of preferentially dysregulated genes in MEF2A KO hearts
To confirm the differential chamber sensitivity, we examined expression of a subset of genes from each of the dysregulated gene sets. The genes selected for this analysis are expressed throughout the heart but either showed preferential dysregulation in one of the mutant cardiac chambers or were affected in both. As depicted in Fig. 2A, Arhgef19, Chrdl2, Clic6, Itga7, and Shisa6 were preferentially and significantly dysregulated in MEF2A KO atria but not in the ventricles. Likewise, expression of Bex1, Fbxo4, Fgf16, Pknox2, and Slitrk4 was preferentially dysregulated in the ventricles but not in the atria (Fig. 2B). Finally, Aqp4, Arhgap20, Asb4, Fgf14, and Pde7a genes were significantly dysregulated, either up- or down-regulated in both atria and ventricles of MEF2A KO hearts (Fig. 2C).
Figure 2.

MEF2A-sensitive genes display cardiac chamber-specific dysregulation in adult MEF2A KO hearts. A, quantitative RT-PCR analysis revealed that Arhgef19, Chrdl2, Clic6, Itga7, and Shisa6 were preferentially dysregulated in adult MEF2A KO atria by more than 2-fold when compared with their expression in KO ventricles. Expression levels for each gene in KO atria and ventricles were normalized to their respective WT cardiac region. B, quantitative RT-PCR analysis revealed that Bex1, Fbxo44, Fgf16, Pknox2, and Slitrk4 were dysregulated in KO ventricles by more than 2-fold compared with KO atrial tissue. C, quantitative RT-PCR analysis revealed that Aqp4, Arhgap20, Asb4, Fgf14, and Pde7a were dysregulated by more than 1.5-fold in both KO atria and ventricles. Error bars represent standard deviation; *, p < 0.05; **, p < 0.01; ***, p < 0.001.
Canonical dysregulated pathways in MEF2A KO atria and ventricles
To determine whether the preferentially dysregulated genes function in distinct pathways we performed Ingenuity® Pathway Analysis (Qiagen) on the three gene sets. As shown in Table 1, genes preferentially dysregulated in MEF2A KO atria function in fibrosis, stem cell pluripotency, and adhesion. By contrast, genes dysregulated primarily in the mutant ventricles function in inflammation, amino acid metabolism, and endocytosis signaling. The cohorts dysregulated in both chambers function in folate transformation and ubiquitination pathways, although enrichment in these processes was modest given the small number of genes in this category. These results suggest that dysfunction in adult MEF2A KO hearts arises, in part, not from a globally defective pathway throughout the organ but from the cumulative effect of abnormal regulation of distinct cellular processes in each cardiac compartment.
Table 1.
Top canonical pathways dysregulated in MEF2A KO hearts
Three gene sets (481 genes dysregulated in KO atria, 158 genes dysregulated in KO ventricles, and 47 genes dysregulated in KO atria and ventricles) were analyzed using the Qiagen Ingenuity Pathway Analysis. The top affected canonical pathways are listed for each gene set.
| Top canonical pathways | ||
|---|---|---|
| Name | p value | Ratio |
| MEF2A KO atria only | ||
| Hepatic fibrosis | 2.74E-04 | 13/197 |
| Human embryonic stem cell pluripotency | 2.07E-03 | 9/134 |
| Agranulocyte adhesion and diapedesis | 6.63E-03 | 10/189 |
| GADD45 signaling | 6.87E-03 | 3/19 |
| Nicotine degradation II | 7.77E-03 | 5/59 |
| MEF2A KO ventricles only | ||
| MSP-RON signaling pathway | 3.97E-03 | 3/46 |
| Tryptophan degradation X (mammalian via tryptamine) | 6.78E-03 | 2/18 |
| Glutamine biosynthesis | 6.93E-03 | 1/1 |
| Clathrin-mediated endocytosis signaling | 9.39E-03 | 5/185 |
| Cellular effects of sildenafil (Viagra) | 1.25E-02 | 4/129 |
| MEF2A KO atria and ventricles | ||
| Folate transformations I | 6.44E-03 | 1/9 |
| Protein ubiquitination pathway | 1.6E-01 | 1/242 |
Next, we analyzed expression or activity of selected components from the canonical pathways identified in the ingenuity pathway analysis (Table 1) in MEF2A KO hearts to assess whether these cellular processes were perturbed in a chamber-specific fashion. Specifically, we subjected atrial and ventricular tissue lysates from adult wild-type and MEF2A KO hearts to Western blot analysis for focal adhesion kinase (FAK)2 and TRAF6 (TNF receptor-associated factor 6). Among their role in diverse signal transduction cascades, FAK and TRAF6 activities are modulated by the integrin/adhesion and macrophage-stimulating protein–recepteur d'origine nantais (MSP-RON) pathways, respectively (26–29). Adhesion was among the top dysregulated pathways in MEF2A KO atria, whereas MSP-RON, a receptor tyrosine kinase pathway involved in cancer and inflammation (28, 29), was the top dysregulated pathway in mutant ventricles. As shown in Fig. 3, A and B, we detected a modest but significant down-regulation of phosphorylated FAK, an indicator of its activity, in MEF2A KO atria but not ventricles. Conversely, TRAF6 was preferentially and significantly down-regulated in the ventricles of adult MEF2A mutant hearts. These data highlight the distinct cellular responses of the cardiac chambers to the loss of a broadly expressed transcription factor and provide support for differential gene regulatory activity of MEF2A in the atria and ventricles of the heart.
Figure 3.
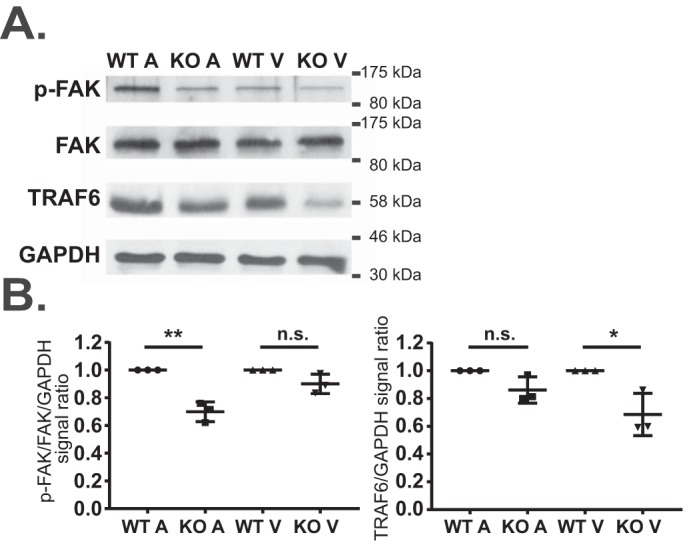
Atria and ventricles of adult MEF2A KO hearts each display perturbations in distinct cell-signaling pathways. A, immunoblot analysis of phospho-FAK (p-FAK) and total FAK, TRAF6, and GAPDH proteins levels between WT and KO samples in atrial and ventricular lysates. 15 μg of cleared lysate was loaded onto each lane. B, quantification of p-FAK and TRAF6 protein signal between WT and KO samples in atrial and ventricular lysates. p-FAK levels were normalized to total FAK levels before normalizing to GAPDH levels, and TRAF6 levels were normalized to GAPDH levels. Quantified KO levels were normalized to respective WT levels for each tissue comparison. Error bars represent standard deviation; n.s., not significant; *, p < 0.05; **, p < 0.01.
MEF2A expression is uniformly expressed throughout the adult heart
A previous study described enrichment of MEF2A protein in the atrial chambers of the adult mouse heart (30). Because a majority of the dysregulated genes were preferentially affected in the atria, we sought to determine whether this expression pattern could explain the differential sensitivity to MEF2A. Initially, we examined Mef2a transcript levels in both cardiac chambers. RT-PCR analysis revealed similar transcript levels of Mef2a between adult wild-type atrial and ventricular cardiac chambers (Fig. 4A). Additionally, given the possibility that alternatively spliced transcripts generated by the Mef2a gene (31) could account for chamber-specific differences, we analyzed expression of the various Mef2a splice isoforms in atrial and ventricular tissue. We did not observe any difference in these alternatively spliced transcripts between atrial and ventricular tissue (data not shown).
Figure 4.

MEF2A expression is restricted to the myocardium and is similar throughout the adult WT heart. A, RT-PCR analysis of Mef2a, Nkx2.5, and 18s mRNA levels in WT atria and ventricles. Numbers below Mef2a and Nkx2.5 bands represent average band intensity when normalized against 18s (n = 4, quantifications normalized to atrial tissue). B, immunohistochemical detection of MEF2A expression (red) in WT atria and ventricles, counterstained with DAPI (blue). ×10× WT atrium and ventricle (top panels, A = atrium; V = ventricle), ×60 WT atrium (middle panels), and ×60 WT ventricle (bottom panels) fluorescent images were acquired. C, quantification of MEF2A nuclear signal using ×60 WT atrium and ventricle images. MEF2A signal was normalized to total DNA (DAPI) signal. Average MEF2A/DAPI signal was normalized to WT ventricles. D, immunoblot analysis of MEF2A, histone H3, and GAPDH protein levels in WT atria and ventricular lysates. 15 μg of cleared lysate was loaded onto each lane. E, quantification of MEF2A protein signal in atrial and ventricular lysates. MEF2A signal was normalized to total histone H3 levels (left graph) or to GAPDH levels (right graph) for each lane. F, immunohistochemical detection of MEF2A in myocardium but not epicardium or endocardium in WT atria and ventricles. MEF2A (red), PECAM (green, top and middle panels), and WT1 (green, bottom panels) counterstained with DAPI (blue). ×60 WT atrium (top panels), ×40 WT ventricle (middle panels), and ×10 WT atrium and ventricle (bottom panels) fluorescent images were acquired (arrows indicate MEF2A positive nuclei; asterisk indicates PECAM staining in the top panels; arrowheads indicate PECAM and WT1 focused staining in the middle and bottom panels, respectively; A, atrium; V, ventricle). Error bars represent standard deviation; n.s., not significant; ***, p < 0.001.
To address the above discrepancy, we compared MEF2A protein levels between atria and ventricles by performing immunohistochemistry on adult cardiac sections using anti-MEF2A antibody (Santa Cruz Biotechnology sc-313), which preferentially recognizes the MEF2A protein isoform (32). MEF2A immunoreactivity appeared enriched in myocytes within the atrial chambers compared with the ventricles of the heart (Fig. 4B). Because the increased signal in the atria may reflect the higher density of atrial myocytes per area of tissue, because of their smaller size, we normalized the MEF2 signal to DAPI-positive cells in each chamber. On normalization of MEF2A-positive myocytes to nuclear DAPI-positive cells, a similar fold difference was observed between wild-type atria and ventricles (Fig. 4C). In a complementary set of experiments, MEF2A protein levels were evaluated by Western blotting using whole-tissue lysates from each cardiac chamber. Again, MEF2A protein levels appeared higher in atrial lysates compared with ventricular lysates (Fig. 4D). However, MEF2A protein levels were found to be similar between atria and ventricles when normalized to the nuclear protein histone H3 (Fig. 4E).
To obtain a more detailed picture of MEF2A expression in the adult heart, we co-immunostained adult wild-type cardiac sections with anti-MEF2A and epicardial or endocardial markers. As shown in Fig. 4F, MEF2A signal was localized to the nuclear cardiac myocytes within the myocardium and did not overlap with that of either PECAM (endocardium) or WT1 (epicardium). These results clearly demonstrate that MEF2A is not preferentially expressed in the atria of the adult heart, and the apparent chamber-specific differences in protein expression can be explained by the different sizes and densities of atrial and ventricular myocytes per mass of tissue. Furthermore, MEF2A protein is restricted to the myocardium in the atria and ventricles thereby ruling out differences arising from expression in additional regions of the adult heart.
Atrial and ventricular chambers display similar MEF2 DNA-binding activity
We next asked whether differences in MEF2 DNA-binding activity in the cardiac chambers could account for the preferential dysregulation. Initially, electrophoretic mobility shift assays were performed to evaluate MEF2 binding from atrial and ventricular lysates in vitro. Similar to the Western blot analysis, gel-shift assays using whole-tissue lysates from each chamber showed greater MEF2 DNA-binding activity in atrial lysates (Fig. 5A, left panel). As a control, we used a probe harboring the CaRG element, the consensus binding site for serum-response factor (SRF), a widely expressed TF important in cardiac gene regulation, and development (33). SRF also showed differences in atrial and ventricular DNA-binding activity (Fig. 5A, right panel). On normalization to the SRF DNA-binding pattern there was no significant difference in MEF2 DNA-binding activity between the cardiac chambers (Fig. 5A, graph). Thus, the apparent enrichment of MEF2-binding activity in atrial lysates reflects differences between atrial and ventricular myocyte volumes.
Figure 5.

MEF2 DNA-binding activity in vitro and in regulatory regions of MEF2A-dependent genes. A, electrophoretic mobility shift assays of MEF2 (left panel) and SRF (right panel) DNA-binding activity in lysates from WT atria and ventricles. Quantification of MEF2 DNA-binding activity relative to SRF-binding activity (right graph) is shown. Average fold change was normalized to WT ventricles. B, gel-shift assay of MEF2 DNA-binding activity in lysates from WT and KO cardiac chambers. MEF2 KO/WT chamber gel-shift signal reduction quantification (right graph) is shown. MEF2 DNA-binding activity signal in KO chambers was normalized against respective WT chamber. C, 5,000 bp upstream regulatory region for 15 MEF2A-sensitive genes were scanned for predicted MEF2 sites using the Integrative Genomics Viewer (Broad Institute), ENCODE experimental datasets, and the MEF2 consensus sequence 5′-YTAWWWWTAG-3′. For Fbxo44, an optimal MEF2 site was located upstream of the original −5,000-bp search parameter. Formaldehyde-fixed and -sonicated chromatin was isolated from Mef2a WT whole hearts. ChIP assay was performed with a MEF2A polyclonal antibody, and immunoprecipitated chromatin was subjected to quantitative PCR with primers designed to amplify ∼100 bp of promoter sequence containing predicted MEF2 sites. Error bars represent standard deviation of qPCR samples in triplicate. D, MEF2A-dependent activation of a luciferase reporter harboring a 500-bp upstream genomic region surrounding a MEF2-binding site (−2347) of the Itga7 gene. E, MEF2A-dependent activation of a luciferase reporter harboring a 500-bp genomic region surrounding a MEF2-binding site (−2859) of the Bex1 gene. Error bars represent standard deviation of biological replicates; n.s., not significant; **, p < 0.01; ***, p < 0.001.
We also asked whether MEF2A deficiency altered MEF2 DNA binding in a chamber-specific manner. Differences in MEF2 binding between mutant atrial and ventricular lysates would suggest a chamber-specific effect on the DNA-binding activity of remaining MEF2 protein isoforms and/or composition of MEF2 complexes. As shown in Fig. 5B, the reduction in MEF2 DNA-binding activity observed in MEF2A KO atrial and ventricular lysates was not significantly different. These results clearly demonstrate that the proportion of MEF2A in MEF2 DNA-binding complexes is similar between the atria and ventricles and that MEF2A deficiency did not alter MEF2 DNA-binding activity in a chamber-specific fashion.
Next, we examined endogenous MEF2 genomic binding to promoter regions of selected dysregulated genes to determine whether differences in MEF2A binding in vivo could help explain the observed preferential dysregulation. For this analysis, we focused on the same set of dysregulated genes described in Fig. 2. Predicted MEF2 sites (Fig. 5C) were identified in the upstream regions of these genes based on available ENCODE MEF2A ChIP-seq data (accession numbers ENCSR806JZK and ENCSR867SDZ) and the MEF2 consensus sequence (5′-YTAWWWWTAG-3′). Although there was slight variability in the MEF2 consensus sequence, these minor differences did not group together with genes displaying similar preferential dysregulation. Chromatin immunoprecipitation (ChIP) was performed on cross-linked atrial and ventricular tissue from adult wild-type hearts using MEF2A antibodies (Santa Cruz Biotechnology), which we previously reported preferentially recognizes MEF2A (28). As shown in Fig. 5C, MEF2A binding was enriched at the predicted MEF2 sites. However, binding of MEF2A to these regions was not significantly different between these genes. Multiple attempts to assess binding of MEF2A to these genes in ventricular tissue by ChIP proved unsuccessful. Nevertheless, the similarity in enrichment of MEF2A binding to these genomic regions, whose genes display differences in chamber sensitivity, does not explain the differential chamber dysregulation profile.
To bolster the in vivo ChIP analysis and to demonstrate that the dysregulated target genes are directly regulated by MEF2A, we cloned the genomic regions harboring the candidate MEF2-binding site from a representative gene in each category: Itga7 (preferentially dysregulated in the atria) and Bex1 (preferentially dysregulated in the ventricles). As shown in Fig. 5, D and E, transfection of MEF2A significantly stimulated the activation of both pGL3p-Itga7 (2.9-fold) and pGL3p-Bex1 (2.3-fold) in HEK293T cells.
Identification of candidate MEF2A co-factors
The lack of any obvious difference in MEF2A expression or binding activity suggests that differential sensitivity of genes in the cardiac chambers results from the ability of MEF2A to interact with a distinct set of cofactors. Toward this end, we performed TF-binding motif analysis using MatInspector (Genomatix) on dysregulated genes from each group. This analysis revealed a distinct set of enriched TF-binding sites in each gene set (Table 2).
Table 2.
Candidate co-factor analysis of MEF2A-dependent genes
The 5,000-bp proximal promoters from the three dysregulation gene sets were analyzed for predicted MEF2 sites and then analyzed for additional neighboring transcription factor-binding sites within 50 bp of predicted MEF2 sites (Genomatix). In each gene set, over-representation and Z-score for each MEF2-TF module is calculated (Z-score greater than 2 is considered statistically significant). For each gene set, the top 10 over-represented MEF2-TF modules are listed and rearranged according to representation in each gene set.
| V$MEF2 & secondary TF paired module | TF description | Fold over-representation/Z-score in promoters of genes dysregulated |
||
|---|---|---|---|---|
| Preferentially in MEF2A KO atria | Preferentially in MEF2A KO ventricles | In MEF2A KO atria and ventricles | ||
| V$CLOX | CLOX and CLOX homology (CDP) factors | 1.7/18.96 | ||
| V$EREF | Estrogen-response elements | 2.22/19.14 | ||
| V$HBOX | Homeobox transcription factors | 1.32/13.88 | ||
| V$SF1F | Vertebrate steroidogenic factor | 3.3/28.42 | ||
| V$BRN5 | Brn-5 POU domain factors | 1.58/13.08 | ||
| V$DMRT | DM domain-containing transcription factors | 1.65/11.48 | ||
| V$HOXF | Paralog hox genes 1–8 from the four hox clusters A, B, C, D | 1.45/12.48 | ||
| V$NKXH | NKX homeodomain factors | 1.59/12.96 | ||
| V$BHLH | bHLH transcription factors expressed in muscle, intestine and stomach | 1.91/5.67 | ||
| V$CART | Cart-1 (cartilage homeoprotein 1) | 1.39/5.83 | ||
| V$HAND | Twist subfamily of class B bHLH transcription factors | 1.77/5.66 | ||
| V$HOXC | HOX - PBX complexes | 1.57/5.63 | ||
| V$LEFF | LEF1/TCF | 1.6/5.42 | ||
| V$LHXF | Lim homeodomain factors | 1.3/14.81 | 1.46/12.86 | |
| V$OCT1 | Octamer-binding protein | 1.36/17.17 | 1.47/12.95 | |
| V$CAAT | CCAAT-binding factors | 1.9/19.67 | 1.78/5.21 | |
| V$HOMF | Homeodomain transcription factors | 1.36/11.22 | 1.41/7 | |
| V$BRNF | Brn POU domain factors | 1.29/15.05 | 1.47/13.71 | 1.35/5.53 |
| V$FKHD | Forkhead domain factors | 1.31/16 | 1.53/15.6 | 1.39/6.31 |
| V$SORY | SOX/SRY-sex/testis determining and related HMG box factors | 1.38/18.48 | 1.56/15.51 | 1.36/9.03 |
Of the top enriched TF-binding sites in each cardiac chamber category, we focused on those bound by the estrogen receptor (ER), NKX homeodomain, and the HAND family. The ER-binding site was found to be over-represented in genes preferentially dysregulated in the atria; the NKX homeodomain site was enriched in the preferential ventricular cohort, and the HAND-binding site was found in genes dysregulated in both chambers. The ER is known to have a protective effect on the heart, and differences in cardiac chamber expression of ER isoforms (α and β) have been reported (34, 35). Members of the NKX and HAND family are core cardiac TFs required for proper chamber development (36, 37).
Transcriptional cooperativity between MEF2A and candidate co-factors
To test potential transcriptional cooperativity between MEF2A and the candidate TFs, we used the 1.5-kb proximal promoter of the Xirp2 (myomaxin and Xinβ) gene as our readout. Although this gene was not part of the differential gene set, it is an established and direct target of MEF2A and harbors multiple DNA-binding sites for these candidate TFs (Fig. 6A) (38) enabling us to examine the functional interaction among these cardiac TFs.
Figure 6.

Transcriptional cofactors display cooperative activation with MEF2A. A, schematic of the pGL3basic-1.5kb-Xirp2-Luciferase construct (top) and the pGL3basic-0.3kb-Xirp2-Luciferase construct (bottom). The functional MEF2 (−75), and predicted EREF-, HAND-, and NKXH-binding sites position are shown relative to the luciferase reporter gene. B, activation of the 1.5-kb Xirp2-luciferase reporter in HEK293T cells by MEF2A (top, middle, bottom graphs), ERα and -β expression constructs (top), NKX2.5 expression construct (middle), or HAND expression constructs (bottom). C, activation of the 0.3-kb Xirp2-luciferase reporter in NRVMS by MEF2A (top, middle, bottom), ERα and -β expression constructs (top), NKX2.5 expression construct (middle), or HAND expression constructs (bottom). Fold changes are normalized to reporter-alone conditions in each graph. Error bars represent standard deviation; n.s., not significant; *, p < 0.05; **, p < 0.01; ***, p < 0.001.
As shown in Fig. 6B, the 1.5-kb Xirp2-luciferase reporter was significantly activated by MEF2A alone as expected. This reporter was also activated by ERβ (upper), Nkx2.5 (middle), and HAND2 (lower) individually. By contrast, the 1.5-kb Xirp2 reporter was not significantly activated by ERα (upper graph) or HAND1 (lower graph) alone. However, co-transfection of MEF2A with ERβ, Nkx2.5, and HAND2, and to a lesser extent HAND1, resulted in significant cooperative activity.
To demonstrate that MEF2A and these TFs function cooperatively in cardiac muscle, we performed this analysis in neonatal rat ventricular myocytes (NRVMs). Because the 1.5-kb Xirp2-luciferase reporter showed an exceedingly high basal activity in NRVMs in the absence of any transfected TF, we used a 0.3-kb Xirp2-luciferase reporter (Fig. 6A, lower schematic). This minimal promoter, which contains the conserved −75 MEF2 site and lacks all but a single predicted binding site for ER, Nkx2.5, and HAND, displayed lower basal activity in NRVMs (data not shown). ERα, Nkx2.5, HAND1, or HAND2 individually did not significantly activate the 0.3-kb Xirp2-luciferase reporter, whereas ERβ alone had a modest but significant effect on the reporter (Fig. 6C). Co-transfection of MEF2A with ERβ, Nkx2.5, and HAND2 and to a lesser extent ERα and HAND1 resulted in significant cooperative activation. It is interesting to note that in both HEK293T cells and NRVMs, ERβ and HAND2 displayed higher cooperative activity compared with ERα and HAND1 protein isoforms. These results demonstrate that MEF2A interacts with those TFs predicted to have enriched binding sites in the preferential dysregulated gene sets. In the future it would be interesting to evaluate potential atrial and ventricular chamber-specific gene regulation between MEF2A and the candidate co-regulators.
Discussion
Molecularly defining the mechanisms by which atrial and ventricular cardiomyocytes develop their distinct cellular and functional properties is essential for refining approaches to promote specific myocyte lineages from precursor populations, including embryonic and induced pluripotent stem cells, and for directed reprogramming of cardiomyocytes. In this report we demonstrate that genes uniformly expressed throughout the adult heart are differentially sensitive to the loss of MEF2A. This preferential dysregulation resulted in distinct cell signaling perturbations in each of the cardiac chambers of MEF2A KO mice making the mutant phenotype far more complex than previously recognized. Taken together, our results suggest that proper chamber gene regulation in the heart is not only driven by lineage-restricted TFs but also by broadly expressed cardiac TFs that impart robustness to gene expression patterns in myocytes within each compartment.
A number of cardiac genes display dynamic expression patterns in development, reflecting the spatiotemporal activity of multiple enhancers (16, 39–40). Although the activity of a given enhancer may be restricted in the heart, their collective activity drives uniform expression throughout the heart. Perhaps the preferential dysregulation of MEF2A target genes reflects region-specific enhancers embedded within the regulatory regions of these uniformly expressed genes that are dependent on MEF2 transcriptional activity. MEF2 has been implicated in chamber-restricted gene expression. Ventricular expression of a minimal enhancer of the Mlc2v gene in the embryonic mouse heart was shown to be dependent on a MEF2 site (19). In addition, the atrium-enriched ANF gene has been shown to be co-regulated by GATA4 and MEF2 (20) and MEF2A and Pitx2 (21). MEF2C is required for the proper regulation of enhancers of the BOP and Hcn4 genes in the right ventricle and atrioventricular conduction system, respectively (22, 23). Finally, although not functionally tested, the atrium-enriched Mlc2a and sarcolipin genes harbor candidate MEF2 sites in their upstream regulatory regions (15). Taken together, these observations reinforce the notion that MEF2 proteins are necessary to coordinate proper cardiac chamber gene expression.
It is curious that there was a greater number of dysregulated genes in the atria even though MEF2A mutant hearts have a prominent ventricular phenotype as described previously (24). Despite the relatively small numbers of dysregulated genes in the ventricular chambers, it is possible that this particular cohort, based on their cellular function, triggers a more readily observable pathophysiological phenotype in this compartment. Alternatively, the defect(s) caused by the collection of dysregulated atrial genes may be subtle or the atrial chambers may be more resilient to cellular perturbations stemming from aberrant gene regulation. For example, cellular adhesion was among the top dysregulated pathways in MEF2A KO atria. We examined the localization of N-cadherin, a prototypical adhesion molecule important in the heart (42) in adult MEF2A KO atria, but did not find significant differences in its localization compared with wild-type or between KO atria and ventricles. However, the activity of FAK, a downstream effector of integrin signaling, was significantly and preferentially down-regulated in mutant atria. Integrin signaling has been implicated in the development of fibrosis in heart disease (43). We examined fibrosis in MEF2A KO hearts but found the extent of these lesions to be highly variable and not significantly different between atria and ventricles (data not shown). Perhaps subjecting these mutant animals to insults that promote fibrosis in the heart may ultimately reveal chamber-specific susceptibility to this particular pathology.
MSP-RON signaling emerged as the top canonical pathway among the ventricular gene set. MSP-RON is a receptor tyrosine kinase pathway that functions prominently in cancer and in inflammation (28, 29). Curiously, the MSP-RON signaling pathway does not have a dedicated cohort of cytoplasmic transducers but instead modulates the activity of effectors associated with other signal transduction cascades such as PI3K, inducible nitric-oxide synthase, and TRAF6 (29). TRAF6 is activated by the Toll-like receptor to promote inflammation, whereas MSP-RON signaling antagonizes this activity through an LKB1–AMPK–SHP transduction cascade (44). Although the mechanism remains unclear, reduced levels of TRAF6 in MEF2A KO ventricles suggest attenuation of pro-inflammatory pathways in this cardiac compartment. Further analysis of MEF2A mutant mice in the context of myocardial infarction, which triggers a significant immune response (45), may deepen our molecular understanding of inflammation in heart disease and chamber-specific myocardial remodeling.
The identification of binding sites for the NKX and HAND family of transcription factors supports prior genetic and molecular evidence linking these TFs to the MEF2 pathway. The enrichment of Nkx-binding sites in genes with preferential dysregulation in MEF2A KO ventricular chambers is consistent with the known genetic interaction of MEF2C and Nkx2.5 in ventricular morphogenesis (46). Our results raise the possibility that a regulatory switch occurs between MEF2 protein isoforms and Nkx2.5 to spatially and temporally regulate genes in the developing and postnatal heart. In a similar fashion, MEF2A and MEF2C were each shown to interact with HAND proteins (47). HAND proteins display an intricate expression pattern in the developing heart. HAND1 is expressed in the myocardial cuff on the cardiac outflow tract. HAND2 is expressed in myocardium, endocardium, and epicardium as well as the underlying pharyngeal mesoderm of the second heart field. Thus, over-representation of the HAND E-box motif in genes that are dysregulated in both chambers of MEF2A KO hearts is consistent with the complementary spatiotemporal expression patterns of these factors. Presumably, MEF2A interacts with a distinct HAND protein isoform in each cardiac chamber.
Expression of estrogen receptor isoforms has been described in the heart of adult rodents. In rats, ERα mRNA is more abundant in atria compared with ventricles, whereas ERβ is uniformly expressed (48). However, in mice, ERα protein appears to be more abundant in ventricles, but similar to the rat study ERβ is expressed in both chambers. These expression patterns do not strictly correlate with the enrichment of ER-binding sites in the preferential atrial dysregulated genes. This suggests that additional mechanisms beyond MEF2 and ER cooperativity are required for the observed chamber sensitivity of these genes.
The differential chamber sensitivity of cardiac genes may provide a mechanism by which the dysfunctional heart regionally reprograms gene expression according to the specific insult. In this instance, modulation of MEF2 activity through preferential interaction with co-regulators would drive a chamber-specific gene regulatory response as part of the pathological remodeling of the heart. Along these lines, a MEF2-dependent transgene, a reporter that responds to all mammalian MEF2 isoforms, showed preferential atrial activation of the reporter when mice were subjected to various cardiac insults such as isoproterenol, angiotensin II, and thyroid hormone (30). The immediate early and widely expressed bZip transcription factor ATF3 was also shown to be preferentially up-regulated in the atrial chambers of mice treated with angiotensin II, whereas adrenergic stimulation induced ATF3 similarly in all chambers (49). Based on these observations, it is likely that additional TFs in the heart display differential chamber activity in response to specific pathological stimuli.
This study has revealed that genes uniformly expressed in the heart exhibit preferential chamber sensitivity to the loss of a broadly expressed TF. Differences in gene expression in the cardiac chambers are often overlooked when analyzing postnatal mutant phenotypes of widely expressed factors. Typically, only the ventricles are used as the primary source of RNA and protein for molecular characterization of a phenotype. It is assumed that a phenotype observed in the ventricles will be generally applicable to the entire heart. Thus, greater attention to potential differences in the chambers may lead to a deeper understanding of the mechanisms of region-specific cardiomyocyte function. This information could be used to develop therapies that selectively target pathways in those chambers susceptible to structural damage or dysfunction in diseases such as atrial fibrillation or arrhythmogenic right ventricular cardiomyopathy.
Experimental procedures
RNA isolation
Atrial and ventricular chambers were separated from hearts of adult wild-type and MEF2A KO mice (2 months of age), and total RNA was isolated using TRIzol (Invitrogen). MEF2A KO mice were maintained in a C57BL6/129Sv genetic background as described previously (24).
Microarray and expression analysis
Total RNA was isolated from wild-type and knock-out cardiac chambers separately (WT atria, WT ventricles, KO atria, and KO ventricles) and pooled (n = 7 per pool). Samples were applied to individual GeneChip® gene 1.0 ST array system for mouse (Affymetrix) arrays. A 1.5-fold difference in KO samples compared with WT was used to sort dysregulated genes into one of the three categories: preferential atrial, preferential ventricular, or dysregulated in both atria and ventricles. To distinguish chamber-enriched genes from uniformly expressed genes in WT hearts, a minimal enrichment cutoff was applied at 2.0-fold. Microarray data are available on NCBI (GEO accession GSE95364).
Reverse transcriptase-PCR and quantitative RT-PCR
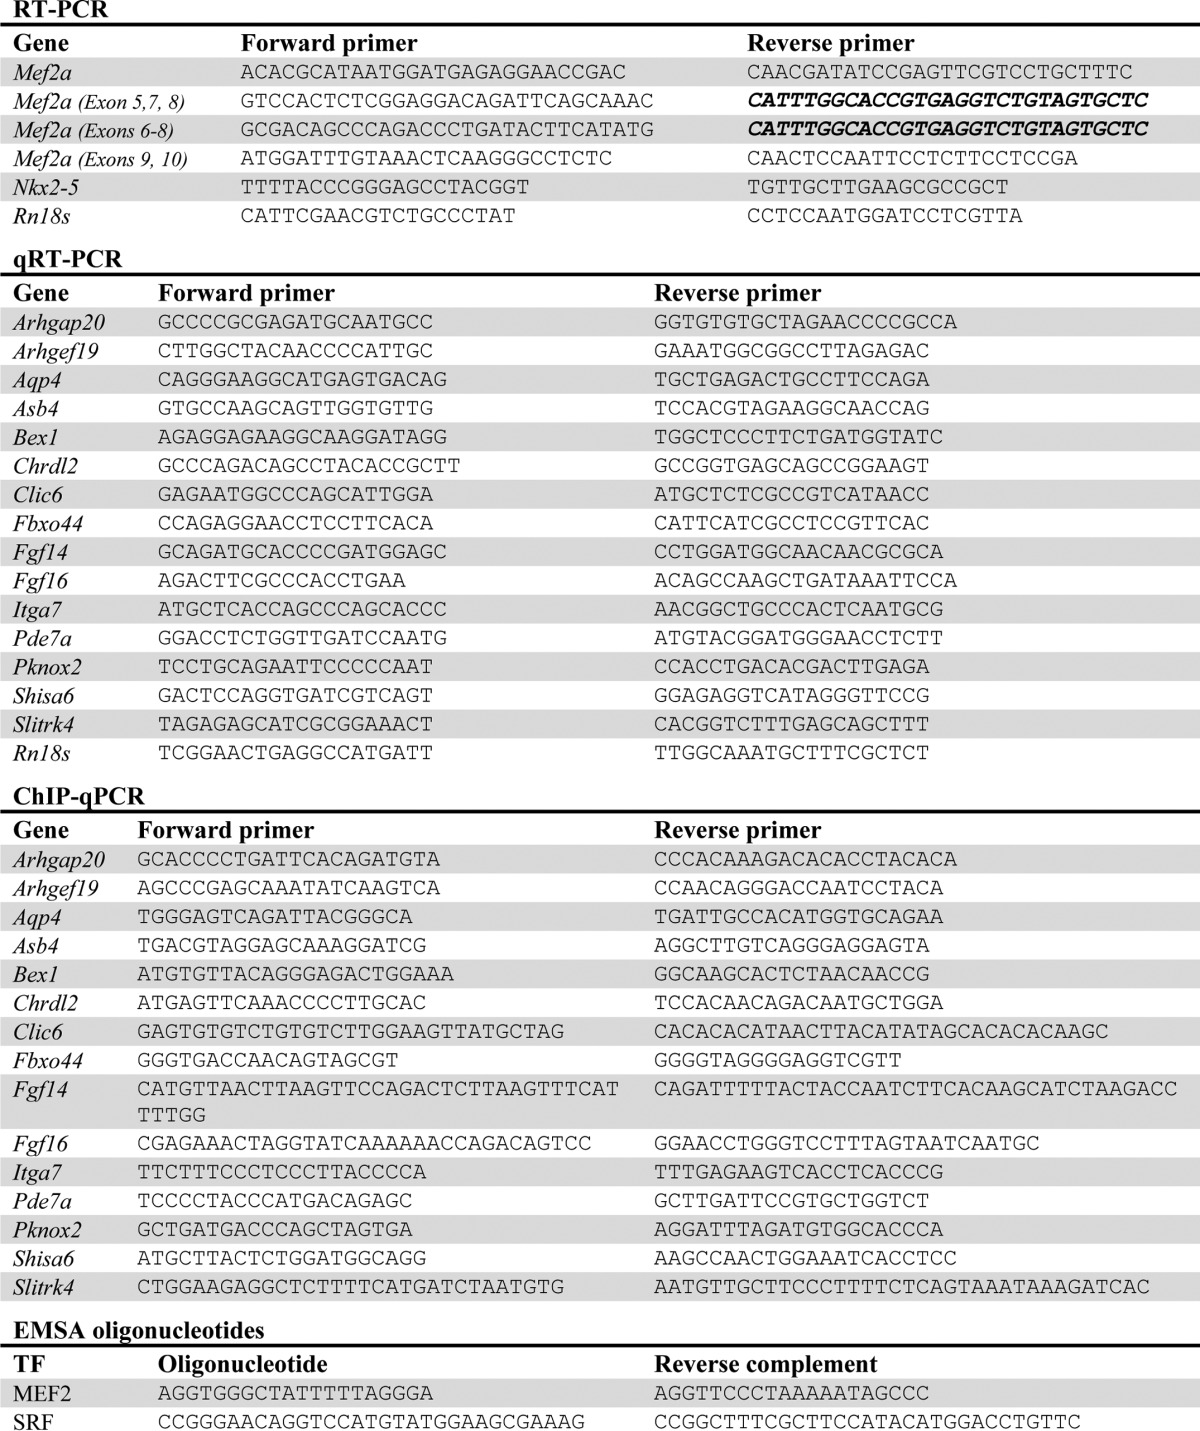
Complementary DNA (cDNA) was synthesized from total RNA using Moloney murine leukemia virus reverse transcriptase (Promega), and cDNA levels were analyzed by PCR or quantitative RT-PCR (qRT-PCR). Quantitative RT-PCR was performed in triplicate wells using SYBR® Green master mix (Applied Biosystems) with the 7900HT sequence detection system (Applied Biosystems). The primers used can be found in Table 3. qRT-PCR data were analyzed using the ΔΔCT method.
Table 3.
List of primers used in this study
A list of RT-PCR and quantitative RT-PCR primers used for expression analysis and oligonucleotides used for gel electrophoretic shift assays is shown. All sequences are listed from 5' to 3'. Sequences listed in bold font indicate identical primers.
Bioinformatics analyses
Top canonical pathways were determined for all three categories of dysregulated genes using the Ingenuity Pathway Analysis (Qiagen) and DAVID software (https://david.ncifcrf.gov/). Transcription factor enrichment analysis was performed on the proximal promoter region of genes preferentially dysregulated in each chamber using MatInspector (Genomatix). Analysis was limited to regions within 50 bp of predicted MEF2-binding sites to enrich for potential transcription factor co-regulator interactions. The analytical background was composed of a cross-section of genomic promoter sequences to discriminate between enriched motifs and generic promoter regions. Resulting enriched motifs were sorted by Z-score, with a Z-score greater than positive 2.0 being considered significantly enriched. The top 10 transcription factor families in each dysregulated gene set were compiled and arranged according to binding site enrichment pattern in each set.
Immunohistochemical analysis
Dissected whole hearts were embedded and frozen in Tissue-Tek O.C.T. Compound (Sakura Finetek) using a dry ice bath containing isopentane. Sixteen-micron cryosections (Leica CM 1850) were placed on charged slides, fixed in PHEM (4% formaldehyde, 60 mm PIPES, 20 mm HEPES, 10 mm EGTA, 2 mm MgCl2, 3% sucrose, pH 7.2), and then permeabilized in 0.3% TritonTM X-100, 1× PBS prior to blocking in 10% BSA, 0.3% TritonTM X-100, 1× PBS. Sections were incubated with anti-MEF2A (1:200; Santa Cruz Biotechnology), anti-PECAM (CD31; 1:200; R&D Systems), anti-WT1 (1:200; Santa Cruz Biotechnology), Alexa Fluor 568® goat anti-rabbit (1:200; Invitrogen), Alexa Fluor 488® donkey anti-goat (1:200; Invitrogen), and Alexa Fluor 488® goat anti-mouse (1:200; Invitrogen) antibodies in dilution buffer (1% BSA, 0.3% TritonTM X-100, 1× PBS). Sections were mounted using media containing DAPI (Vectashield). Image fluorescence intensities were quantified using ImageJ.
Immunoblot analysis
Atrial and ventricular tissue from adult wild-type and MEF2A KO mice were separated and mechanically homogenized in lysis buffer (0.1% Nonidet P-40, 50 mm HEPES, 250 mm NaCl, 5 mm EDTA, protease inhibitors, Roche Applied Science), and supernatants were obtained by centrifugation. Lysates were electrophoresed on 10% SDS-polyacrylamide gels and then transferred onto a PVDF membrane (Bio-Rad). Antibodies used in this analysis include the following: anti-pFAK (1:500; Santa Cruz Biotechnology); anti-FAK (1:1,000; Santa Cruz Biotechnology); anti-TRAF6 (1:1,000; Santa Cruz Biotechnology); anti-MEF2A (1:2,000; Santa Cruz Biotechnology); anti-GAPDH (1:1,000; Santa Cruz Biotechnology); anti-histone H3 (1:5,000; Cell Signaling Technology); horseradish peroxidase conjugated goat anti-rabbit (1:10,000; PerkinElmer Life Sciences); and horseradish peroxidase conjugated goat anti-mouse (1:10,000; PerkinElmer Life Sciences). Samples probed for histone H3 were sonicated using Digital Sonifier 450 (Branson) prior to centrifugation.
Electrophoretic mobility shift assay
Tissue lysates from wild-type and knock-out chambers were used for gel-shift assays and incubated with 32P-radiolabeled, double-stranded oligonucleotides containing a MEF2-binding site from the mouse c-jun promoter, or SRF-binding site from the rat Ncx promoter (oligonucleotide sequences are listed in Table 3). Gel-shift reactions were electrophoresed on 5% non-denaturing polyacrylamide gels. Dried gels were exposed on a storage phosphor screen (Amersham Biosciences).
Luciferase reporter constructs
The mouse Itga7 and Bex1 upstream genomic regions (∼500 bp) containing predicted MEF2-binding sites (−2610 to −2102 and −3090 to −2587, respectively) were cloned into pGL3 promoter (Promega).
Cell culture, transfections, and luciferase reporter assays
HEK293T cells were maintained in Dulbecco's modified Eagle's medium (DMEM) with 10% fetal bovine serum (FBS) and 1× penicillin/streptomycin/glutamine (Invitrogen). Primary NRVMs were isolated as described previously (41). HEK293T cells were transfected using 1 mg/ml polyethyleneimine, and NRVMs were transfected using FuGENE® 6 (Promega). Cells extracts were collected using 1× cell culture lysis buffer and assayed for luciferase activity (Promega). Luciferase activity values were normalized to β-galactosidase activity values, except for Nkx2.5 transfections where total protein values (Bradford reagent, Bio-Rad) were used instead. Plasmids used in these assays include the following: pGL3b-1.5kb-Xirp2-luciferase; pGL3b-0.3kb-Xirp2-luciferase; pGL3p-Itga7-luciferase; pGL3p-Bex1-luciferase; pCMV-β-galactosidase; pCDNA1-MEF2A; pCGN-HA-Nkx2.5; pCDNA3-HAND1; pCDNA3-HAND2; pCR3.1-ERα; and pCMV-3Tag-9-ERβ.
Chromatin immunoprecipitation
Chromatin was immunoprecipitated from whole hearts using 5 μg of protein-G beads (Santa Cruz Biotechnology) and 3 μg of the anti-MEF2A antibody (Santa Cruz Biotechnology). For quantitative PCR (qPCR), 1 μl of phenol/chloroform-extracted, immunoprecipitated chromatin or 1% input were used. For each primer pair, immunoprecipitated chromatin signal was adjusted against the respective 1% input signal. Primer sequences are listed in Table 3.
Statistical analysis
All numerical quantification is representative of the mean ± S.D. of at least three independently performed experiments. Statistically significant differences between two populations of data were determined using two-tailed Student's t test. p values of <0.05 were considered to be statistically significant.
Author contributions
J. L. M. and F. J. N. designed the study and wrote the paper. J. L. M. performed and analyzed the experiments in Figs. 1–6. Both authors reviewed the results and approved the final version of the manuscript.
Acknowledgments
We thank members of the Naya laboratory for critical reading of the manuscript. We are grateful to Anthony Firulli (Indiana University School of Medicine) for the HAND expression plasmids, Sang Jun Han (Baylor College of Medicine) for the ERα and ERβ expression plasmids, and William Pu for PECAM and WT1 antibodies (Boston Children's Hospital). We also thank Nicole Clement-Gomez (Boston University SURF; Clarkson University) for excellent technical assistance.
This work was supported by National Institutes of Health Grant HL73304 (to F. J. N.) and Boston University Bioinformatics CTSI Grant U54-TR001012. The authors declare that they have no conflicts of interest with the contents of this article. The content is solely the responsibility of the authors and does not necessarily represent the official views of the National Institutes of Health.
- FAK
- focal adhesion kinase
- SRF
- serum-response factor
- ER
- estrogen receptor
- TF
- transcription factor
- qPCR
- quantitative PCR
- NRVN
- neonatal rat ventricular myocyte
- MSP-RON
- macrophage-stimulating protein–recepteur d'origine nantais
- SRF
- serum-response factor.
References
- 1. Buckingham M., Meilhac S., and Zaffran S. (2005) Building the mammalian heart from two sources of myocardial cells. Nat. Rev. Genet. 6, 826–835 [DOI] [PubMed] [Google Scholar]
- 2. Moorman A. F., and Christoffels V. M. (2003) Cardiac chamber formation: development, genes, and evolution. Physiol. Rev. 83, 1223–1267 [DOI] [PubMed] [Google Scholar]
- 3. Tabibiazar R., Wagner R. A., Liao A., and Quertermous T. (2003) Transcriptional profiling of the heart reveals chamber-specific gene expression patterns. Circ. Res. 93, 1193–1201 [DOI] [PubMed] [Google Scholar]
- 4. Barth A. S., Merk S., Arnoldi E., Zwermann L., Kloos P., Gebauer M., Steinmeyer K., Bleich M., Kääb S., Pfeufer A., Uberfuhr P., Dugas M., Steinbeck G., and Nabauer M. (2005) Functional profiling of human atrial and ventricular gene expression. Pflugers Arch. 450, 201–208 [DOI] [PubMed] [Google Scholar]
- 5. Ng S. Y., Wong C. K., and Tsang S. Y. (2010) Differential gene expressions in atrial and ventricular myocytes: insights into the road of applying embryonic stem cell-derived cardiomyocytes for future therapies. Am. J. Physiol. Cell Physiol. 299, C1234–C1249 [DOI] [PubMed] [Google Scholar]
- 6. Bruneau B. G., Bao Z. Z., Fatkin D., Xavier-Neto J., Georgakopoulos D., Maguire C. T., Berul C. I., Kass D. A., Kuroski-de Bold M. L., de Bold A. J., Conner D. A., Rosenthal N., Cepko C. L., Seidman C. E., and Seidman J. G. (2001) Cardiomyopathy in Irx4-deficient mice is preceded by abnormal ventricular gene expression. Mol. Cell. Biol. 21, 1730–1736 [DOI] [PMC free article] [PubMed] [Google Scholar]
- 7. Singh M. K., Christoffels V. M., Dias J. M., Trowe M.-O., Petry M., Schuster-Gossler K., Bürger A., Ericson J., and Kispert A. (2005) Tbx20 is essential for cardiac chamber differentiation and repression of Tbx2. Development. 132, 2697–2707 [DOI] [PubMed] [Google Scholar]
- 8. Xin M., Small E. M., van Rooij E., Qi X., Richardson J. A., Srivastava D., Nakagawa O., and Olson E. N. (2007) Essential roles of the bHLH transcription factor Hrt2 in repression of atrial gene expression and maintenance of postnatal cardiac function. Proc. Natl. Acad. Sci. U.S.A. 104, 7975–7980 [DOI] [PMC free article] [PubMed] [Google Scholar]
- 9. Tessari A., Pietrobon M., Notte A., Cifelli G., Gage P. J., Schneider M. D., Lembo G., and Campione M. (2008) Myocardial Pitx2 differentially regulates the left atrial identity and ventricular asymmetric remodeling programs. Circ. Res. 102, 813–822 [DOI] [PubMed] [Google Scholar]
- 10. Wang J., Klysik E., Sood S., Johnson R. L., Wehrens X. H., and Martin J. F. (2010) Pitx2 prevents susceptibility to atrial arrhythmias by inhibiting left-sided pacemaker specification. Proc. Natl. Acad. Sci. U.S.A. 107, 9753–9758 [DOI] [PMC free article] [PubMed] [Google Scholar]
- 11. Wu S. P., Cheng C. M., Lanz R. B., Wang T., Respress J. L., Ather S., Chen W., Tsai S. J., Wehrens X. H., Tsai M. J., and Tsai S. Y. (2013) Atrial identity is determined by a COUP-TFII regulatory network. Dev. Cell 25, 417–426 [DOI] [PMC free article] [PubMed] [Google Scholar]
- 12. Paige S. L., Plonowska K., Xu A., and Wu S. M. (2015) Molecular regulation of cardiomyocyte differentiation. Circ. Res. 116, 341–353 [DOI] [PMC free article] [PubMed] [Google Scholar]
- 13. Später D., Hansson E. M., Zangi L., and Chien K. R. (2014) How to make a cardiomyocyte. Development 141, 4418–4431 [DOI] [PubMed] [Google Scholar]
- 14. Evans S. M., Yelon D., Conlon F. L., and Kirby M. L. (2010) Myocardial lineage development. Circ. Res. 107, 1428–1444 [DOI] [PMC free article] [PubMed] [Google Scholar]
- 15. Small E. M., and Krieg P. A. (2004) Molecular regulation of cardiac chamber-specific gene expression. Trends Cardiovasc. Med. 14, 13–18 [DOI] [PubMed] [Google Scholar]
- 16. Christoffels V. M., Burch J. B., and Moorman A. F. (2004) Architectural plan for the heart: early patterning and delineation of the chambers and the nodes. Trends Cardiovasc. Med. 14, 301–307 [DOI] [PubMed] [Google Scholar]
- 17. Potthoff M. J., and Olson E. N. (2007) MEF2: a central regulator of diverse developmental programs. Development 134, 4131–4140 [DOI] [PubMed] [Google Scholar]
- 18. Desjardins C. A., and Naya F. J. (2016) The function of the MEF2 family of transcription factors in cardiac development, cardiogenomics, and direct reprogramming. J. Cardiovasc. Dev. Dis. 3, 26. [DOI] [PMC free article] [PubMed] [Google Scholar]
- 19. Ross R. S., Navankasattusas S., Harvey R. P., and Chien K. R. (1996) An HF-1a/HF-1b/MEF-2 combinatorial element confers cardiac ventricular specificity and established an anterior-posterior gradient of expression. Development 122, 1799–1809 [DOI] [PubMed] [Google Scholar]
- 20. Morin S., Charron F., Robitaille L., and Nemer M. (2000) GATA-dependent recruitment of MEF2 proteins to target promoters. EMBO J. 19, 2046–2055 [DOI] [PMC free article] [PubMed] [Google Scholar]
- 21. Toro R., Saadi I., Kuburas A., Nemer M., and Russo A. F. (2004) Cell-specific activation of the atrial natriuretic factor promoter by PITX2 and MEF2A. J. Biol. Chem. 279, 52087–52094 [DOI] [PubMed] [Google Scholar]
- 22. Phan D., Rasmussen T. L., Nakagawa O., McAnally J., Gottlieb P. D., Tucker P. W., Richardson J. A., Bassel-Duby R., and Olson E. N. (2005) BOP, a regulator of right ventricular heart development, is a direct transcriptional target of MEF2C in the developing heart. Development 132, 2669–2678 [DOI] [PubMed] [Google Scholar]
- 23. Vedantham V., Evangelista M., Huang Y., and Srivastava D. (2013) Spatiotemporal regulation of an Hcn4 enhancer defines a role for Mef2c and HDACs in cardiac electrical patterning. Dev. Biol. 373, 149–162 [DOI] [PMC free article] [PubMed] [Google Scholar]
- 24. Naya F. J., Black B. L., Wu H., Bassel-Duby R., Richardson J. A., Hill J. A., and Olson E. N. (2002) Mitochondrial deficiency and cardiac sudden death in mice lacking the MEF2A transcription factor. Nat. Med. 8, 1303–1309 [DOI] [PubMed] [Google Scholar]
- 25. Ewen E. P., Snyder C. M., Wilson M., Desjardins D., and Naya F. J. (2011) The Mef2A transcription factor coordinately regulates a costamere gene program in cardiac muscle. J. Biol. Chem. 286, 29644–29653 [DOI] [PMC free article] [PubMed] [Google Scholar]
- 26. Mitra S. K., and Schlaepfer D. D. (2006) Integrin-regulated FAK-Src signaling in normal and cancer cells. Curr. Opin. Cell Biol. 18, 516–523 [DOI] [PubMed] [Google Scholar]
- 27. Franchini K. G. (2012) Focal adhesion kinase–the basis of local hypertrophic signaling domains. J. Mol. Cell. Cardiol. 52, 485–492 [DOI] [PubMed] [Google Scholar]
- 28. Yao H. P., Zhou Y. Q., Zhang R., and Wang M. H. (2013) MSP-RON signalling in cancer: pathogenesis and therapeutic potential. Nat. Rev. Cancer 13, 466–481 [DOI] [PubMed] [Google Scholar]
- 29. Li J., Chanda D., Shiri-Sverdlov R., and Neumann D. (2015) MSP: an emerging player in metabolic syndrome. Cytokine Growth Factor Rev. 26, 75–82 [DOI] [PubMed] [Google Scholar]
- 30. Zhao X.-S., Gallardo T. D., Lin L., Schageman J. J., and Shohet R. V. (2002) Transcriptional mapping and genomic analysis of the cardiac atria and ventricles. Physiol. Genomics 12, 53–60 [DOI] [PubMed] [Google Scholar]
- 31. Yu Y. T., Breitbart R. E., Smoot L. B., Lee Y., Mahdavi V., and Nadal-Ginard B. (1992) Human myocyte-specific enhancer factor 2 comprises a group of tissue-restricted MADS box transcription factors. Genes Dev. 6, 1783–1798 [DOI] [PubMed] [Google Scholar]
- 32. Snyder C. M., Rice A. L., Estrella N. L., Held A., Kandarian S. C., and Naya F. J. (2013) MEF2A regulates the Gtl2-Dio3 microRNA mega-cluster to modulate WNT signaling in skeletal muscle regeneration. Development 140, 31–42 [DOI] [PMC free article] [PubMed] [Google Scholar]
- 33. Niu Z., Li A., Zhang S. X., and Schwartz R. J. (2007) Serum response factor micromanaging cardiogenesis. Curr. Opin. Cell Biol. 19, 618–627 [DOI] [PMC free article] [PubMed] [Google Scholar]
- 34. van Rooij E., Fielitz J., Sutherland L. B., Thijssen V. L., Crijns H. J., Dimaio M. J., Shelton J., De Windt L. J., Hill J. A., and Olson E. N. (2010) Myocyte enhancer factor 2 and class ii histone deacetylases control a gender-specific pathway of cardioprotection mediated by the estrogen receptor. Circ. Res. 106, 155–165 [DOI] [PMC free article] [PubMed] [Google Scholar]
- 35. Lizotte E., Grandy S. A., Tremblay A., Allen B. G., and Fiset C. (2009) Expression, distribution and regulation of sex steroid hormone receptors in mouse heart. Cell. Physiol. Biochem. 23, 75–86 [DOI] [PubMed] [Google Scholar]
- 36. Tanaka M., Chen Z., Bartunkova S., Yamasaki N., and Izumo S. (1999) The cardiac homeobox gene Csx/Nkx2.5 lies genetically upstream of multiple genes essential for heart development. Development 126, 1269–1280 [DOI] [PubMed] [Google Scholar]
- 37. Srivastava D., Thomas T., Lin Q., Kirby M. L., Brown D., and Olson E. N. (1997) Regulation of cardiac mesodermal and neural crest development by the bHLH transcription factor, dHAND. Nat. Genet. 16, 154–160 [DOI] [PubMed] [Google Scholar]
- 38. Huang H. T., Brand O. M., Mathew M., Ignatiou C., Ewen E. P., McCalmon S. A., and Naya F. J. (2006) Myomaxin is a novel transcriptional target of MEF2A that encodes a Xin-related α-actinin-interacting protein. J. Biol. Chem. 281, 39370–39379 [DOI] [PubMed] [Google Scholar]
- 39. Dupays L., and Mohun T. (2017) Spatiotemporal regulation of enhancers during cardiogenesis. Cell. Mol. Life Sci. 74, 257–265 [DOI] [PMC free article] [PubMed] [Google Scholar]
- 40. Rana M. S., Christoffels V. M., and Moorman A. F. (2013) A molecular and genetic outline of cardiac morphogenesis. Acta Physiol. 207, 588–615 [DOI] [PubMed] [Google Scholar]
- 41. Desjardins C. A., and Naya F. J. (2017) Antagonistic regulation of cell cycle and differentiation gene programs in neonatal cardiomyocytes by homologous MEF2 transcription factors. J. Biol. Chem. 292, 10613–10629 [DOI] [PMC free article] [PubMed] [Google Scholar]
- 42. Vite A., and Radice G. L. (2014) N-cadherin/catenin complex as a master regulator of intercalated disc function. Cell Commun. Adhes. 21, 169–179 [DOI] [PMC free article] [PubMed] [Google Scholar]
- 43. Chen C., Li R., Ross R. S., and Manso A. M. (2016) Integrins and integrin-related proteins in cardiac fibrosis. J. Mol. Cell. Cardiol. 93, 162–174 [DOI] [PMC free article] [PubMed] [Google Scholar]
- 44. Yuk J. M., Shin D. M., Lee H. M., Kim J. J., Kim S. W., Jin H. S., Yang C. S., Park K. A., Chanda D., Kim D. K., Huang S. M., Lee S. K., Lee C. H., Kim J. M., Song C. H., et al. (2011) The orphan nuclear receptor SHP acts as a negative regulator in inflammatory signaling triggered by Toll-like receptors. Nat. Immunol. 12, 742–74751 [DOI] [PubMed] [Google Scholar]
- 45. Frangogiannis N. G. (2014) The inflammatory response in myocardial injury, repair, and remodelling. Nat. Rev. Cardiol. 11, 255–265 [DOI] [PMC free article] [PubMed] [Google Scholar]
- 46. Vincentz J. W., Barnes R. M., Firulli B. A., Conway S. J., and Firulli A. B. (2008) Cooperative interaction of Nkx2.5 and Mef2c transcription factors during heart development. Dev. Dyn. 237, 3809–3819 [DOI] [PMC free article] [PubMed] [Google Scholar]
- 47. Morin S., Pozzulo G., Robitaille L., Cross J., and Nemer M. (2005) MEF2-dependent recruitment of the HAND1 transcription factor results in synergistic activation of target promoters. J. Biol. Chem. 280, 32272–32278 [DOI] [PubMed] [Google Scholar]
- 48. Jankowski M., Rachelska G., Donghao W., McCann S. M., and Gutkowska J. (2001) Estrogen receptors activate atrial natriuretic peptide in the rat heart. Proc. Natl. Acad. Sci. U.S.A. 98, 11765–11770 [DOI] [PMC free article] [PubMed] [Google Scholar]
- 49. Hasin T., Elhanani O., Abassi Z., Hai T., and Aronheim A. (2011) Angiotensin II signaling up-regulates the immediate early transcription factor ATF3 in the left but not the right atrium. Basic Res. Cardiol. 106, 175–187 [DOI] [PMC free article] [PubMed] [Google Scholar]