

Abstract
The interface between the neural retina and the retinal pigment epithelium (RPE) is critical for several processes, including visual pigment regeneration and retinal attachment to the RPE. One of its most important functions is the exchange of metabolites between the photoreceptors and RPE because photoreceptor cells have very high energy demands, largely satisfied by oxidative metabolism. The riboflavin (RF) cofactors, flavin adenine dinucleotide (FAD) and flavin mononucleotide (FMN), are two key cofactors involved in oxidative metabolism. We have previously shown that retbindin is a photoreceptor-specific RF-binding protein exclusively expressed in the rods and present in the interphotoreceptor matrix at the interface between the RPE and photoreceptor outer segments. Here, we show that retbindin ablation in mice causes a retinal phenotype characterized by time- and dose-dependent declines in rod and cone photoreceptor functions as early as 120 days of age. Whereas minor retinal ultrastructural defects were observed at all ages examined, a significant decline occurred in photoreceptor nuclei at 240 days of age (∼36.8% rods and ∼19.9% cones). Interestingly, significant reductions in FAD and FMN levels were observed before the onset of degeneration (∼46.1% FAD and ∼45% FMN). These findings suggest that the reduced levels of these flavins result in the disruption of intracellular mechanisms, leading to photoreceptor cell death. Altogether, our results suggest that retbindin is a key player in the acquisition and retention of flavins in the neural retina, warranting future investigation into retbindin's role in photoreceptor cell death in models of retinal degenerative disorders.
Keywords: flavin adenine dinucleotide (FAD), flavin mononucleotide (FMN), retina, retinal degeneration, retinal metabolism, riboflavin, retinal extracellular matrix, flavoprotein, photoreceptor, retbindin
Introduction
The interface between the neural retina and the retinal pigment epithelium (RPE)4 is where outer segment (OS) phagocytosis, visual pigment regeneration, and retinal attachment to the RPE occur (1). Another important function of this interface is the exchange and acquisition of metabolites, such as glucose (2, 3), between the photoreceptors and RPE. This function is of utmost importance because photoreceptor cells have arguably the highest energy demands of any cell type (4–7). These energy demands are largely satisfied by oxidative metabolism, evidenced by the high oxygen consumption in the photoreceptor cell layer (4, 5). The riboflavin (RF) cofactors, flavin adenine dinucleotide (FAD) and flavin mononucleotide (FMN), are two key cofactors involved in oxidative metabolism. Although Y-79 retinoblastoma cells were shown to have a specialized carrier-mediated system for RF uptake, it is still unknown how the retina acquires and concentrates these metabolites (8). The retina concentrates flavins at levels much higher than those observed in the blood or other organs (9, 10). This is not surprising, given the high energy consumption of photoreceptors and the involvement of FAD in citric acid cycle (11). FAD is also needed as a redox cofactor in β-oxidation. This is of importance because the photoreceptor OSs contain large amounts of polyunsaturated fatty acids (12, 13). Given their importance and susceptibility to light, a mechanism for binding and protecting flavins at the interphotoreceptor matrix (IPM) must exist, as unbound flavins are reduced by light and subsequently cause lipid peroxidation of unsaturated fatty acids (14). This is best demonstrated by photoreceptor-specific cell death due to uncontrolled lipid peroxidation when excess RF is supplemented in the diet of mice (15). Conversely, when RF levels are decreased, known as ariboflavinosis, patients first report poor dim light vision and photosensitivity (16). Taken together, it is clear that flavins are needed at high levels but also must be tightly regulated to ensure proper retinal homeostasis.
We have previously shown that retbindin (Rtbdn) is an extracellular rod-expressed protein capable of binding RF in vitro (17), making Rtbdn a potential key player in photoreceptor flavin binding and acquisition. To understand the role Rtbdn plays in flavin regulation and the overall retinal homeostasis, we generated a Rtbdn knockout mouse model (Rtbdn−/−) by replacing the Rtbdn coding sequence with that of eGFP, thereby generating eGFP reporter protein under the control of the endogenous Rtbdn promoter. Using eGFP expression, we were able to confirm our previous findings that Rtbdn is indeed a rod-specific protein (17). The ablation of Rtbdn was associated with minor outer segment changes that caused a time- and dose-dependent decline in rod and cone function resulting from photoreceptor cell loss. Rtbdn−/− retinas displayed a significant decrease in the capacity to bind flavins, which resulted in abnormally low levels of FAD and FMN in the neural retina. These results show that Rtbdn plays a key role in regulating flavin levels in the retina.
Results
Rtbdn−/− retina lacks Rtbdn and expresses eGFP specifically in rod photoreceptors
We generated a knockout mouse line for Rtbdn along with eGFP knockin using the strategy demonstrated in Fig. 1A. To verify that our strategy to ablate Rtbdn expression was successful, we used a polyclonal anti-Rtbdn antibody that has been described previously (17). In our knockout strategy, we chose to replace Rtbdn coding sequences with that of eGFP to confirm our previous findings on the pattern of tissue specificity of Rtbdn expression (17). To verify whether Rtbdn is specific to the neural retina, we performed SDS-PAGE followed by immunoblot on protein extracts from various organs taken from postnatal day 30 (P30) Rtbdn−/− (Fig. 1B). The SDS was removed to renature eGFP, and the gel was then imaged to visualize native eGFP. Native eGFP expression was found exclusively in the neural retina and absent from all other tissues tested (Fig. 1B, top), indicating the specificity of Rtbdn promoter and that it is active only in the neural retina. This observation was further confirmed by immunoblotting with an anti-eGFP antibody (Fig. 1B, bottom). As shown in Fig. 1C (left), no Rtbdn is detected in four independent retinal extracts taken from Rtbdn−/− mice, whereas a single band at ∼30 kDa is seen in WT retinal extracts. Rtbdn levels were quantified in four independent retinal samples from P30 WT, Rtbdn+/− and Rtbdn−/− mice, and values were plotted relative to β-actin (Fig. 1C, right). As shown, the resulting reduction in the value of Rtbdn in Rtbdn+/− relative to that of WT is ∼50%, and this reduction was statistically significant using one-way ANOVA (p = 0.0002).
Figure 1.

Confirmation of eGFP knockin and Rtbdn knockout. A, schematic overview of Rtbdn knockout eGFP knockin strategy. The long homology arm (not drawn to scale) extends 5.48 kb to the ATG codon in exon 2. The short homology arm extends 2.13 kb to the TAG codon in exon 6. Neomycin resistance was used to positively select embryonic clones (via geneticin) and was bred out by crossing to FLPeR mice. B, native fluorescence of eGFP in protein extracts of different organs taken from P30 Rtbdn−/− mice and separated via SDS-polyacrylamide gel electrophoresis. Immunoblots with antibodies against β-actin and α-actin were used as loading controls. Anti-eGFP antibody was used to show eGFP expression only in the Rtbdn−/− neural retina. PECS, pigment epithelium, choroid, and sclera; N. Ret., neural retina. C, on the left is an immunoblot of four independent WT, Rtbdn+/−, and Rtbdn−/− neural retina lysates using the anti-Rtbdn antibody. β-Actin was used as a loading control. Right, scatter plot of Rtbdn levels from four independent samples per genotype presented as mean ± S.D. (error bars). Relative values were analyzed by one-way ANOVA to determine statistical significance (**, p < 0.001; ***, p < 0.0002; ****, p < 0.0001). D, retinal cross-sections of a P30 Rtbdn−/− retina showing native fluorescence of eGFP in green (left) and immunofluorescence with anti-cone arrestin antibody in red (middle E). A higher-magnification image is shown on the right. Scale bar, 10 μm. DAPI staining of nuclei is shown in blue. ONL, outer nuclear layer; INL, inner nuclear layer; GCL, ganglion cell layer; cArr, cone arrestin. E, cross-sections of P30 WT, Rtbdn+/−, and Rtbdn−/− retinas showing the expression pattern of Rtbdn. Staining for retinal degeneration slow (RDS) protein was used to highlight the OS. DAPI staining of nuclei is shown in blue.
To identify the retinal cell layer that expresses Rtbdn, native eGFP was visualized on frozen retinal sections taken from P30 Rtbdn−/− mice. Signal was exclusively observed in the photoreceptor cell layer (Fig. 1D, left), supporting our previous findings that Rtbdn is exclusively expressed by the rods (17). To confirm the lack of expression of Rtbdn by cone photoreceptors, co-localization of cone arrestin with native eGFP was investigated. As shown in Fig. 1D (middle and right), no co-localization of the two proteins was observed, suggesting that the Rtbdn promoter is not active in cones and it is specific to rods.
To further determine the pattern of localization in the absence of half the amount of Rtbdn, immunohistochemistry using anti-Rtbdn antibody was performed on retinal sections from P30 WT, Rtbdn+/−, and Rtbdn−/− mice. The pattern of labeling in the WT retina further confirms our previous observation that Rtbdn is predominantly localized to the tip of the rod OS, as evident from its apical localization relative to peripherin/rds (Fig. 1E, top left image) and around the inner segment (IS) and the cell body (Fig. 1E, top images). Similar localization, but at lower levels, is observed in the Rtbdn+/− retina (Fig. 1E, bottom left image), and no labeling is detected in Rtbdn−/− retina (Fig. 1E, bottom right image).
Rtbdn−/− and Rtbdn+/− retinas display a time- and dose-dependent decline in rod and cone function
To evaluate the functional consequence of ablating Rtbdn, we assessed the rod and cone functions of WT, Rtbdn+/−, and Rtbdn−/− retinas via electroretinography (ERG). Full-field scotopic (a single, 157-cd s/m2 flash) and photopic (25 successive 157-cd s/m2 flashes) ERG responses were comparable with that of age-matched WT at both P30 and P60 (Fig. 2B). However, at P120, ERG responses from Rtbdn−/− retinas exhibited a significant decrease in scotopic a-wave amplitudes (∼37.5%) and in photopic b-wave amplitude (∼25%) when compared with age-matched WT, suggesting a late onset retinal phenotype (Fig. 2B). This finding is of great interest because cone function declines simultaneously with that of rods, despite the fact that Rtbdn is exclusively expressed by the rods (Fig. 1) (17). This decline in Rtbdn−/− ERG response is progressive because by P240, we observed a ∼52.8% reduction in scotopic a-wave and a ∼32% reduction in photopic b-wave amplitudes when compared with age-matched WT (Fig. 2, A and B). Interestingly, at P240, the Rtbdn+/− retinas also exhibited a statistically significant decline (∼23%) in scotopic a-wave and photopic b-wave (∼20%) amplitudes when compared with age-matched WT. However, no significant changes were observed in Rtbdn+/− ERG responses at P120, indicating a dose-dependent effect.
Figure 2.

Rtbdn ablation leads to a time- and dose-dependent reduction in scotopic and photopic ERG amplitude. A, representative scotopic and photopic ERG waveforms for P240 WT, Rtbdn+/−, and Rtbdn−/− mice. B, mean values ± S.D. (error bars) of scotopic a- and b-wave amplitudes as a function of age (WT, n = 5; Rtbdn+/−, n = 6; Rtbdn−/−, n = 5). C, representative wave forms from WT and Rtbdn−/− retinas at P120. D, amplitude of the dark-adapted a-wave and b-wave plotted as a function of stimulus intensity.
Fig. 2C shows representative scotopic ERG responses at P120 of WT and Rtbdn−/− retinas in response to a subset of strobe-flash stimuli ranging from −4.0 to 1.8 log cd s/m2. At P60, Rtbdn−/− retinas displayed similar responses compared with WT retinas at all light intensities tested (data not shown). At P120, Rtbdn−/− scotopic responses at higher intensities were significantly reduced, as we have detected with a single 157-cd s/m2 flash (Fig. 2D). These data show that without Rtbdn, retinas display a time- and dose-dependent decrease in light-evoked responses of both rods and cones.
Ablation of Rtbdn leads to significant reduction in the number of rods and cones
To assess the causes of the decrease in ERG responses, we counted the number of photoreceptor nuclei in the outer nuclear layer of P60 and P240 Rtbdn−/−, Rtbdn+/− and WT. Whereas the number of photoreceptor nuclei in the Rtbdn+/− and Rtbdn−/− retinas were similar at P60 to that of WT (Fig. 3A), at P240, there was a significant reduction in the number of photoreceptors in the Rtbdn−/− (∼36.8%) and Rtbdn+/− (∼19.9%) retinas when compared with age-matched WT (Fig. 3B). This reduction was significant for all retinal regions evaluated except at the periphery. Because of the high number of rods in the photoreceptor cell layer, these images do not give an accurate representation of potential reduction in cone cell number. To count the number of cones, we stained WT, Rtbdn+/−, and Rtbdn−/− retinal flat mounts with peanut agglutinin (PNA) to mark the extracellular matrix surrounding cones (Fig. 4, A and B) or WT and Rtbdn−/− retinal flat mounts with cone arrestin to label the cone OSs (Fig. 4C). Again, no significant cell loss was observed at P60 (Fig. 4, A (top images) and B (left panel)). However, at P240, we observed a significant decrease in the number of cones in Rtbdn−/− (∼45%) and in Rtbdn+/− (∼23%) retinas (Fig. 4, A (bottom images) and B (right panel)). Similar results were obtained from P240 Rtbdn−/− when flat mounts were stained with anti-cone arrestin (Fig. 4C). These results demonstrate that the observed decrease in both scotopic and photopic ERG responses is a consequence of rod and cone photoreceptor loss, respectively.
Figure 3.

Rtbdn−/− and WT rod photoreceptor cell numbers are decreased at P240. Shown is a spider graph (top) depicting the average number ± S.D. (error bars) of rod photoreceptor nuclei measured in 410-μm window images taken at ×20 magnification and at increasing distance from each side of the optic nerve head at P60 (A) and P240 (B) (n = 4 eyes/genotype). Bottom panels, representative images of the outer nuclear layers of retinal section taken from P60 and 240 WT, Rtbdn+/−, and Rtbdn−/− retinas. PR, photoreceptor; ONH, optic nerve head; ONL, outer nuclear layer. Scale bar, 10 μm. ***, p < 0.001; **, p < 0.01; *, p < 0.1; ns, not significant.
Figure 4.

Rtbdn−/− and WT cone photoreceptor cell numbers are decreased at P240. A, representative images of P60 and 240 WT, Rtbdn+/−, and Rtbdn−/− PNA-labeled retinal flat mounts. B, scatter plot representation of the number ± S.D. (error bars) of cone photoreceptors in 0.168-mm2 areas taken at ×20 magnification from the central regions of P60 and P240 retinas of the indicated genotypes. C, left, representative images taken from the central regions of P240 WT and Rtbdn−/− cone arrestin-labeled flat mounts. Right, scatter plot representation of the number ± S.D. of cone photoreceptors in 0.02-mm2 areas taken at ×40 magnification from the central regions of P240 retinas of the indicated genotypes. PR, photoreceptor; ONH, optic nerve head; ONL, outer nuclear layer; cArr, cone arrestin. Scale bar, 10 μm. ***, p < 0.001; *, p < 0.1; ns, not significant.
To determine whether photoreceptor cell loss is associated with abnormalities in the ultrastructure of the cell, we performed transmission electron microscopic analyses on Rtbdn−/− and WT retinas at P60, P120, and P240. Representative ultrastructural images are shown in Fig. 5. No obvious morphologic changes were observed at the OS/RPE interface or at the junction of the OS/ARE (Fig. 5A). However, there were minor but obvious morphological differences observed at the central area of the OS between both genotypes and at all ages examined (Fig. 5 (B and C), arrows). These results indicate that the observed functional decline and photoreceptor cell loss in Rtbdn−/− and Rtbdn+/− retinas are not the result of a major structural defect(s). Rather, the functional decline in the absence of major structural deficits suggests that the elimination of Rtbdn probably leads to the disruption of intracellular molecular events.
Figure 5.

Rtbdn ablation leads to minor ultrastructural changes in OS. A, top, images of retinal sections showing the photoreceptor OSs and RPE of P120 WT, P60 Rtbdn−/−, P120 Rtbdn−/−, and P240 Rtbdn−/− mice. Middle, images taken at the interface between the OS tips and RPE from the indicated genotypes. Bottom, images taken at the OSs, connecting cilium, and inner segments. B and C, images taken at the minor ultrastructural changes (arrows) in the middle regions of OS. BM, Bruch's membrane; MV, microvilli; CC, connecting cilium. Scale bar, 2 μm.
Rtbdn−/− neural retinas harbor lower flavin levels and a decreased capacity for RF binding
To investigate the effects of Rtbdn ablation on the levels of retinal flavins, a determination of their levels in the retina was performed. Before experimental samples were tested, known quantities of FAD, FMN, and RF standards were run on an HPLC column as described under “Experimental procedures.” These standards were run to optimize the detection conditions, establish a standard curve for each flavin (Fig. 6A), and assess/separate the elution time for FAD, FMN, and RF in experimental samples (Fig. 6B). Fig. 6C shows that Rtbdn−/− neural retina contains significantly lower levels of FAD (∼46.1%), FMN (∼45%), and RF (∼32%) when compared with age-matched WT. Importantly, these measurements were made using P45 mice, a time point preceding photoreceptor degeneration. Although Rtbdn−/− retinas harbored considerable amounts of flavins, functional decline and degeneration of rods and cones ensued. This points to the tight regulation of flavins in the retina and to the importance of having sufficient amounts, hence explaining why the levels of flavins are so high in the retina (10, 18).
Figure 6.

Rtbdn−/− retinas contain significantly less FAD and FMN. A, HPLC profiles of FAD, FMN, and RF standards. Blue line, data; black line, linear regression used for data quantification. B, HPLC elution profiles of FAD, FMN, and RF. C, levels of FAD, FMN, and RF in neural retinal samples from WT (n = 10), Rtbdn+/− (n = 4), and Rtbdn−/− (n = 10) mice presented as pmol/mg of total protein. Data show that Rtbdn−/− neural retinas contain lower levels of FAD and FMN when compared with WT retinas. Two-way ANOVA (Bonferroni's multiple-comparison test) was used for statistical analysis. D, levels of ATP (nm ATP/mg of protein) in WT and Rtbdn−/− neural retinas at P45 and P120 (n = 6 independent experiments/group). The statistical test used was a two-tailed t test (****, p < 0.0001; **, p < 0.01; *, p < 0.1; ns, not significant). Error bars, S.D.
To assess whether the early reduction in the levels of retinal flavin is the only hallmark of lack of Rtbdn, we evaluated the level of another common metabolite (ATP) in P45 and P120 Rtbdn−/− retinas and compared with age-matched WT (Fig. 6D). Unlike Rtbdn, ATP levels at P45 are comparable with that of WT retinas. However, a significant reduction in ATP level (36.03 ± 4.864) was observed at P120 Rtbdn−/− retinas when compared with age-matched WT.
Previously, we showed that ectopically expressed Rtbdn binds RF (17). To determine whether the reduced flavin levels in the Rtbdn−/− retina are a reflection of reduced RF uptake and delivery to the retina, we performed an ex vivo radiolabeled (14C) RF binding assay. To eliminate the dietary effect on the steady-state levels of flavins in the neural retina, we maintained animals on RF-free diet for 4, 8, or 16 days and assessed FAD level as a marker for total flavins. We observed a reduction in FAD level to 14.9% of WT at 4 day, 11.3% at 8 days, and 2.3% at 16 days (data not shown). Therefore, both Rtbdn−/− and WT mice at P45 were fed a RF-free diet for 16 days to reduce the levels of flavins in the retina. To account for the nonspecific background binding of [14C]RF, we designed a control in which a 100-fold excess of cold RF was added to the [14C]RF incubation medium. Background readings were subtracted from the entire data set of each sample and plotted as pmol/mg proteins (Fig. 7). Over 30% reduction was observed in total uptake of [14C]RF by the Rtbdn−/− neural retinas when compared with WT. Furthermore, membranous fractions from Rtbdn−/− retinas also displayed significantly lower levels of bound [14C]RF when compared with WT counterparts (Fig. 7). The membrane-bound [14C]RF was then dissociated from the membrane using 100 mm Na2CO3, a well-known procedure to dissociate peripheral membrane proteins (19). Again, the level of [14C]RF released from Rtbdn−/− membrane is significantly lower than that released from WT control. These results show that the elimination of Rtbdn is sufficient to negatively influence retinal ability to bind RF, suggesting that this is probably why total retinal flavin levels are significantly reduced in Rtbdn−/− retina (Fig. 6C). Because Rtbdn−/− neural retinal membranes still contained considerable amounts of RF before and after Na2CO3 (Fig. 7), it is reasonable to suggest that there must exist another mechanism for RF delivery to the retina. Taken together, these data show that without Rtbdn, retinas were not able to accumulate flavins to normal physiological levels. These data also suggest that Rtbdn plays a role in the flavin regulation mechanism(s) present in the neural retina.
Figure 7.
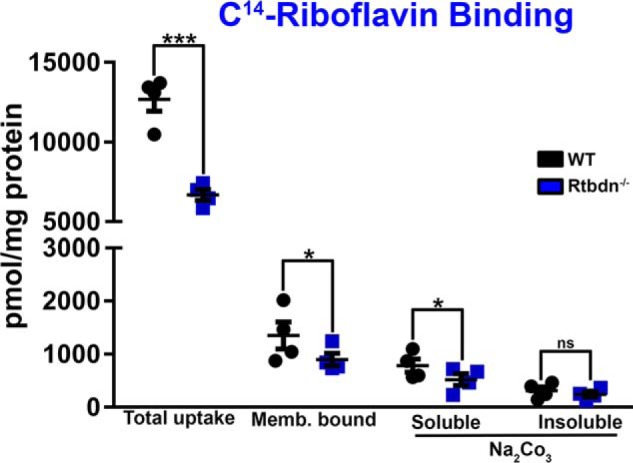
Rtbdn−/− neural retinal membranes have a decreased capacity for RF binding. Shown is a scatter plot representation of pmol of [14C]RF (per mg of total protein) bound to retinal membranes taken from individual P45 Rtbdn−/− and WT mice. [14C]RF is dissociated from these membranes by incubation with 100 mm Na2CO3 (n = 4 independent experiments). These data show that Rtbdn−/− retinas cannot bind RF as effectively as WT. These data also show that RF binding to the membranes is specific to peripheral membrane proteins. ***, p < 0.001; *, p < 0.1; ns, not significant.
Discussion
In this study we utilized a Rtbdn knockout/eGFP knockin mouse model to further verify the retina and rod photoreceptor specificity of Rtbdn expression and to determine the functional and structural consequence(s) of its ablation. Elimination of Rtbdn resulted in a time- and dose-dependent decline in rod- and cone-mediated electroretinogram responses. This decrease in retinal function was due to a decline in the number of rod and cone photoreceptors, indicating that ablation of Rtbdn results in rod and cone photoreceptor cell death. In our previous study, we showed that RF was a potential Rtbdn-binding ligand using an in vitro model. Here, we show that ablation of Rtbdn caused changes in the levels of retinal flavins, and using ex vivo neural retina membranes, we showed that Rtbdn−/− retinas have a decreased capacity for RF binding. Here we conclude that Rtbdn is a key regulator of retinal flavin homeostasis and in its absence; levels of both FAD and FMN are significantly reduced, resulting in photoreceptor cell death.
It was previously found that the rabbit and rat neural retina have a high concentration of flavins (9, 10, 18). In this study, we show that the concentration of flavins is higher in the mouse retina than what has been reported for the rabbit and rat retinas. However, it should be noted that this higher concentration could be due to the higher sensitivity (0.2 pmol of FAD, 0.1 pmol of FMN, and 0.016 pmol of RF) of our method compared with 2 pmol in the method of Batey et al. (9). Furthermore, this study shows that Rtbdn plays a central role in flavin regulation by the neural retina.
RF deficiency has been long documented by physicians to cause light sensitivity (16); however, until this study, it was not known whether RF deficiency caused cell death in the retina. Whereas the mechanism of cell death in the Rtbdn−/− retina still needs to be determined, it is clear from the current study that changes in flavin levels precede photoreceptor degeneration. Interestingly, whereas Rtbdn is produced specifically by the rods, its absence also results in the death of cones. This is not surprising because defects in IPM-specific proteins (like Rtbdn) and RPE-specific proteins can lead to photoreceptor degeneration both in animal models and in humans (20–26). Furthermore, a rod-expressed factor has been shown to be necessary for cone survival (27). Taken together, these findings suggest that proteins in the IPM are needed for the proper homeostasis of both rod and cone photoreceptors even if the IPM protein is specifically produced by the rods, such as Rtbdn or the rod-derived cone viability factor (27).
In vitro studies by Said et al. (28) showed that RPE cells (ARPE-19) uptake RF in a specific and time-dependent manner and that this uptake was trans-stimulated and saturated by increasing amounts of RF, suggesting a carrier-mediated process. Similarly, Kansara et al. (8) showed that cultured retinoblastoma cells (Y-79) are also capable of trans-stimulated specific RF uptake. These studies, taken together, indicate that the retina contains RF transport mechanisms. In both studies, this process was modulated by Ca2+-calmodulin (8, 28), suggestive of an interconnected flavin transport pathway existing between the RPE and neural retina. Taking the data from this study in the context of retinal flavin literature, a potential flavin regulation pathway can be conceived, in which flavins are acquired from the choroidal and/or retinal blood supply and transported to the photoreceptors. Given that photoreceptors acquire most of their metabolites from the choroidal blood supply via the RPE, this is the most likely scenario. To this point, a similar molecule (folate) is transported from the basal surface of ARPE-19 cells to the apical side in vitro (29).
Because Rtbdn does not contain any transmembrane domains or membrane-anchoring moieties (30, 31), it is unlikely that it is capable of actually transporting flavins into cells by itself. Rather, Rtbdn may participate in shuttling flavins to another, yet to be discovered transport protein(s). This would be consistent with Rtbdn being predominantly located at the OS/RPE interface but also, to a lesser extent, at the IS, where the bulk of photoreceptor metabolism occurs. Rtbdn at the OS/RPE interface (17) could also serve as a “sink” to prevent unbound flavins from flooding (post-feeding) the IPM and causing lipid peroxidation in the OS. Flavins from this pool could then be shuttled to the OS and IS as they are needed. Further study of Rtbdn in the context of retinal flavin acquisition and transport is needed.
FAD is the predominant flavin cofactor in the retina. It is also the predominant cofactor used in biological processes. This is because FAD has a very positive reduction potential and is used to facilitate energetically unfavorable reactions, such as the conversion of succinate to fumarate by succinate dehydrogenase in the citric acid cycle (32). Similarly, FAD is utilized by the enzyme acyl-CoA dehydrogenase in the β-oxidation pathway (33). The breaking of high energy bonds in both of these reactions is utilized to generate ATP in their respective pathways.
Although the exact cause of photoreceptor degeneration cannot be determined from these studies, the results strongly suggest that lowered FAD may contribute to the observed cell loss. Given the role of FAD in metabolism, we first speculated that reduced FAD levels will probably lead to reduced ATP levels available for photoreceptors. However, ATP levels in Rtbdn−/− retinas before the onset of degeneration were comparable with that of WT, confirming the presence of a yet to be discovered mechanism that leads to photoreceptor cell death. Our future investigations will be focused on identifying the causes of photoreceptor degeneration in association with the lack of Rtbdn and in a scenario where flavin levels are reduced in the presence of Rtbdn. There is, however, the possibility of affecting metabolites other than ATP in the Rtbdn−/− retinas because photoreceptors have perhaps the highest energy demands of any mammalian cell type (4–7). Without the proper levels of these metabolites, many important photoreceptor processes could be altered. Affecting retinal metabolism in Rtbdn−/− mice is the most straightforward scenario to explain the observed retinal phenotype; many yet to be discovered processes could also have been affected, as retinal flavoproteins have not yet been studied in depth.
In conclusion, this study shows that the rod-produced IPM-specific protein, Rtbdn, is a key player in the concentration of flavins by the retina and that alterations in flavin levels lead to degenerative changes that encompass both rods and cones. Future studies will be aimed at elucidating the flavin transport mechanism(s) that exists between the RPE and photoreceptors and/or between the photoreceptor and retinal blood vessels and how Rtbdn is involved. Although this study indicates that Rtbdn is a key player, the Rtbdn−/− retinas were still able to concentrate flavins in the retina, albeit at lower levels. This indicates that there are other redundant mechanism(s) in place to help concentrate flavins. These potential mechanisms also need to be elucidated to better understand the role of Rtbdn and flavins in normal photoreceptor homeostasis. Undoubtedly, the levels of flavins measured in the Rtbdn−/− retinas must reflect the flavin levels present in the inner retina. Furthermore, the mechanism of cone cell death in Rtbdn−/− retinas needs to be further explored not only in the absence of Rtbdn but also in models of retinal degeneration. Gleaned evidence could lead to important information regarding secondary cone cell loss in retinal degenerations. Finally, given the role of FAD and FMN in energy metabolism, the Rtbdn knockout model can be a powerful tool in understanding how alterations in flavin levels and metabolic changes can lead to retinal degeneration under circumstances where another photoreceptor protein(s) is mutated.
Experimental procedures
Animals
All experiments involving mice were approved by the local institutional animal care and use committee at the University of Houston and adhered to the recommendations in the Guide for the Care and Use of Laboratory Animals of the National Institutes of Health and the Association for Research in Vision and Ophthalmology on the use of animals in research. All mice tested negative for the rd8 allele and harbored the RPE65 Leu variant. Animals were reared under cyclic lighting conditions (12 h light/dark, ∼30 lux). Mice were euthanized using CO2 asphyxiation followed by decapitation, and then the neural retina and/or PECS (pigment epithelium, choroid, and sclera) were harvested and used as indicated below.
Generation of Rtbdn−/− mouse model
Rtbdn−/− mice were generated by inGenious Targeting Laboratory (Ronkonkoma, NY). The targeting vector was constructed from a 13.33-kb region subcloned from a positively identified bacterial artificial chromosome. The long homology arm extends 5.48 kb to the initiation (ATG) codon in exon 2. The short homology arm extends 2.13 kb to the stop (TAG) codon in exon 6. A 2.64-kb eGFP cassette (eGFP-LoxP-FRT-Neo-FRT-LoxP) replaces the 5.72-kb Rtbdn genomic sequence, which flanks the Rtbdn start (ATG) codon and stop (TAG) codon (Fig. 1A). This construct was linearized by NotI digestion and electroporated into mouse embryonic stem cells (c57BL/6 × 129/SvEv hybrid). Embryonic stem cells were selected using G418 antibiotic and screened for proper eGFP cassette insertion via PCR and Southern blotting. Positive cells were injected into C57BL/6 blastocysts and implanted. The resulting chimeric founders were bred to identify mice with germ line transmission and then bred to FLPeR-expressing mice (stock no. 003946, Jackson Laboratories, Bar Harbor, ME) to remove the Neo cassette. Mice lacking the Neo cassette were then consistently outbred onto a C57BL/6 background. PCR genotyping was used to confirm proper deletion of Rtbdn and proper insertion of eGFP. Furthermore, PCR analysis was used to confirm the absence of the rd8 mutation and the presence of the Leu variant of RPE65. Mice heterozygous or homozygous for Rtbdn were used from the same colony and are hereby referred to as Rtbdn+/− and Rtbdn−/−, respectively. WT littermates were used from the same Rtbdn knockout crosses as controls.
Immunoblots
Mouse neural retinas from the indicated genotypes were extracted and then homogenized using a handheld motor and pestle tip (VWR, Radnor, PA) in 1× PBS (pH 7.2) containing 1% Triton X-100 and complete protease inhibitor mixture (Roche, Basel, Switzerland). Following a 1-h incubation at 4 °C, the insoluble material was separated via centrifugation at 4,000 × g. Supernatants were incubated for 1 h at room temperature in Laemmli buffer containing β-mercaptoethanol. Samples were size-fractionated via 10% SDS-PAGE. Because denatured eGFP does not fluoresce, SDS was removed from the gel so that the eGFP expression could be visualized. Therefore, gels were incubated in SDS removal buffer (0.5% SDS in 1× PBS) for 1 h while shaking at room temperature. Gels were imaged for eGFP fluorescence using 488-nm light excitation. Images were captured using a Bio-Rad ChemiDoc MP Imaging System equipped with Image Lab version 5.0 software (Bio-Rad). Gels were then transferred to PVDF membranes, and immunoblotting was carried out as described previously (17). Anti-Rtbdn antibody was used at a concentration of 1:500; anti-β-actin (HRP-conjugated) (Bio-Rad) was used at a concentration of 1:50,000; anti-α-sarcomeric actin (Sigma-Aldrich) was used at a concentration of 1:1000; and anti-eGFP antibody (Invitrogen) was used at a concentration of 1:1000.
Levels of Rtbdn protein in total retinal extracts were determined as indicated above, analyzed from all genotypes by Western blotting, and visualized using antibodies specific to Rtbdn and β-actin (Fig. 1C). Equal amounts of total protein (30 μg) for each sample were loaded onto the gel, separated, and blotted on PVDF membrane using standard protocols. Protein detection was performed with the antibodies mentioned above, and membranes were imaged with a ChemiDocTM MP imaging system (Bio-Rad). Densitometric analysis of the bands was performed on non-saturated bands with Image Lab software version 4.1 (Bio-Rad), and band intensities were normalized to β-actin in the same lane, and data are presented as mean ± S.D. from four independent retinal samples for each genotype. Relative values were analyzed by one-way ANOVA to determine statistical significance (**, p < 0.001; ***, p < 0.0002; ****, p < 0.0001).
Immunohistochemistry
Eyes were processed, sectioned, and stained as described previously (34). Briefly, eyes were fixed in 4% paraformaldehyde for 2 h. A hole was then made in the corneas (near the ora serrata), and the eyes were returned to 4% paraformaldehyde for 2 h. The cornea and lens were then dissected away, and the eye cups were placed into a sucrose gradient at 4 °C (10% for 1 h, 20% 1 h, and 30% overnight). The following morning, cryoprotected eye cups were embedded in Shandon M1 matrix (Thermo Scientific, Waltham, MA) and frozen on dry ice. 10-μm sections were prepared using a Leica Cm 3050 cryostat (Leica Biosystems, Buffalo Grove, IL) at −20 °C. Sections were treated for autofluorescence using a fresh solution of 1% sodium borohydride in water and then blocked in a solution containing 2.5% donkey serum, 0.5% Triton X-100, and 1% fish gelatin in 1× PBS (pH 7.2) (blocking solution) for 30 min at room temperature. Anti-cone arrestin antibody (1:5000; a generous gift from Dr. Cheryl Craft, University of Southern California) was applied overnight in blocking solution. Secondary antibody (1:500; Life Technologies, Inc.) was applied in blocking solution at room temperature for 1.5 h. Slides were mounted, imaged, and analyzed, as described previously (17), with the exception that eGFP was visualized directly using an excitation wavelength of 488 nm.
Electroretinography
Full-field ERGs were recorded as described previously (35). Briefly, mice were dark-adapted overnight and, before electroretinography, were anesthetized using 85 mg/kg ketamine and 14 mg/kg xylazine (Henry Schein Animal Health, Dublin, OH). Eyes were dilated with 1% cyclogel and covered in Gonak (Pharmaceutical Systems, Tulsa, OK). Platinum wire loops were placed in contact with the cornea through a layer of methylcellulose (Pharmaceutical Systems). Using the UTAS system (LKC, Gaithersburg, MD) full-field ERG profiles were recorded from both eyes and averaged. Full-field scotopic (rod) ERGs were recorded in response to either a single 157-cd s/m2 flash or a subset of flash intensities ranging from −4.0 to 1.8 log cd s/m2 (presented to dark-adapted mice). Following light adaptation for 5 min at 29 cd s/m2, photopic (cone) ERGs were recorded in response to 25 successive 157-cd s/m2 flashes. Recordings were analyzed and plotted in GraphPad Prism version 5 (GraphPad Software, La Jolla, CA), and statistical analysis was performed using a two-way ANOVA followed by Bonferroni post-test.
Photoreceptor nucleus counts
Eyes were prepared for paraffin sectioning as described previously (36–38). Briefly, whole eyes were fixed overnight at 4 °C in Davidson's fixative (32% ethanol, 11% acetic acid, 2% formaldehyde) (39), washed once with 1× PBS, and stored in 70% ethanol overnight at 4 °C. The following day, eyes were dehydrated, paraffin-embedded, and sectioned at 10 μm. Nuclei were counterstained using methyl green (Vector Laboratories, Burlingame, CA). Images were captured using a Zeiss Axioskop equipped with a Zeiss Axiocam (Zeiss, Jena, Germany) using a ×20 objective. Images were captured every 0.435 mm migrating peripherally (both inferior and superior) from the optic nerve head. Images were analyzed using ImageJ software (40). For nuclear count, nuclei were enumerated in 410-μm-wide portions of the retina centered at the indicated distances from the optic nerve, and all nuclei in the outer nuclear layer within this area were counted using ITCN (image-based tool for counting nuclei) (41). Data were plotted using GraphPad Prism version 5 (GraphPad Software), and statistical analysis was performed using a two-tailed unpaired t test.
Retinal flat mounts
Neural retinas were dissected away from the RPE, immediately fixed in 8% paraformaldehyde for 30 min at room temperature, and washed once with 1× PBS. Neural retinas were incubated with either fluorescently tagged PNA (1:500; Life Technologies) for 1 h at room temperature and/or with anti-cone arrestin antibody (1:5,000; a generous gift from Dr. Cheryl Craft, University of Southern California) overnight in blocking solution. Retinas were washed four times for 5 min each in 1× PBS. Then four incisions were made, and retinas were laid flat in a 1:10 dilution of prolong gold DAPI (Life Technologies) in 1× PBS and mounted on a glass microscope slide. Separate images were captured at various positions around the optic nerve head, and cones labeled with PNA or with anti-cone arrestin were enumerated using ImageJ software (40). Data were plotted using GraphPad Prism version 5, and statistical analysis was performed using a two-tailed unpaired t test.
Transmission electron microscopy
Transmission electron microscopy was performed as described previously (34, 36, 42). Briefly, whole eyes were dissected, and a hot needle was used to mark the superior portion of the cornea to maintain a recognizable orientation. A small slit was made in the cornea (near the ora serrata), and the eyes were fixed for 2 h at 4 °C in 2% glutaraldehyde and 2% paraformaldehyde in 1× PBS. The cornea and lens were then removed, and the resulting eye cup was returned to fixative overnight at 4 °C. Sections at 600–800 Å were stained with 2% uranyl acetate and Reynolds' lead citrate on copper 75–300-mesh grids. Images were captured on a JEOL 100CX electron microscope at an accelerating voltage of 60 kV.
[14C]RF ex vivo binding assay
[14C]RF was obtained from American Radiolabeled Chemicals (ARC 3649) containing one 14C atom per RF molecule (American Radiolabeled Chemicals, St. Louis, MO). Before experimentation, animals were maintained on an RF-free diet for 4, 8, and 16 days to assess the percentage reduction in steady-state levels of flavins in the neural retina using FAD as a marker. Experimental animals were kept on an RF-free diet for 16 day. Neural retinas extracted from P45 WT or Rtbdn−/− mice were placed directly into RF-free DMEM supplemented with either 10 μmol of [14C]RF or 10 μmol/100 μmol of [14C]RF/[12C]RF. Individual neural retinas were incubated in 250 μl of medium at 37 °C for 30 min under 95%/5% O2/CO2. Neural retinas were washed three times in 1× PBS and then homogenized in 250 μl of 1× PBS with complete protease inhibitor mixture for 30 s using a pestle tip and motor. For each sample, a 50-μl aliquot was set aside for protein quantification via Bradford assay (Bio-Rad), following digestion in 1% Triton for 1 h shaking at 4 °C. The remaining 200 μl (total uptake fraction) was centrifuged at 30,000 × g for 20 min in a Sorvall Discovery M150 ultracentrifuge (Thermo Scientific) using a fixed angle rotor (Sorvall catalog no. S55S-1009). The pellet (membrane-bound fraction, containing membranes, organelles, cytoskeletal components, and insoluble IPM) was resuspended in 200 μl of 100 mm Na2CO3 in 1× PBS buffer. A 75-μl aliquot was removed and placed into 1 ml of scintillation fluid and counted in a Beckman Coulter LS6000 IC scintillation counter (Beckman Coulter, Brea, CA). After 30 min in 100 mm Na2CO3 (4 °C), the remaining 125 μl was centrifuged at 30,000 × g for 20 min. The supernatant was removed, and the pellet was resuspended in the same buffer. 100 μl each of the 100 mm Na2CO3 supernatant and resuspended pellet was pipetted into 1 ml of scintillation fluid and counted. Curies of radiation from [14C]RF (50 mCi/mmol) were back-calculated to moles of RF. Picomoles of RF were then normalized to protein content from the 50-μl aliquot set aside before processing, giving a final measurement of pmol of RF/mg of protein. Samples incubated in 10 μmol of [14C]RF, 100 μmol of [12C]RF were processed side by side with samples incubated in 14C alone and were used to measure background radiation, which was then subtracted from the “radiolabeled” data during analysis. Data were plotted using GraphPad Prism version 5, and statistical analysis was performed using a two-tailed unpaired t test.
HPLC analysis of flavins
All flavin extraction steps were carried out in the dark under dim red light. Four frozen neural retinas or three RPEs were placed in a foil-wrapped tube containing 500 μl of 0.05 m ammonium acetate in water (pH 5.5; filtered through a 0.2-μm filter). Samples were homogenized for 30 s using a pestle tip and motor. A 50-μl aliquot of the homogenate was used for protein quantification via Bradford assay following extraction in 1% Triton for 1 h with shaking at 4 °C. Samples were then heated at 80 °C for 5 min to release all protein-bound flavins and centrifuged at 4,000 × g for 5 min at 4 °C to separate away all insoluble components. Supernatants were moved to a fresh tube containing 3.25 μl of 37% HCl, bringing the sample to a pH of 2. Samples were centrifuged again at 4,000 × g for 5 min at 4 °C. Supernatants were removed using a sterile syringe and filtered through a sterile 0.2-μm filter tip directly into HPLC screw cap vials wrapped in foil. Samples were immediately injected into a Waters 4.6 mm × 250-mm column using a Dionex AS50 autosampler and GP50 gradient pump (Dionex, Sunnyvale, CA). The mobile phase used was 0.05 m ammonium acetate 90:10 water/acetonitrile. Each run lasted 46 min at a 0.5 ml/min flow rate, followed by a 5-min 50:50 water/acetonitrile and a 5-min 95:5 water/acetonitrile wash to ensure no contamination across runs. FAD, FMN, and RF peaks were measured at an excitation wavelength of 447 nm and emission wavelength of 530 nm using a Shimadzu RF-10Axl fluorescence detector (Shimadzu, Kyoto, Japan). Peak areas were quantified using FAD, FMN, and RF standards purchased from Sigma-Aldrich. Linear regressions of standard quantifications are shown in Fig. 6A. Data from 10 WT, 4 Rtbdn+/−, and 10 Rtbdn−/− were averaged and plotted using GraphPad Prism version 5, and statistical analysis was performed using two-way ANOVA (Bonferroni's multiple-comparison test).
ATP analysis
ATP level in retinal samples was measured using luminescent ATP detection assay (ab113849, Abcam) as recommended by the supplier. In brief, a stock solution (10 mm ATP standard provided with the kit) was prepared in 1× PBS (pH 7.2). Fresh retinas were collected for all measurements, and all steps were carried out in a dark room on ice. Each retina was immediately placed in 100 μl of 1× PBS (pH 7.2), and the tissue was disrupted by sonication. Then a 50-μl aliquot of retinal homogenate was transferred to a single well of a 96-well white plate, and the rest was kept aside for protein quantification. Fifty microliters of the cell lysis buffer provided with the kit were added to each well, and the plate was shaken at 700 rpm for 10 min to lyse the cells and stabilize the ATP. Then 50 μl of the reconstituted substrate solution was added to each well, kept on a shaker at 700 rpm for 5 min, and incubated for 10 min at 37 °C. Following this, the plate was placed in a microplate reader (Spectramax M5, Molecular Devices, Sunnyvale, CA), and the luminescence of each well was measured at an integration time of 1,500 ms/measurement as random luminescence units. The quantification of ATP levels was done by integrating the random luminescence units of the unknown samples against those of the standard curve, averaged from six replicates of each cohort, and plotted as mean ± S.D. per mg of protein present in each sample. One-way ANOVA (Bonferroni's multiple-comparison test) was used to test the significance of six replicates for each group.
Author contributions
R. A. K., M. R. A., and M. I. N. conceived the project, designed the experiments, and co-wrote the manuscript. R. A. K. produced most of the data presented. T. S. assessed ATP levels and revalidated flavin levels in WT, Rtbdn+/−, and Rtbdn−/− retinas. A. M. G. produced the Western blot in Fig. 1B and immunohistochemistry in Fig. 1F. L. I. produced the Western blot in Fig. 1D, and M. S. M. produced and revalidated the ERG data in Fig. 2. M. R. A. and M. I. N. supervised and analyzed the data generated. M. S. M., A. M. G., and L. I. provided technical assistance in some of the experiments requested during the revision of the manuscript.
Acknowledgments
We thank Dr. Karolyn Ruffin and Dr. Jennifer Bynum (University of Oklahoma Health Sciences Center) for making available the use of the HPLC system. We also thank Dr. Kelly Standifer (University of Oklahoma Health Sciences Center) for assistance in designing the [14C]RF binding assay.
This work was supported by NEI, National Institutes of Health, Grants R01EY026499 and R01-EY10609 (to M. I. N. and M. R. A.) and the Foundation Fighting Blindness (to M. R. A.). The authors declare that they have no conflicts of interest with the contents of this article. The content is solely the responsibility of the authors and does not necessarily represent the official views of the National Institutes of Health.
- RPE
- retinal pigment epithelium
- Rtbdn
- retbindin
- OS
- outer segment
- IS
- inner segment
- RF
- riboflavin
- IPM
- interphotoreceptor matrix
- eGFP
- enhanced GFP
- ANOVA
- analysis of variance
- ERG
- electroretinography
- P
- postnatal day
- cd
- candela
- PNA
- peanut agglutinin.
References
- 1. Sparrow J. R., Hicks D., and Hamel C. P. (2010) The retinal pigment epithelium in health and disease. Curr. Mol. Med. 10, 802–823 [DOI] [PMC free article] [PubMed] [Google Scholar]
- 2. Ban Y., and Rizzolo L. J. (2000) Regulation of glucose transporters during development of the retinal pigment epithelium. Brain Res. Dev. Brain Res. 121, 89–95 [DOI] [PubMed] [Google Scholar]
- 3. Wang L., Kondo M., and Bill A. (1997) Glucose metabolism in cat outer retina: effects of light and hyperoxia. Invest. Ophthalmol. Vis. Sci. 38, 48–55 [PubMed] [Google Scholar]
- 4. Alder V. A., Ben-Nun J., and Cringle S. J. (1990) PO2 profiles and oxygen consumption in cat retina with an occluded retinal circulation. Invest. Ophthalmol. Vis. Sci. 31, 1029–1034 [PubMed] [Google Scholar]
- 5. Braun R. D., Linsenmeier R. A., and Goldstick T. K. (1995) Oxygen consumption in the inner and outer retina of the cat. Invest. Ophthalmol. Vis. Sci. 36, 542–554 [PubMed] [Google Scholar]
- 6. Winkler B. S. (1981) Glycolytic and oxidative metabolism in relation to retinal function. J. Gen. Physiol. 77, 667–692 [DOI] [PMC free article] [PubMed] [Google Scholar]
- 7. Futterman S., and Kinoshita J. H. (1959) Metabolism of the retina. I. Respiration of cattle retina. J. Biol. Chem. 234, 723–726 [PubMed] [Google Scholar]
- 8. Kansara V., Pal D., Jain R., and Mitra A. K. (2005) Identification and functional characterization of riboflavin transporter in human-derived retinoblastoma cell line (Y-79): mechanisms of cellular uptake and translocation. J. Ocul. Pharmacol. Ther. 21, 275–287 [DOI] [PubMed] [Google Scholar]
- 9. Batey D. W., Daneshgar K. K., and Eckhert C. D. (1992) Flavin levels in the rat retina. Exp. Eye Res. 54, 605–609 [DOI] [PubMed] [Google Scholar]
- 10. Batey D. W., and Eckhert C. D. (1991) Analysis of flavins in ocular tissues of the rabbit. Invest. Ophthalmol. Vis. Sci. 32, 1981–1985 [PubMed] [Google Scholar]
- 11. Tomitsuka E., Hirawake H., Goto Y., Taniwaki M., Harada S., and Kita K. (2003) Direct evidence for two distinct forms of the flavoprotein subunit of human mitochondrial complex II (succinate-ubiquinone reductase). J. Biochem. 134, 191–195 [DOI] [PubMed] [Google Scholar]
- 12. Crane F. L., and Beinert H. (1956) On the mechanism of dehydrogenation of fatty acyl derivatives of coenzyme A. II. The electron-transferring flavoprotein. J. Biol. Chem. 218, 717–731 [PubMed] [Google Scholar]
- 13. Crane F. L., Mii S., Hauge J. G., Green D. E., and Beinert H. (1956) On the mechanism of dehydrogenation of fatty acyl derivatives of coenzyme A. I. The general fatty acyl coenzyme A dehydrogenase. J. Biol. Chem. 218, 701–706 [PubMed] [Google Scholar]
- 14. Huvaere K., Cardoso D. R., Homem-de-Mello P., Westermann S., and Skibsted L. H. (2010) Light-induced oxidation of unsaturated lipids as sensitized by flavins. J. Phys. Chem. B 114, 5583–5593 [DOI] [PubMed] [Google Scholar]
- 15. Eckhert C. D., Hsu M. H., and Pang N. (1993) Photoreceptor damage following exposure to excess riboflavin. Experientia 49, 1084–1087 [DOI] [PubMed] [Google Scholar]
- 16. Kruse H. D. S., VP; Sebrell W. H., and Cleckley H. M. (1940) Ocular manifestations of ariboflavinosis. Public Health Reports 55, 157–169 [Google Scholar]
- 17. Kelley R. A., Al-Ubaidi M. R., and Naash M. I. (2015) Retbindin is an extracellular riboflavin-binding protein found at the photoreceptor/retinal pigment epithelium interface. J. Biol. Chem. 290, 5041–5052 [DOI] [PMC free article] [PubMed] [Google Scholar]
- 18. Batey D. W., and Eckhert C. D. (1990) Identification of FAD, FMN, and riboflavin in the retina by microextraction and high-performance liquid chromatography. Anal. Biochem. 188, 164–167 [DOI] [PubMed] [Google Scholar]
- 19. Fujiki Y., Hubbard A. L., Fowler S., and Lazarow P. B. (1982) Isolation of intracellular membranes by means of sodium carbonate treatment: application to endoplasmic reticulum. J. Cell Biol. 93, 97–102 [DOI] [PMC free article] [PubMed] [Google Scholar]
- 20. Campochiaro P. A., Nguyen Q. D., Shah S. M., Klein M. L., Holz E., Frank R. N., Saperstein D. A., Gupta A., Stout J. T., Macko J., DiBartolomeo R., and Wei L. L. (2006) Adenoviral vector-delivered pigment epithelium-derived factor for neovascular age-related macular degeneration: results of a phase I clinical trial. Hum. Gene Ther. 17, 167–176 [DOI] [PubMed] [Google Scholar]
- 21. Kozhevnikova O. S., Korbolina E. E., Ershov N. I., and Kolosova N. G. (2013) Rat retinal transcriptome: effects of aging and AMD-like retinopathy. Cell Cycle 12, 1745–1761 [DOI] [PMC free article] [PubMed] [Google Scholar]
- 22. Machalińska A., Safranow K., Mozolewska-Piotrowska K., Dziedziejko V., and Karczewicz D. (2012) PEDF and VEGF plasma level alterations in patients with dry form of age-related degeneration–a possible link to the development of the disease. Klin. Oczna 114, 115–120 [PubMed] [Google Scholar]
- 23. Lin J. M., Wan L., Tsai Y. Y., Lin H. J., Tsai Y., Lee C. C., Tsai C. H, Tseng S. H., and Tsai F. J. (2008) Pigment epithelium-derived factor gene Met72Thr polymorphism is associated with increased risk of wet age-related macular degeneration. Am. J. Ophthalmol. 145, 716–721 [DOI] [PubMed] [Google Scholar]
- 24. Bandah-Rozenfeld D., Collin R. W., Banin E., van den Born L. I., Coene K. L., Siemiatkowska A. M., Zelinger L., Khan M. I., Lefeber D. J., Erdinest I., Testa F., Simonelli F., Voesenek K., Blokland E. A., Strom T. M., et al. (2010) Mutations in IMPG2, encoding interphotoreceptor matrix proteoglycan 2, cause autosomal-recessive retinitis pigmentosa. Am. J. Hum. Genet. 87, 199–208 [DOI] [PMC free article] [PubMed] [Google Scholar]
- 25. den Hollander A. I., McGee T. L., Ziviello C., Banfi S., Dryja T. P., Gonzalez-Fernandez F., Ghosh D., and Berson E. L. (2009) A homozygous missense mutation in the IRBP gene (RBP3) associated with autosomal recessive retinitis pigmentosa. Invest. Ophthalmol. Vis. Sci. 50, 1864–1872 [DOI] [PMC free article] [PubMed] [Google Scholar]
- 26. Weber B. H., Vogt G., Pruett R. C., Stöhr H., and Felbor U. (1994) Mutations in the tissue inhibitor of metalloproteinases-3 (TIMP3) in patients with Sorsby's fundus dystrophy. Nat. Genet. 8, 352–356 [DOI] [PubMed] [Google Scholar]
- 27. Léveillard T., Mohand-Saïd S., Lorentz O., Hicks D., Fintz A. C., Clérin E., Simonutti M., Forster V., Cavusoglu N., Chalmel F., Dollé P., Poch O., Lambrou G., and Sahel J. A. (2004) Identification and characterization of rod-derived cone viability factor. Nat. Genet. 36, 755–759 [DOI] [PubMed] [Google Scholar]
- 28. Said H. M., Wang S., and Ma T. Y. (2005) Mechanism of riboflavin uptake by cultured human retinal pigment epithelial ARPE-19 cells: possible regulation by an intracellular Ca2+-calmodulin-mediated pathway. J. Physiol. 566, 369–377 [DOI] [PMC free article] [PubMed] [Google Scholar]
- 29. Bridges C. C., El-Sherbeny A., Ola M. S., Ganapathy V., and Smith S. B. (2002) Transcellular transfer of folate across the retinal pigment epithelium. Curr. Eye Res. 24, 129–138 [DOI] [PubMed] [Google Scholar]
- 30. Geer L. Y., Marchler-Bauer A., Geer R. C., Han L., He J., He S., Liu C., Shi W., and Bryant S. H. (2010) The NCBI BioSystems database. Nucleic Acids Res. 38, D492–D496 [DOI] [PMC free article] [PubMed] [Google Scholar]
- 31. Gasteiger E., Gattiker A., Hoogland C., Ivanyi I., Appel R. D., and Bairoch A. (2003) ExPASy: The proteomics server for in-depth protein knowledge and analysis. Nucleic Acids Res. 31, 3784–3788 [DOI] [PMC free article] [PubMed] [Google Scholar]
- 32. Kim H. J., and Winge D. R. (2013) Emerging concepts in the flavinylation of succinate dehydrogenase. Biochim. Biophys. Acta 1827, 627–636 [DOI] [PMC free article] [PubMed] [Google Scholar]
- 33. Thorpe C., Matthews R. G., and Williams C. H. Jr. (1979) Acyl-coenzyme A dehydrogenase from pig kidney: purification and properties. Biochemistry 18, 331–337 [DOI] [PubMed] [Google Scholar]
- 34. Stricker H. M., Ding X. Q., Quiambao A., Fliesler S. J., and Naash M. I. (2005) The Cys214 → Ser mutation in peripherin/rds causes a loss-of-function phenotype in transgenic mice. Biochem. J. 388, 605–613 [DOI] [PMC free article] [PubMed] [Google Scholar]
- 35. Cheng T., Peachey N. S., Li S., Goto Y., Cao Y., and Naash M. I. (1997) The effect of peripherin/rds haploinsufficiency on rod and cone photoreceptors. J. Neurosci. 17, 8118–8128 [DOI] [PMC free article] [PubMed] [Google Scholar]
- 36. Chakraborty D., Conley S. M., Zulliger R., and Naash M. I. (2016) The K153Del PRPH2 mutation differentially impacts photoreceptor structure and function. Hum. Mol. Genet. 25, 3500–3514 [DOI] [PMC free article] [PubMed] [Google Scholar]
- 37. Stuck M. W., Conley S. M., and Naash M. I. (2015) Retinal degeneration slow (RDS) glycosylation plays a role in cone function and in the regulation of RDS·ROM-1 protein complex formation. J. Biol. Chem. 290, 27901–27913 [DOI] [PMC free article] [PubMed] [Google Scholar]
- 38. Murray A. R., Vuong L., Brobst D., Fliesler S. J., Peachey N. S., Gorbatyuk M. S., Naash M. I., and Al-Ubaidi M. R. (2015) Glycosylation of rhodopsin is necessary for its stability and incorporation into photoreceptor outer segment discs. Hum. Mol. Genet. 24, 2709–2723 [DOI] [PMC free article] [PubMed] [Google Scholar]
- 39. Tan E., Wang Q., Quiambao A. B., Xu X., Qtaishat N. M., Peachey N. S., Lem J., Fliesler S. J., Pepperberg D. R., Naash M. I., and Al-Ubaidi M. R. (2001) The relationship between opsin overexpression and photoreceptor degeneration. Invest. Ophthalmol. Vis. Sci. 42, 589–600 [PubMed] [Google Scholar]
- 40. Schneider C. A., Rasband W. S., and Eliceiri K. W. (2012) NIH Image to ImageJ: 25 years of image analysis. Nat. Methods 9, 671–675 [DOI] [PMC free article] [PubMed] [Google Scholar]
- 41. Byun J., Verardo M. R., Sumengen B., Lewis G. P., Manjunath B. S., and Fisher S. K. (2006) Automated tool for the detection of cell nuclei in digital microscopic images: application to retinal images. Mol. Vis. 12, 949–960 [PubMed] [Google Scholar]
- 42. Conley S. M., Stuck M. W., Watson J. N., and Naash M. I. (2017) Rom1 converts Y141C-Prph2-associated pattern dystrophy to retinitis pigmentosa. Hum. Mol. Genet. 26, 509–518 [DOI] [PMC free article] [PubMed] [Google Scholar]