

SUMMARY
Telomerase maintains genome integrity by adding repetitive DNA sequences to the chromosome ends in actively dividing cells, including 90% of all cancer cells. Recruitment of human telomerase to telomeres occurs during S-phase of the cell cycle, but the molecular mechanism of the process is only partially understood. Here, we use CRISPR genome editing and single-molecule imaging to track telomerase trafficking in nuclei of living human cells. We demonstrate that telomerase uses three-dimensional diffusion to search for telomeres, probing each telomere thousands of times each S-phase but only rarely forming a stable association. Both the transient and stable association events depend on the direct interaction of the telomerase protein TERT with the telomeric protein TPP1. Our results reveal that telomerase recruitment to telomeres is driven by dynamic interactions between the rapidly diffusing telomerase and the chromosome end.
INTRODUCTION
Human chromosomes end in repetitive DNA sequences, which are bound by the six-protein shelterin complex (de Lange, 2005). Due to the end replication problem, chromosome ends shrink by ~50 bases every cell division (Harley et al., 1990), eventually leading to cell death or senescence (Stewart and Weinberg, 2006). To counteract this telomere attrition, continuously dividing cells such as germ cells, stem cells and most cancer cells express the ribonucleoprotein (RNP) telomerase (Schmidt and Cech, 2015; Stewart and Weinberg, 2006). The central importance of telomerase for tumor formation and survival is highlighted by recurring mutations in the promoter of the gene for telomerase reverse transcriptase (TERT), the catalytic protein component of the telomerase RNP (Horn et al., 2013; Huang et al., 2013). These mutations are associated with mono-allelic activation of TERT expression and increased telomerase activity (Bell et al., 2015; Borah et al., 2015; Stern et al., 2015), contributing to the unlimited proliferative potential of the tumor cells. It is therefore important to understand the basic biology of telomere maintenance, potentially providing new approaches for cancer therapy.
The telomerase holoenzyme is composed of TERT, the telomerase RNA (TR), and the accessory proteins dyskerin, NHP2, and NOP10, which stabilize TR in the nucleus (Schmidt and Cech, 2015). In addition, the telomerase RNP associates with TCAB1, which facilitates telomerase localization to sub-nuclear structures called Cajal bodies (Venteicher et al., 2009). Human telomerase processively copies telomeric repeats from the template region of TR, adding ~50–60 nucleotides to the single-stranded overhang of most chromosome ends each cell cycle (Schmidt and Cech, 2015; Zhao et al., 2011; 2009). Importantly, telomerase is only present at ~250 copies per cell (Xi and Cech, 2014), an amount comparable to the number of chromosome ends in a cancer cell after DNA replication has occurred. This raises two important questions: How does telomerase find the telomeres that it needs to elongate, and how is it distributed to allow elongation of most telomeres?
The shelterin complex carries out two critical functions: it protects chromosome ends from being recognized by the DNA damage machinery and it recruits telomerase (Nandakumar and Cech, 2013; Palm and de Lange, 2008). Telomerase is recruited to the telomere by a direct interaction between the shelterin component TPP1 and TERT (Nandakumar et al., 2012; Schmidt et al., 2014; Zhong et al., 2012). If either the TEL-patch of TPP1 or the TEN-domain of TERT is mutated, telomerase can be detected in Cajal bodies but not at telomeres, and telomere elongation ceases (Nandakumar et al., 2012; Schmidt et al., 2014; Zhong et al., 2012).
Telomerase recruitment to telomeres occurs only in S-phase of the cell cycle, while in the remainder of the cell cycle telomerase appears to be concentrated in Cajal bodies (Jády et al., 2006; Tomlinson et al., 2006; Xi et al., 2015). Both nucleoli and Cajal bodies have been suggested to be involved in the biogenesis and trafficking of telomerase in S-phase (Tomlinson et al., 2006). It has also been proposed that telomeres move into close proximity to Cajal bodies to facilitate telomerase recruitment to telomeres (Jády et al., 2006). Interestingly, at any given time point during S-phase only a small subset (~5%) of telomeres co-localize with telomerase (Jády et al., 2006; Tomlinson et al., 2006; Xi et al., 2015). Therefore telomerase either elongates only a subset of telomeres in any given cell cycle, perhaps the shortest telomeres as occurs in yeast (Teixeira et al., 2004), or it consecutively visits most or all telomeres.
These divergent models for telomerase recruitment could be resolved by live-cell imaging, but this has been hampered by the low abundance of telomerase. Overexpression does not provide an adequate solution, because it forces telomerase to localize to all telomeres (Nandakumar et al., 2012; Zhong et al., 2012). Here we overcome this hurdle using a combination of CRISPR-Cas9-mediated genome editing and single-molecule live-cell microscopy. We demonstrate that human telomerase rapidly diffuses through the nucleus, avoiding nucleoli, in a three-dimensional search for telomeres. Telomerase forms short, dynamic interactions with telomeres probing each chromosome end thousands of times during S-phase. Only rarely are these probing interactions converted into static interactions that are sufficiently long to allow telomere elongation. The previously identified TPP1-TEN domain interaction is necessary for both “probing” and static interactions. Our observations provide a new model for telomerase recruitment to telomeres.
RESULTS
Generating Doubly Genome-edited Cell Lines to Label both Telomerase and Telomeres
To study the dynamics of telomerase localization in living human cells, we used CRISPR-Cas9 genome editing to introduce sequences encoding a FLAG-HaloTag at the endogenous TERT locus (Fig. 1A, S1A). Proper targeting of the TERT locus was confirmed using PCR and Sanger sequencing (Fig. S1B). FLAG-HaloTag-TERT was expressed at a level similar to that of endogenous TERT in the parental HeLa cells and was readily fluorescently labeled with a HaloTag-ligand (Fig. 1B). In contrast, TERT fused to a different protein tag (SNAP) was somewhat overexpressed, as described previously (Xi et al., 2015). FLAG-HaloTag-TERT had similar catalytic activity as endogenous TERT (Fig. 1C–D; independent specific activity measurements ranged from 50 to 100% of that of the parental HeLa cells). The processivity of FLAG-HaloTag-TERT, which is a measure of how telomerase interacts with its DNA substrate over many telomeric repeat additions, was comparable to endogenous TERT (Fig. 1C; 85% ± 8% relative to endogenous TERT, mean ± SD, N = 4). In addition, FLAG-HaloTag-TERT processivity was stimulated by the telomeric POT1/TPP1 complex to the same degree as endogenous TERT (Fig. S1C–D), indicating that its interaction with TPP1 is not affected by the presence of the N-terminal tag. Importantly, anti-FLAG immuno-precipitation enriched telomerase activity from edited but not the parental cells, confirming that the observed enzymatic activity is derived from telomerase (Fig. S1E). FLAG-HaloTag-TERT displayed the expected localization to telomeres and Cajal bodies in fixed cells (Fig. 1E). It total, these results demonstrate FLAG-HaloTag-TERT behaves like endogenous TERT and is therefore well suited to study telomerase trafficking.
Figure 1. Generation and Characterization of Cell Lines Expressing FLAG-HaloTag-TERT from its Endogenous Locus.

(A) Summary of the doubly genome-edited cell line generated to track telomeres and single telomerase RNPs and to visualize Cajal bodies. TRF2 and TERT were fused N-terminally with HA-mEos3.2 tag and FLAG-HaloTag, respectively. BFP-coilin was transiently expressed. (B) Western blot and fluorescence imaging of TERT immuno-purified from parental HeLa and three genome-edited cells lines, using FLAG and TERT antibodies (* tagged TERT, # endogenous TERT). The HaloTag and SNAP-tag were labeled with JF646. (C) Direct telomerase extension assay after immuno-purification of TERT. LC1 and LC2, labeled DNA loading controls. (D) Western blot of TERT purifications used for the telomerase assay shown in panel C (* tagged TERT, # endogenous TERT). (E) Cyto-localization of FLAG-HaloTag-TERT in fixed cells synchronized in S-phase. TERT was labeled with JF646; Cajal bodies and telomeres were stained with antibodies against coilin and TRF2, respectively (white arrows indicate co-localizations). See also Figures S1 and S2.
To label telomerase for live-cell imaging, we treated cells expressing FLAG-HaloTag-TERT with a cell-permeable, fluorescent HaloTag-substrate (JF646) (Grimm et al., 2015). To visualize telomeres, the N-terminus of the shelterin component TRF2 was fused to HA-mEOS3.2, a photo-switchable fluorescent protein (Fig. S2A–B) (Zhang et al., 2012), again using genome editing of the endogenous locus. Previous studies have demonstrated that N-terminal fusion of TRF2 to a fluorescent protein does not alter TRF2 activity (Mattern et al., 2004; Wang et al., 2008). We confirmed that HA-mEOS3.2-TRF2 localized to telomeres and did not trigger the formation of telomere dysfunction-induced foci, demonstrating that the TRF2 fusion protein is functional (Fig. S2C–D). Finally, cells were transiently transfected with BFP-coilin to mark Cajal bodies (Fig. 1A).
Telomerase Rapidly Diffuses through the Nucleus
To analyze telomerase trafficking to telomeres we first imaged coilin, immediately followed by simultaneous tracking of TRF2 and TERT (Fig. 2A). Cells were synchronized at the G1/S border and released into S-phase for 3–4 hours, the time point when telomerase localization to telomeres is maximal (Xi et al., 2015). High incline laminated optical sheet (HILO) illumination (Tokunaga et al., 2008) allowed detection of individual TERT complexes (Fig. 2B, Movie S1). Telomerase rapidly diffused through the nucleus, frequently co-localizing with telomeres and Cajal bodies (Fig. 2C–D, Movie S1–S3). Remarkably, single-particle tracking revealed that telomerase frequently traversed distances of 4–5 μm on the second time-scale (Sergé et al., 2008), a distance that corresponds to ~30% of the diameter of the nucleus (Fig. 2C). In addition, telomerase explored much but not all of the nuclear space, completely avoiding large areas of the nucleus (Fig. 2D). Co-transfection with GFP-nucleolin demonstrated that the unexplored circular areas were nucleoli (Movie S4), consistent with previous results (Wong et al., 2002).
Figure 2. Three-dimensional Diffusion of Telomerase Governs its Search for Telomeres.

(A) Diagram illustrating our approach for visualizing Cajal bodies, telomerase, and telomeres. First, BFP-coilin was imaged, also converting mEOS-3.2 from the green to the red state. Immediately afterwards, we simultaneously imaged red mEOS3.2-TRF2 and HaloTag(JF646)-TERT at 45 frames per second. (B) Still images from movies simultaneously visualizing telomeres (mEOS3.2) and telomerase (HaloTag-JF646), after imaging Cajal bodies marked by BFP-coilin (white arrows indicate co-localizations). (C) A subset of trajectories of telomerase particles, present for at least 10 frames (~220 ms), generated by single-particle tracking of telomerase signals at 45 fps (20 ms exposure), demonstrating rapid three-dimensional diffusion. (D) All TERT trajectories detected in a 45 s movie. Unexplored region marked by asterisk. (E) Diffusion coefficient histogram of telomerase tracks present for at least 5 consecutive frames (N = 18 cells, n = 5035 tracks). Two freely diffusing populations (D ~ 0.3 μm2/s, magenta; D ~ 1.3 μm2/s, blue) and a smaller less mobile population (D ~ 0.01 μm2/s, green) are present. Fractions of the total number of particles in each population are indicated. Also see Movies S1–S4.
Analysis of the diffusion coefficients of TERT tracks revealed three separate populations of telomerase particles (Fig. 2E). There were two rapidly diffusing populations (D ~ 0.3 μm2/s, ~ 53%; D ~ 1.3 μm2/s, ~ 33%), and a less mobile population (D ~ 0.01 μm2/s, ~ 14%) that (see below) represented telomerase RNPs bound to Cajal bodies or telomeres (Fig. 2E). These results demonstrate that the majority (> 85%) of telomerase RNPs are rapidly diffusing through the nucleus, searching for telomeres. This contrasts with fixed cell immunofluorescence, which gives the appearance of telomerase being mainly associated with Cajal bodies and telomeres (Fig. 1D).
Telomerase has Distinct Diffusion Properties at Cajal Bodies and Telomeres
To characterize the biophysical properties of telomerase RNPs interacting with distinct nuclear structures, we separated telomerase tracks into three groups: trajectories in close proximity to telomeres (marked by TRF2), or Cajal bodies (marked by coilin), and “nuclear” tracks that were close to neither of these (Fig. 3A). The diffusion coefficient profile of the nuclear tracks was indistinguishable from the profile of all trajectories (Fig. 2E, 3B). Strikingly, the diffusion coefficient distribution of TERT tracks in close proximity to Cajal bodies was enriched for the less mobile population (D ~ 0.01 μm2/s), consistent with telomerase binding, and only contained one rapidly diffusing population (D ~ 1.3 μm2/s, Fig. 3B), consistent with unbound telomerase. In contrast to the less mobile TERT in Cajal bodies, telomere-associated TERT trajectories instead contained a small highly static population (D ~ 0.001 μm2/s, ~ 4%, Fig. 3B). Importantly, the diffusion coefficient of TRF2 foci, measured by ourselves and others (Wang et al., 2008), matched that of the highly static TERT particles (D ~ 0.001 μm2/s, Fig. 3C, Movie S2), suggesting that this population represents telomerase RNPs stably associated with telomeres. Overall, the distinct diffusion coefficient profiles of TERT particles in close proximity with telomeres and Cajal bodies, compared to other nuclear sites, are consistent with telomerase forming molecular interactions with these structures.
Figure 3. Telomerase Has Distinct Diffusion Properties at Cajal Bodies and Telomeres.
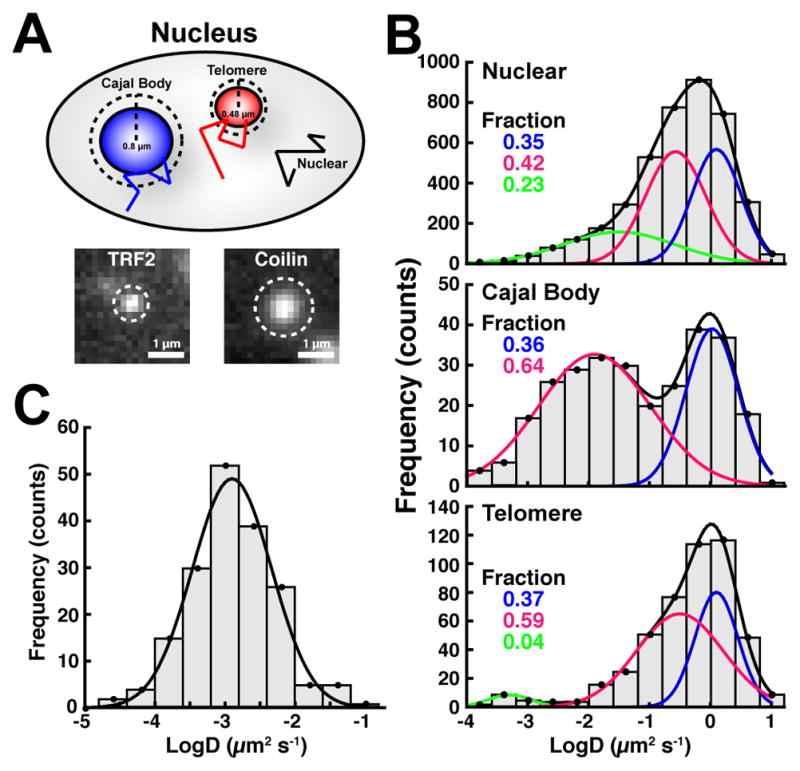
(A) Approach to spatially segregate telomerase tracks. Tracks were assigned to telomeres or Cajal bodies if they came within 3 pixels (0.48 μm) of the centroid of a TRF2 signal or 5 pixels (0.8 μm) of the centroid of a coilin signal, respectively. (B) Diffusion coefficient histograms of telomerase trajectories close to telomeres, Cajal bodies, or neither, present for at least 5 consecutive frames (N = 18 cells). Cajal body associated tracks are enriched for a less mobile population (D ~ 0.01 μm2/s), while telomere associated tracks instead display a highly static population (D ~ 0.001 μm2/s). Fractions of the total number of particles in each population are indicated. (C) Diffusion coefficient histogram of TRF2 tracks. Telomeres move with the same diffusion coefficient as the highly static telomere-associated TERT population (D ~ 0.001 μm2/s).
Telomerase Forms Two Types of Interactions with Telomeres
To further analyze the interactions of telomerase with telomeres, we generated kymographs of TERT associating with TRF2 foci (Fig. 4A–B). Telomerase formed two types of interactions with telomeres: Static long-lasting interactions (Fig. 4A, Movie S5) and short-lived dynamic interactions (Fig. 4B, Movie S6). To gain additional insight into telomerase-telomere interactions, we analyzed static TERT trajectories with diffusion coefficients D < 0.05 μm2/s for at least two consecutive frames (Fig. 4C), a method previously described for the analysis of single-molecule binding events (Knight et al., 2015; Normanno et al., 2015). Telomerase RNPs had an increased residence time at telomeres and Cajal bodies when compared to other nuclear locations (Fig. 4D), consistent with telomerase binding to these structures. On average a telomere was visited 3.7 times in 45 s (Fig. 4E). Thus, the average telomere is calculated to be bound by telomerase ~2400 times over the course of a single S-phase (~8 hours). To analyze long-lasting telomerase-telomere interactions, we reduced our imaging interval to 1 frame per second. Long-lasting, static binding events (Movie S7) ranged from ~0.5–8 min, with an average of 3.7 min (Fig. 4F). Approximately 15% of the telomeres showed a long-lasting association with telomerase in an 8 min movie. Importantly, all of these time and frequency measurements should be considered the lower bound of the actual number, given that only a subset of TERT molecules are labeled and that imaging was limited by photobleaching and a single focal plane. These observations demonstrate that telomerase engages in frequent, short, dynamic “probing” interactions and rare, long-lasting, static interactions with telomeres.
Figure 4. Telomerase Forms Transient/dynamic and Long/static Interactions with Telomeres.

Kymographs of telomerase tracks overlapping with TRF2 signals, showing (A) static long-lasting and (B) dynamic “probing” interactions. (C) Approach to analyze static TERT particles. Each TERT track segment represents the distance traveled in a single time interval (~22 ms). Large distances correspond to higher diffusion coefficients. When a binding event occurs, TERT signals remain largely static for several consecutive frames (arrows). By constraining the diffusion coefficient of the tracking algorithm to D < 0.05 μm2/s, only stationary TERT trajectories are analyzed. The length of these tracks corresponds to the time the particle is bound to a particular nuclear locus. (D) Quantification of the survival probability of stationary telomerase particles associated with telomeres, Cajal bodies and nuclear sites (N = 18 cells). TERT particles associate with Cajal bodies and telomeres for longer times than with other nuclear loci. (E) Frequency distribution of the occurrence of stationary particles per telomere in a 45 s timespan (N = 18 cells). (F) Distribution of the duration of long, static interactions between telomerase and telomeres (N = 13 cells, n = 29 interactions, horizontal bar = median, box = 25–75% percentile, whiskers = min-max). Also see Movies S5–S7.
Dynamic and Static Telomerase-telomere Interactions Require the TPP1-TERT Interaction
To define the molecular mechanism underlying the observed interactions between telomerase and telomeres, we utilized a point mutation in the TEN-domain of TERT (K78E), a separation-of-function mutation which does not inhibit enzymatic activity but prevents telomerase localization to telomeres in fixed cells (Schmidt et al., 2014). We introduced the K78E mutation at the endogenous TERT locus simultaneously with the HaloTag (Fig. S3A). Proper targeting of the TERT locus and the presence of the K78E mutation in all edited alleles was confirmed using PCR and Sanger sequencing (Fig. S3B–C). K78E FLAG-HaloTag-TERT was expressed at similar levels and had catalytic activity and processivity comparable to those of wild-type FLAG-HaloTag-TERT (Fig. S3D–E). As previously shown, K78E FLAG-HaloTag-TERT was only detected in Cajal bodies and not at telomeres in fixed cells (Fig. 5A)(Schmidt et al., 2014).
Figure 5. The TEN Domain-TPP1 Interaction Mediates the Association of Telomerase with Telomeres.

(A) Cyto-localization of K78E FLAG-HaloTag-TERT in fixed cells synchronized in S-phase. TERT was labeled with JF646; Cajal bodies and telomeres were stained with antibodies against coilin and TRF2, respectively. K78E TERT associates with Cajal bodies but not telomeres. (B–D) Comparison of the survival probabilities of stationary wild-type and K78E telomerase particles at different nuclear locations: (B) K78E telomerase particles at telomeres, Cajal bodies, and other nuclear sites, (C) Wild-type and K78E TERT at telomeres, (D) Wild-type and K78E TERT at Cajal bodies and other nuclear sites (N = 18 cells for wild-type, N = 14 cells for K78E TERT). K78E TERT particles at telomeres have dynamics indistinguishable from those at other nuclear locations, and they have a reduced survival probability compared to wild-type TERT. In contrast, survival probabilities at Cajal bodies and other nuclear locations are identical for both TERT proteins (also see Fig. S3F–H). (E) Diffusion coefficient histogram of telomeric K78E telomerase tracks present for at least 5 consecutive frames (N=14 cells). K78E telomerase lacks the highly static population (D ~ 0.001 μm2/s). See also Figure S3 and Movie S8.
Similar to wild-type telomerase, K78E telomerase rapidly diffused through the nucleus (Movie S8). Analysis of K78E telomerase trajectories demonstrated that its residence time at telomeres was indistinguishable from non-telomeric nuclear locations (Fig. 5B), indicating that it does not interact with telomeres. Wild-type telomerase had an increased lifetime at telomeres compared to K78E telomerase (Fig. 5C), while the residence times at Cajal bodies and other nuclear locations were identical between the two TERT proteins (Fig. 5D, S3F–H). These observations demonstrate that the K78E mutation specifically disrupts the interaction of telomerase with telomeres, but not with Cajal bodies. In addition, analysis of the diffusion coefficients of K78E telomerase trajectories close to telomeres showed that it lacks the static population (D ~ 0.001 μm2/s), characteristic of telomerase stably associated with telomeres (Fig. 5E), while the freely diffusing K78E TERT populations were similar to wild-type TERT. These results demonstrate that both the transient “probing” and long-lasting telomerase-telomere associations depend on the TPP1-TEN-domain interaction, and confirm that the interactions between wild-type telomerase and telomeres we observed are authentic binding events.
DISCUSSION
Telomere maintenance is critical for the survival of all continuously dividing cells, including most cancer cells. How human telomerase finds chromosome ends and how it is distributed to facilitate elongation of all telomeres have been two key unanswered questions. The live-cell imaging presented here provides a new model that explains how telomerase can monitor all telomeres despite its exceedingly low abundance (~250 RNPs/cell). The new model consists of three steps: (1) telomerase diffuses throughout the nuclear volume, except for the nucleolus, in a rapid 3D search for telomeres, (2) telomerase binds TPP1 at telomeres frequently, with telomeres being bound thousands of times per S phase, but most of these interactions are transient (< 1 s), and (3) only rarely are these probing interactions converted into static interactions that are sufficiently long to allow telomere elongation.
Telomerase Uses Three-dimensional Diffusion to Search for Telomeres
Prior to this work, telomerase localization in human cells was only possible in fixed cells, using either fluorescence in situ hybridization (FISH) or SNAP-tagged TERT (Xi et al., 2015). Data from fixed cells led to the conclusion that telomerase associates with telomeres in S-phase, and with Cajal bodies through most of the cell cycle (Schmidt and Cech, 2015). To our surprise, we observed that the majority of telomerase RNPs are freely diffusing throughout the nucleus and only a small subset of the telomerase particles forms interactions with telomeres and Cajal bodies at any given time. This information is lost by fixing cells, which integrates sites of telomerase enrichment over the fixation period, while freely diffusing molecules are either washed out or lost in the background.
We observed two distinct populations of freely diffusing TERT molecules of approximately equal abundance (D ~ 0.3 and 1.3 μm2/s, Fig. 3). These populations may represent fully assembled telomerase RNPs (D ~ 0.3 μm2/s) and TERT molecules that are not associated with TR (D ~ 1.3 μm2/s), consistent with the observation that ~50% of TERT molecules are not assembled into an RNP (Xi and Cech, 2014). In support of the model that the slowly diffusing TERT population (D ~ 0.3 μm2/s) contains TR, its diffusion coefficient is dramatically reduced (D ~ 0.01 μm2/s) in close proximity to Cajal bodies, indicating that it binds to Cajal bodies. The interaction between telomerase and Cajal bodies requires the association of TCAB1 with TR (Venteicher et al., 2009). In contrast, the rapidly diffusing TERT population (D ~ 1.3 μm2/s) does not interact with Cajal bodies (Fig. 3B), consistent with it lacking TR. Note that the major conclusions of the current work do not depend on this interpretation.
The observed diffusion coefficients of the TERT-containing particles (D ~ 0.3–1.3 μm2/s) are consistent with a large complex diffusing in the nucleus. Compared to the ~180 kDa dCas9-sgRNA RNP (D ~ 3–5 μm2/s) (Knight et al., 2015), telomerase diffuses slower, consistent with its expected greater mass (~ 600 kDa) (Egan and Collins, 2010; Sauerwald et al., 2013; Wu et al., 2015). Due to substoichiometric labeling of HaloTag-TERT, we cannot draw any conclusions about the oligomeric state of human telomerase. In contrast, human telomerase RNPs diffuse faster than the yeast telomerase RNP (D ~ 0.06 μm2/s) (Gallardo et al., 2011), which has an exceptionally large RNA subunit.
Telomerase Forms Probing and Stable Interactions with Telomeres
Our experimental system allowed us to interrogate telomerase-telomere interactions in greater detail than previously possible. We identified two separate modes of TERT interactions with chromosome ends. Telomerase frequently forms short, dynamic “probing” interactions with telomeres. We interpret this observation as TERT associating with TPP1, but most likely at telomere-internal locations not involving the 3′ overhang of the chromosome end (Fig. 6). Because the “probing” interactions are short lived (< 1s), telomerase is not trapped on a given telomere too long, allowing it to continue searching for the 3′ overhang. Given the low abundance of telomerase, minimizing non-productive interactions between TERT and the chromosome end is critical to facilitate elongation of most telomeres. Importantly, “probing” interactions occur thousands of times at each telomere over the course of S-phase.
Figure 6. Model for Telomerase Recruitment to Telomeres.

Telomerase forms frequent, short “probing” interactions with telomeres, mediated by the TPP1-TERT interaction, sampling each telomere thousands of times during S-phase. Conversion of a “probing” interaction into a long-lasting, static interaction, which involves engagement of the 3′ overhang of the chromosome, is slow and infrequent. This telomere-monitoring mechanism allows telomerase to take advantage of small windows of time during which the telomeric single-stranded overhang is available for binding.
In contrast to the frequent short “probing” interactions, long-static associations between telomerase and the telomere are exceedingly rare. The length of the static interactions (at least 0.5–8 min) is consistent with telomerase binding the 3′ overhang of the chromosome end, in addition to binding TPP1. These numbers are in remarkable agreement with the lifetime of enzymatically active telomerase-DNA-TPP1 complexes measured in vitro (t1/2 = 6.5 min, Dalby et al., 2015).
Importantly, both dynamic “probing” and long, static interactions require the TPP1-TERT interaction. We believe that the initial interaction between telomerase and the telomere involves an interaction between TPP1 and TERT and not the single-stranded overhang. Given the structure of telomerase (Jiang et al., 2015), binding to the 3′ overhang can be likened to threading a needle, most likely requiring a precise collision between the two binding partners, making it a slow process. Frequent probing of the telomere throughout S-phase could increase the local concentration of telomerase close to the 3′ overhang, allowing productive interactions to occur. When the TPP1-TERT interaction is disrupted, probing does not occur and and long-static binding events are not observed.
Comparison to Yeast Telomerase Recruitment
Human telomerase dynamics in live cells show both similarities and differences to the dynamics in yeast, the latter described by Gallardo et al. (2011). Similar features are the diffusive behavior of the bulk of the yeast telomerase and the occurrence of S-phase-specific stable associations with telomeres (5 – 45 s). A major difference is that the yeast telomerase forms Telomerase Recruitment clusters (T-Recs) at telomeres. The telomeres themselves are much more dynamic in yeast than in human nuclei. The transient probing interactions seen with human telomerase were not identified in yeast, but the temporal resolution (2.5–5 frames per second) at which the yeast experiments were carried out cannot rule out that short probing interactions also occur (Gallardo et al., 2011). There is no evidence for Cajal body localization of telomerase in yeast.
Implications for Human Telomere Maintenance
The conversion of transient “probing” interactions into stable associations with the 3′ overhang most likely depends on the state of the telomere. The availability of the 3′ overhang is likely regulated by telomeric structure, for instance the formation of T-loops, whether DNA replication has been completed at the telomere, and the signaling state of the telomere (Doksani et al., 2013; Lee et al., 2015; Tong et al., 2015). A previous report suggested that telomere elongation occurs within 30 min after the completion of DNA replication (Zhao et al., 2009). Given that the replication timing of telomeres is distributed all throughout S-phase (Arnoult et al., 2010), telomerase would be expected to localize to a small subset of telomeres at any given time-point during S-phase. As a direct consequence, only a small number of telomerase RNPs would be engaged in telomere elongation at a time, consistent with our observations. We favor a model in which the state of the telomere controls the accessibility of the 3′ overhang. Continuous and frequent probing of all telomeres by telomerase allows telomerase to take advantage of the small window of time during which the 3′ overhang is available for binding. During cell cycle stages other than S-phase, the single-stranded overhang is sequestered and stable telomerase-telomere interactions do not occur. In addition, a recent study showed that the volume of the telomere increases 2–3 fold during S-phase (Bandaria et al., 2016), providing a bigger target and potentially increasing the frequency of probing interactions.
Considering physiological nucleotide concentrations during S-phase, we estimate that telomerase is capable of adding ~15–30 nucleotides/min (Traut, 1994; Xi and Cech, 2014). Long, static telomerase-telomere associations are therefore sufficiently long for telomerase to add 50–200 nucleotides in a single processive elongation event, consistent with previous observations (Zhao et al., 2011). We cannot exclude the possibility of distributive telomere elongation. Since telomeres shrink at around 50 base pairs per cell division in human cells, the static interactions are long enough to allow telomere length maintenance.
Finally, our observations provide a model for preferential elongation of short telomeres (Teixeira et al., 2004). If a “probing” interaction occurred at a short telomere, the spatial separation between telomerase and the 3′ overhang would be smaller than at a long telomere, potentially increasing the probability of conversion into a stable association.
Some major questions remain. Do the transient probing interactions of telomerase with telomeres serve simply to increase the local concentration of telomerase, thereby facilitating its recruitment to the very end of the chromosome? Or once bound to an internal TPP1 molecule, can telomerase hop or slide along the telomere until it either finds the very end or dissociates? In addition, ATM/ATR signaling is required for human telomerase recruitment and action (Lee et al., 2015; Tong et al., 2015), and it will be important to investigate which step or steps in recruitment are dependent on these kinases. Finally, future experiments need to address whether the long-lasting telomerase-telomere interactions we observe indeed require base pairing between the TR and the chromosome 3′ overhang.
Solving a Difficult Recruitment Problem
Telomerase has exceedingly low abundance (~250 molecules per HeLa cell), and it must find telomeres which are also rare (~0.01% of human chromatin is telomeric). The three-step pathway described here represents an elegant solution to this problem. Random diffusion allows telomerase to rapidly encounter telomeres. However, the initial encounter is likely to be with an internal TPP1 protein, because these outnumber chromosome ends by about 100:1 (Takai et al., 2010). Thus, if the initial binding event were highly stable, the bulk telomere could act as a sink for telomerase and actually prevent it from finding the very end of the chromosome. Instead, these interactions are transient, and they serve to get telomerase to the vicinity of the chromosome end. Finally, when telomerase engages with both TPP1 and the single-stranded DNA overhang, it binds especially well (Dalby et al., 2015). Such a multi-step recruitment process may have more general implications for how rare complexes find each other within the mammalian cell nucleus.
METHODS AND RESOURCES
CONTACT FOR REAGENT AND RESOURCE SHARING
Plasmids generated in this study are available from AddGene. For other reagents generated in this study or any other questions about the reagents please contact Thomas Cech (thomas.cech@colorado.edu).
EXPERIMENTAL MODEL AND SUBJECT DETAILS
Cell Lines and Tissue Culture
All cell lines were derivatives of Hela-EM2-11ht (Weidenfeld et al., 2009) and were grown in high glucose Dulbecco’s Modified Eagle Medium (DMEM) supplemented with 10% fetal bovine serum (FBS), 2 mM GlutaMAX™-I (Life Technologies), 100 units/ml penicillin and 100 μg/ml streptomycin at 37 °C with 5% CO2. Imaging experiments were carried out in CO2 independent media supplemented with 10% FBS, 2 mM GlutaMAX™-I (Life Technologies), 100 units/ml penicillin and 100 μg/ml streptomycin in a humidified imaging chamber heated to 37 °C. For S-phase synchronization, cells were arrested in growth medium containing 2 mM thymidine for 16 h, released for 9 h, followed by a second thymidine 16 h arrest prior to release into S-phase. Puromycin selection was carried out at a concentration of 1 μg/ml (Sigma).
METHOD DETAILS
Plasmid Construction and Genome Editing
The FLAG-HaloTag donor plasmid was generated by replacing the SNAP-tag in the previously described FLAG-SNAP donor plasmid (Xi et al., 2015). The HaloTag and TERT sequences were separated by a linker sequence including a TEV protease cleavage site (EPTTEDLYFQSDNAIAS), derived from pHTN HaloTag® CMV-neo vector (Promega). The HA-mEOS3.2 donor plasmid was generated by amplifying the TRF2 homology arms of HeLa genomic DNA, and mEOS3.2 was amplified from a plasmid (mEos3.2-N1 was a gift from Michael Davidson, Addgene plasmid #54525). The fragments were ligated into pFASTBac linearized with HpaI using Gibson Assembly (NEB). All sgRNAs were cloned into pX330 as previously described (Cong et al., 2013). The BFP-coilin vector was generated by cloning the coilin ORF (MGC cDNA, CloneID:4275993, GE Dharmacon) into a BFP-LAP vector (a kind gift from Iain Cheeseman, M.I.T., Cambridge, MA) (Cheeseman and Desai, 2005). The GFP-Nucleolin plasmid was a gift from Michael Kastan (Addgene plasmid # 28176) (Takagi et al., 2005). The SNAP-tag was replaced with the HaloTag by transfection Cas9, two sgRNA plasmids targeting the SNAP-sequence and the HaloTag donor plasmid. All transfections were carried out using the Nucleofector™ 2b device, using Kit R and the high efficiency protocol for HeLa cells (Lonza). Following selection with puromycin, cells were transfected with an eGFP-CRE recombinase and single cells were sorted using the eGFP signal, as previously described (Fig. S1) (Le et al., 1999; Xi et al., 2015). Elimination of the SNAP-tag and presence of the HaloTag were confirmed by PCR and Sanger sequencing. For K78E TERT, the donor construct included the point mutation leading to the amino acid change. Presence of the mutation in single-cell clones was confirmed by Sanger sequencing (Fig. S2B–C). HA-mEOS3.2 was introduced at the endogenous TRF2 locus by co-transfection of a plasmid encoding Cas9 and a single sgRNA targeting the 5′ end of the TRF2 coding sequence and the HA-mEOS3.2 donor plasmid. Single clones were generated by cell sorting, and homologous recombination was confirmed by PCR and Sanger sequencing. All PCR oligonucleotides and sgRNA sequences are listed in the Key Resource Table.
KEY RESOURCES TABLE.
| REAGENT or RESOURCE | SOURCE | IDENTIFIER |
|---|---|---|
| Antibodies | ||
| anti-TERT rabbit monoclonal | Abcam | Ab32020 |
| anti-Rabbit peroxidase-Affinipure | Jackson Labs | 711-035-152 |
| anti-TRF2 mouse monoclonal | Imgenex | IMG-124A |
| anti-HA mouse monoclonal | Abcam | ab18181 |
| anti-Coilin rabbit polyclonal | Santa Cruz Biotech. | sc-32860 |
| anti-53BP1 rabbit polyclonal | Novus Biologicals | NB100-304 |
| anti-Mouse Alexa 488 preabsorbed | Abcam | Ab150117 |
| anti-Rabbit Alexa 405 | Life Technologies | A-31556 |
| anti-Rabbit Alexa 647 | Life Technologies | A-21244 |
| anti-TERT sheep polyclonal | Cohen et al., 2007 | N/A |
| Chemicals, Peptides, and Recombinant Proteins | ||
| JF646 HaloTag Ligand | Grimm et al., 2015 | N/A |
| JF646 SNAP-tag Ligand | Grimm et al., 2015 | N/A |
| Prolong Diamond Antifade Mountant | Life Technologies | P36970 |
| Cell line Nucleofector Kit R | Lonza | VCA-1001 |
| Puromycin 10 mg/ml | Sigma | P9620-10ML |
| Thymidine | Sigma | T1895 |
| GlutaMAX™ Supplement | ThermoFisher Scientific | Cat # 35050061 |
| SuperSignal® West Femto Chemiluminescent Substrate | ThermoFisher Scientific | Cat # 34095 |
| Experimental Models: Cell Lines | ||
| HeLa EM2-11ht | Weidenfeld et al., 2009 | N/A |
| HeLa EM2-11ht, FLAG-HaloTag-TERT WT, HA-mEOS3.2-TRF2 | This Paper | N/A |
| HeLa EM2-11ht, FLAG-HaloTag-TERT K78E, HA-mEOS3.2-TRF2 | This Paper | N/A |
| HeLa EM2-11ht, FLAG-SNAP-TERT | Xi et al., 2015 | N/A |
| Recombinant DNA | ||
| pHTN HaloTag® CMV-neo | Promega | G7721 |
| pFastBac1 | Life Technologies | 10360014 |
| FLAG-LoxP-PURO-LoxP-SNAP-TERT HR Donor | Xi et al., 2015 | Addgene: 71390 |
| FLAG-LoxP-PURO-LoxP-HaloTag-TERT WT HR Donor | This Paper | N/A to be deposited |
| FLAG-LoxP-PURO-LoxP-HaloTag-TERT K78E HR Donor | This Paper | N/A to be deposited |
| LAP-BFP-Coilin | Cheeseman et al., 2005 | N/A to be deposited |
| pX330 | Cong et al., 2013 | Addgene: 42230 |
| mEos3.2-N1 | Zhang et al., 2012 | Addgene: 54525 |
| HA-mEOS3.2-TRF2 HR Donor | This Paper | N/A to be deposited |
| BFP-Nucleolin | Takagi et al., 2005 | Addgene: 28176 |
| Sequence-Based Reagents | ||
| sgRNA SNAP1: CATTTCGCAATCTTTGTCCA | This Paper | N/A |
| sgRNA SNAP2: GGTATAGGCGCGCCAGGATC | This Paper | N/A |
| TRF2 PCR oligo 1 for Gibson Assembly into pFastBac1: CATAAAATGAATGCAATTGTTGTTGTTGGCCACCTGCACTTCTGAGTTGT | This Paper | N/A |
| TRF2 PCR oligo 2 for Gibson Assembly into pFastBac1: CTGGAACATCGTATGGGTACATCGTGTCCGATCGCCGCGCG | This Paper | N/A |
| TRF2 PCR oligo 3 for Gibson Assembly into pFastBac1: CAATGCCAGACGAGGATCCATGGCGGGAGGAGGCGGGAGTAG | This Paper | N/A |
| TRF2 PCR oligo 4 for Gibson Assembly into pFastBac1: CATTATAAGCTGCAATAAACAAGTTCCCATCCTCCTCAGATACGAGTGGCAAG | This Paper | N/A |
| mEOS3.2 PCR oligo 1 for Gibson Assembly into pFastBac1: ATGTACCCATACGATGTTCCAGATTACGCTATGAGTGCGATTAAGCCAGACATG | This Paper | N/A |
| mEOS3.2 PCR oligo 2 for Gibson Assembly into pFastBac1: GGATCCTCGTCTGGCATTGTCAGGCAATC | This Paper | N/A |
| HaloTag PCR Oligo 1: GCGCGCGGTACCATGGCAGAAATCGGTACTGGCTTTCC | This Paper | N/A |
| HaloTag PCR Oligo 2: GCGCGCGGTACCGGAAGCGATCGCGTTATCGC | This Paper | N/A |
| Coilin PCR Oligo 1: GCGCGCCTCGAGATGGCAGCTTCCGAGACGGTTAG | This Paper | N/A |
| Coilin PCR Oligo 2: GCGCGCGGTACCTCAGGCAGGTTCTGTACTTGATGTGTTAC | This Paper | N/A |
| Coilin Image Clone | GE Dharmacon | CloneID: 4275993 |
| Software and Algorithms | ||
| MatLab2011b | Mathworks Inc., USA | http://mathworks.com |
| SLIMfast MatLab script | Liu et al., 2014; Serge et al., 2008 | Provided by Zhe Liu liuz11@janelia.hhmi.org |
| evalSPT MatLab script | Liu et al., 2014; Normanno et al., 2015 | Provided by Zhe Liu liuz11@janelia.hhmi.org |
| DiffusionSingle MatLab script | Liu et al., 2014 | Provided by Zhe Liu liuz11@janelia.hhmi.org |
| MSDanalyzer MatLab script | Tarantino et al., 2014 | https://www.mathworks.com/matlabcentral/fileexchange/40692-mean-square-displacement-analysis-of-particles-trajectories |
| Other | ||
| TetraSpeck™ microspheres | ThermoFisher Scientific | T-7279 |
| NuPAGE NOVEX 4-12% Bis-Tris Protein Gels | ThermoFisher Scientific | Cat # NP0321BOX |
| Protein G Agarose | Roche | Cat # 11719416001 |
| ANTI-FLAG® M2 Affinity | Sigma | A2220 |
Single Molecule Live Cell Imaging
All single molecule live cell imaging was carried out on a Nikon N-STORM microscope, equipped with a TIRF illuminator, 405 nm (20 mW), 488 nm (50 mW), 561 nm (50 mW), and 647 nm (125 mW) laser lines, an environmental chamber to control humidity and temperature, two iXon Ultra 897 EMCCD cameras (Andor), a 100x oil-immersion objective (Nikon, NA = 1.49), two filter wheels, and the appropriate filter sets. Cells were cultured on Nexterion coverslips (170 +/− 5 μm, Schott). Coverslips were cleaned twice with 1 M KOH (sonicated for 30 min) and 100% ethanol (sonicated for 1 h) to reduce fluorescence background (a kind suggestion by Zhe Liu), prior to assembly of a 35 mm diameter imaging dish. BFP-coilin was transfected into cells 48 h prior to imaging, followed by a double thymidine block. 3–4 h after release into S-phase, FLAG-HaloTag-TERT was labeled by subjecting cells to a 1 min pulse of 50 nM JF646- Halo ligand (a kind gift from Luke Lavis) in tissue culture medium (Grimm et al., 2015). After the pulse, cells were washed three times in media and placed back in the incubator for 15 min. Immediately before imaging, the medium was replaced by washing the cells twice with CO2 independent media. First, BFP-coilin was imaged using the 405 nm laser line (~25% laser power) for ~10 s under continuous illumination, to visualize Cajal bodies and convert mEOS3.2 into its red state (Fig. 2A). To image TRF2 and TERT, cells were then imaged by illuminating continuously with the 561 nm (~6% laser power) and 647 nm (~25% laser power) lasers for 45 s with 20 ms exposure times for an effective frame rate of 45 frames per s using a 256×256 pixel region of interest. Emission light for the mEOS3.2 and JF646 channels was projected on two separate EMCCD cameras, which were aligned using TetraSpeck™ microspheres (ThermoFisher). All imaging was carried out under HILO conditions (Tokunaga et al., 2008). For imaging of the long-lasting static binding events, cells were imaged in 1 s intervals with 20 ms exposure times.
Immunofluorescence Imaging
The HaloTag was labelled using 500 nM JF646 HaloTag ligand for 30 min in tissue culture medium. Following HaloTag labelling, cells were washed with PBS and pre-extracted with Triton X Buffer (20 mM HEPES pH 7.9, 50 mM NaCl, 3 mM MgCl2, 300 mM sucrose, 0.5% Triton X-100) for 1 min on ice, rinsed with PBS and fixed with formaldehyde (4% formaldehyde, 2% sucrose in PBS) for 10 min at room temperature. Cells were then re-permeabilized using Triton X Buffer for 10 min at room temperature and incubated in blocking buffer (3% BSA in PBS) for 30 min. After blocking, cells were incubated with primary antibodies for TRF2 (Imgenex, IMG-124A, 1:500) or the HA epitope (Abcam, ab18181, 1:1000) and coilin (Santa Cruz, sc-32860, 1:100) or 53BP1 (Novus Biologicals, NB100–304, 1:1000) in blocking buffer for 1 h. Next, cells were washed with PBS and incubated with secondary antibodies (Life Technologies and Abcam, 1:500) in blocking buffer for 1 h. After a final wash, cells were mounted using ProLong® Diamond Antifade Mountant (Life Technologies, P36970). All images were acquired on a Deltavision Core microscope (Applied Precision) using a 60× 1.42NA PlanApo N objective (Olympus) and a sCMOS camera. Twenty Z-sections with 0.2 μm spacing were acquired for each image with identical exposure conditions within each experiment. For presentation in figures, representative images were generated by maximum intensity projections of 5 Z-sections, which were scaled identically for all experimental conditions.
Telomerase Purification and Activity Assay
FLAG IP was performed with Anti-FLAG® M2 Affinity Gel (Sigma-Aldrich, A2220) using HeLa cell lysates prepared with CHAPS lysis buffer (10 mM Tris-HCl pH 7.5, 1 mM MgCl2, 1 mM EGTA, 0.5% CHAPS, 10% glycerol, 1 mM PMSF, 1 mM DTT). Telomerase IP was carried out with a sheep polyclonal anti-TERT antibody, which was a gift from Scott Cohen (Children’s Medical Research Institute and University of Sydney, Sydney, Australia). The HaloTag and SNAP-tag were labeled during the incubation with the resin using a concentration 0.5 μM of the respective JF646 ligand. The telomerase purifications and activity assays were carried out as previously described using primer substrate concentration of 100 nM (Cohen and Reddel, 2008; Cohen et al., 2007; Xi and Cech, 2014). Purification of POT1/TPP1 and telomerase assays in the presence of POT1/TPP1 were as described (Schmidt et al., 2014), with POT1/TPP1 used at a concentration of 300 nM. Loading controls were phosphorylated telomeric DNA 18- and 21-mers.
Western Blotting
The protein samples were separated on 4–12% Bis-Tris gels (Life Technologies), followed by standard western blotting procedures. A primary antibody anti-TERT (Abcam, ab32020, 1:1000) and a secondary antibody peroxidase-AffiniPure donkey anti-rabbit IgG (H+L) (Jackson, 711-035-152, 1:5000) were used to detect TERT. The specificity of the ab32020 antibody is described by Xi and Cech (2014). SuperSignal® West Femto Chemiluminescent Substrate (Thermo Scientific) was used to generate enhanced chemiluminescence signal, which was detected with a FluorChem HD2 imaging system (Alpha Innotech). JF646 fluorescence was detected using a Typhoon Trio PhosphorImager (GE Healthcare).
QUANTIFICATION AND STATISTICAL ANALYSIS
Single Particle Tracking
Single particle trajectories were generated with MatLab 2011b (Mathworks Inc., USA) using SLIMfast, which implements the Multiple-Target-Tracing algorithm (Liu et al., 2014; Sergé et al., 2008), and evaluated using the script evalSPT (Normanno et al., 2015). Tracking parameters are listed in Table S1. For the analysis of telomerase diffusion, the maximal expected diffusion coefficient was set to D = 5 μm2/s. Diffusion coefficients were calculated for tracks present for at least 5 consecutive frames using the DiffusionSingle MatLab script (kindly provided by Zhe Liu), which implements the MSDanalyzer script using a minimal fitting R2 of 0.8 (Tarantino et al., 2014). Diffusion coefficient histograms were fit using MatLab with the minimal number of Gaussian terms that yielding a fit with a R2 > 0.95. For analysis of the survival probability of TERT associations with Cajal bodies, telomeres, and non-specific nuclear loci the maximal expected diffusion coefficient was set to D = 0.05 μm2/s, as previously described (Knight et al., 2015; Normanno et al., 2015). Briefly, constraining the diffusion coefficient to D = 0.05 μm2/s allowed us to identify stationary particles, with the underlying assumption that stationary TERT particles represent telomerase RNPs that are forming an interaction with an immobile nuclear structure, such as telomeres or Cajal bodies. Survival probabilities were plotted for stationary TERT particles present for at least 2 consecutive frames. To separate tracks into telomere, Cajal body, or nuclear tracks, the distance between TERT coordinates and the mean position of all telomeres and Cajal bodies was calculated. If any localization was within 3 pixels of a TRF2 centroid (480 nm) or 5 pixels of coilin centroid (800 nm), the corresponding track was assigned to the telomere or Cajal body group, respectively (Fig. 2C, S5A-B). To calculate the telomere binding frequency, each track in the telomere group was assigned to the telomere with which it came into proximity. To analyze long static binding events, TERT and TRF2 movies were superimposed, movies were inspected manually, and binding events were defined as TERT-TRF2 co-localization that co-diffused for extended periods of time (Movie S7).
Telomerase Activity and Processivity
Telomerase activity was calculated as the total radioactive signal of all repeats for each direct telomerase extension reaction and was normalized to the loading control and the TERT western blot signal. Quantification of radioactive and western blot signals was carried out with ImageQuant TL. Processivity was calculated as the ratio of signal in product repeats > 6 to the total product signal.
Supplementary Material
Figure S1. Generation and analysis of genome-edited cell lines for live cell imaging of TERT (related to Fig. 1). (A) Genome editing strategy to replace the SNAP-tag with the HaloTag. Two sgRNAs were used to excise the SNAP-tag from the endogenous TERT locus. A homologous recombination (HR) donor plasmid was supplied including the HaloTag and a puromycin resistance cassette. After puromycin selection to enrich for cells that had undergone HR, eGFP-CRE was transiently expressed in the cells and single cell clones were generated from the eGFP-positive cell population. (B) Agarose gels of PCR products amplified from genomic DNA of genome-edited clones using the indicated primers. Expected product sizes are indicated. The two clones highlighted in red are referred to as clones 1 and 2 in the main figures. (C) Direct telomerase extension assay of endogenous telomerase purified with a TERT antibody and FLAG-HaloTag telomerase purified with a FLAG antibody in the absence and presence of the POT1/TPP1 complex. POT1/TPP1 enhances telomerase processivity to the same degree for endogenous and HaloTag telomerases. Processivity was calculated as ratio of the signals of all repeats > 6 to the total activity. (D) Western blot probed with an anti-TERT antibody of the protein samples used for the activity assay shown in S1C. (E) Direct telomerase extension assay of anti-FLAG purifications from the indicated cell lines. Telomerase activity is IP’d from genome-edited but not parental HeLa cell lines. LC1 and 2, loading controls.
Figure S2. Generation and analysis of genome-edited cell lines for live cell imaging of TRF2 (related to Fig. 1). (A) Diagram of the genome-edited TRF2 locus indicating the primers used to amplify the PCR product shown in the agarose gel below. (B) Agarose gel of PCR products amplified from the genomic DNA of the indicated cell lines using the primers shown in (A) (arrows). The genome-edited clone shows a PCR product with a size increase corresponding to the HA-mEOS3.2-tag introduced. (C) Cyto-localization of HA-mEOS3.2-TRF2 detected using an anti-HA antibody and telomeres marked with a Rap1 antibody. HA-mEOS3.2-TRF2 localizes to telomeres. (D) Imaging of telomeres, marked by TRF2, and sites of DNA-damage, marked by 53BP1, in parental and genome-edited cell lines to detect telomere dysfunction-induced foci. The average number of telomere dysfunction-induced foci per cell is indicated in white (N = 36 cells for all conditions).
Figure S3. Introduction and analysis of the FLAG-HaloTag and K78E mutation at the endogenous TERT locus (related to Fig. 5). (A) Genome editing strategy to replace the SNAP-tag with the HaloTag and introduce the K78E mutation in the TERT coding sequence. In addition to the procedure used for wild-type TERT, the right homology arm included a single base-pair change to introduce the K78E mutation in exon 2 of the TERT locus. (B) Agarose gels of PCR products amplified from genomic DNA of genome-edited clones using the indicated primers. Expected product sizes are indicated. The two clones highlighted in red are referred to as clones 1 and 2 in the main figures. (C) Sanger sequencing traces of a wild-type TERT and the two K78E clones generated from PCR products of the genomic DNA of the respective clones. Boxed in red is the sequence of the base triplet coding for lysine in the wild-type allele (AAG) and glutamic acid in the mutant allele (GAG). (D) Western blot and fluorescence imaging of TERT immuno-purified from genome-edited cells lines, using FLAG and TERT antibodies. The HaloTag and SNAP-tag were labeled with JF646. (E) Direct telomerase extension assay using immuno-purified TERT. LC1 and 2, labeled oligonucleotide loading controls. K78E FLAG-HaloTag telomerase has comparable activity and processivity to wild-type FLAG-HaloTag telomerase. (F-H) A second replicate of the data shown in Figure 5B–D (N = 8 cells for each TERT allele).
Table S1. Tracking Parameter for 2D single-particle tracking
Movie S1. Tracking of TERT in the nuclei of live HeLa cells (related to Fig. 2). 2D-tracking of FLAG-HaloTag-TERT (green, λex = 647 nm, λem = 670 nm) labeled with JF646 in the nucleus of a HeLa cell. The movie was acquired with an exposure time of 20 ms for an effective frame rate of 45 frames per second. HA-mEOS3.2-TRF2 signals (red, λex = 561 nm, λem = 590 nm) are a maximum intensity projection of the first 50 frames of the movie acquired simultaneously to TERT. TRF2 signals are static over the time course of the experiment (see Movie S2) allowing the use of a static image, avoiding the effects of photo-bleaching. BFP-coilin signals (blue, λex = 405 nm, λem = 450 nm) are maximum intensity projections of the first 50 frames of a movie acquired immediately before simultaneous tracking TERT and TRF2. Coilin signals are static over the time course of the experiment (see Movie S2) allowing the use of a static image, avoiding the effects of photo-bleaching (Scale bar = 5 μm, Timestamp in ms).
2D-tracking of HA-mEOS3.2-TRF2 in the nucleus of a living HeLa cell (λex = 561 nm, λem = 590 nm). The movie was acquired with an exposure time of 20 ms for an effective frame rate of 45 frames per second (Scale bar = 5 μm, Timestamp in ms).
2D-tracking of BFP-coilin (λex = 405 nm, λem = 450 nm) in the nucleus of a living HeLa cell. The movie was acquired with an exposure time of 50 ms for an effective frame rate of 13.9 frames per second (Scale bar = 5 μm, Timestamp in ms).
2D-tracking of FLAG-HaloTag-TERT (green, λex = 647 nm, λem = 670 nm) labeled with JF646 in the nucleus of a HeLa cell. The movie was acquired with an exposure time of 20 ms for an effective frame rate of 45 frames per second. HA-mEOS3.2-TRF2 signals (red, λex = 561 nm, λem = 590 nm) are a maximum intensity projection of the first 50 frames of the movie acquired simultaneously to TERT. TRF2 signals are static over the time course of the experiment (see Movie S2) allowing the use of a static image, avoiding the effects of photo-bleaching. GFP-nucleolin signals (blue, λex = 488 nm, λem = 525 nm) are maximum intensity projections of the first 50 frames of a movie acquired immediately after simultaneous tracking of TERT and TRF2. Nucleoli are static over the time course of the experiment, allowing the use of a static image, avoiding the effects of photo-bleaching (Scale bar = 5 μm, Timestamp in ms).
Simultaneous tracking of HA-mEOS3.2-TRF2 (top panel, red, λex = 561 nm, λem = 590 nm) and FLAG-HaloTag-TERT (middle panel, green, λex = 647 nm, λem = 670 nm). The movie was acquired with an exposure time of 20 ms for an effective frame rate of 45 frames per second. Bottom panel is a merge of TRF2 (red) and TERT (green) signals. Each panel is 30×30 pixels in size (4.8 μm × 4.8 μm).
Simultaneous tracking of HA-mEOS3.2-TRF2 (top panel, red, λex = 561 nm, λem = 590 nm) and FLAG-HaloTag-TERT (middle panel, green, λex = 647 nm, λem = 670 nm). The movie was acquired with an exposure time of 20 ms for an effective frame rate of 45 frames per second. Bottom panel is a merge of TRF2 (red) and TERT (green) signals. Each panel is 30×30 pixels in size (4.8 μm × 4.8 μm).
Three more examples of long-lasting static TERT-TRF2 interactions. Simultaneous tracking of HA-mEOS3.2-TRF2 (top panel, red, λex = 561 nm, λem = 590 nm) and FLAG-HaloTag-TERT (middle panel, green, λex = 647 nm, λem = 670 nm). The movie was acquired with an exposure time of 20 ms at a time interval of 1 frame per second (total movie length 8 minutes, sped up to 20 frames per second). Bottom panel is a merge of TRF2 (red) and TERT (green) signals. Each panel is 30×30 pixels in size (4.8 μm × 4.8 μm).
2D-tracking of K78E FLAG-HaloTag-TERT (green, λex = 647 nm, λem = 670 nm) labeled with JF646 in the nucleus of a HeLa cell. The movie was acquired with an exposure time of 20 ms for an effective frame rate of 45 frames per second. HA-mEOS3.2-TRF2 signals (red, λex = 561 nm, λem = 590 nm) are a maximum intensity projection of the first 50 frames of the movie acquired simultaneously to TERT. TRF2 signals are static over the time course of the experiment (see Movie S2) allowing the use of a static image, avoiding the effects of photo-bleaching. BFP-coilin signals (blue, λex = 405 nm, λem = 450 nm) are maximum intensity projections of the first 50 frames of a movie acquired immediately before simultaneous tracking of TERT and TRF2. Coilin signals are static over the time course of the experiment (see Movie S2) allowing the use of a static image, avoiding the effects of photo-bleaching (Scale bar = 5 μm, Timestamp in ms).
Acknowledgments
We thank Cech lab members for assistance with experiments and useful discussions, Joe Dragavon and the BioFrontiers Advanced Light Microscopy Core for assistance with imaging, and Luke Lavis and Zhe Liu (HHMI Janelia Research Campus) for providing HaloTag dyes and assistance with data analysis. J.C.S. is a Merck Fellow of the Damon Runyon Cancer Research Foundation (DRG-2169-13). T.R.C. is an investigator of the Howard Hughes Medical Institute and is on the board of directors of Merck.
Footnotes
Author Contributions
J.C.S. and T.R.C. designed research, J.C.S. carried out experiments, and J.C.S. and T.R.C. wrote the paper. A.J.Z. carried out telomerase purifications and activity assays.
References
- Arnoult N, Schluth-Bolard C, Letessier A, Drascovic I, Bouarich-Bourimi R, Campisi J, Kim SH, Boussouar A, Ottaviani A, Magdinier F, et al. Replication timing of human telomeres is chromosome arm-specific, influenced by subtelomeric structures and connected to nuclear localization. PLoS Genet. 2010;6:e1000920–e1000920. doi: 10.1371/journal.pgen.1000920. [DOI] [PMC free article] [PubMed] [Google Scholar]
- Bandaria JN, Qin P, Berk V, Chu S, Yildiz A. Shelterin Protects Chromosome Ends by Compacting Telomeric Chromatin. Cell. 2016;164:735–746. doi: 10.1016/j.cell.2016.01.036. [DOI] [PMC free article] [PubMed] [Google Scholar]
- Bell RJA, Rube HT, Kreig A, Mancini A, Fouse SD, Nagarajan RP, Choi S, Hong C, He D, Pekmezci M, et al. Cancer. The transcription factor GABP selectively binds and activates the mutant TERT promoter in cancer. Science. 2015;348:1036–1039. doi: 10.1126/science.aab0015. [DOI] [PMC free article] [PubMed] [Google Scholar]
- Borah S, Xi L, Zaug AJ, Powell NM, Dancik GM, Cohen SB, Costello JC, Theodorescu D, Cech TR. Cancer. TERT promoter mutations and telomerase reactivation in urothelial cancer. Science. 2015;347:1006–1010. doi: 10.1126/science.1260200. [DOI] [PMC free article] [PubMed] [Google Scholar]
- Cheeseman IM, Desai A. A combined approach for the localization and tandem affinity purification of protein complexes from metazoans. Sci STKE. 2005;2005(266) doi: 10.1126/stke.2662005pl1. [DOI] [PubMed] [Google Scholar]
- Cohen SB, Reddel RR. A sensitive direct human telomerase activity assay. Nat Meth. 2008;5:355–360. doi: 10.1038/nmeth.f.209. [DOI] [PubMed] [Google Scholar]
- Cohen SB, Graham ME, Lovrecz GO, Bache N, Robinson PJ, Reddel RR. Protein composition of catalytically active human telomerase from immortal cells. Science. 2007;315:1850–1853. doi: 10.1126/science.1138596. [DOI] [PubMed] [Google Scholar]
- Cong L, Ran FA, Cox D, Lin S, Barretto R, Habib N, Hsu PD, Wu X, Jiang W, Marraffini LA, et al. Multiplex genome engineering using CRISPR/Cas systems. Science. 2013;339:819–823. doi: 10.1126/science.1231143. [DOI] [PMC free article] [PubMed] [Google Scholar]
- Dalby AB, Hofr C, Cech TR. Contributions of the TEL-patch Amino Acid Cluster on TPP1 to Telomeric DNA Synthesis by Human Telomerase. J Mol Biol. 2015;427:1291–1303. [Google Scholar]
- de Lange T. Shelterin: the protein complex that shapes and safeguards human telomeres. Genes Dev. 2005;19:2100–2110. doi: 10.1101/gad.1346005. [DOI] [PubMed] [Google Scholar]
- Doksani Y, Wu JY, de Lange T, Zhuang X. Super-resolution fluorescence imaging of telomeres reveals TRF2-dependent T-loop formation. Cell. 2013;155:345–356. doi: 10.1016/j.cell.2013.09.048. [DOI] [PMC free article] [PubMed] [Google Scholar]
- Egan ED, Collins K. Specificity and stoichiometry of subunit interactions in the human telomerase holoenzyme assembled in vivo. Mol Cell Biol. 2010;30:2775–2786. doi: 10.1128/MCB.00151-10. [DOI] [PMC free article] [PubMed] [Google Scholar]
- Gallardo F, Laterreur N, Cusanelli E, Ouenzar F, Querido E, Wellinger RJ, Chartrand P. Live cell imaging of telomerase RNA dynamics reveals cell cycle-dependent clustering of telomerase at elongating telomeres. Mol Cell. 2011;44:819–827. doi: 10.1016/j.molcel.2011.09.020. [DOI] [PubMed] [Google Scholar]
- Grimm JB, English BP, Chen J, Slaughter JP, Zhang Z, Revyakin A, Patel R, Macklin JJ, Normanno D, Singer RH, et al. A general method to improve fluorophores for live-cell and single-molecule microscopy. Nat Meth. 2015;12:244–50. doi: 10.1038/nmeth.3256. [DOI] [PMC free article] [PubMed] [Google Scholar]
- Harley CB, Futcher AB, Greider CW. Telomeres shorten during ageing of human fibroblasts. Nature. 1990;345:458–460. doi: 10.1038/345458a0. [DOI] [PubMed] [Google Scholar]
- Horn S, Figl A, Rachakonda PS, Fischer C, Sucker A, Gast A, Kadel S, Moll I, Nagore E, Hemminki K, et al. TERT promoter mutations in familial and sporadic melanoma. Science. 2013;339:959–961. doi: 10.1126/science.1230062. [DOI] [PubMed] [Google Scholar]
- Huang FW, Hodis E, Xu MJ, Kryukov GV, Chin L, Garraway LA. Highly recurrent TERT promoter mutations in human melanoma. Science. 2013;339:957–959. doi: 10.1126/science.1229259. [DOI] [PMC free article] [PubMed] [Google Scholar]
- Jády BE, Richard P, Bertrand E, Kiss T. Cell cycle-dependent recruitment of telomerase RNA and Cajal bodies to human telomeres. Mol Biol Cell. 2006;17:944–954. doi: 10.1091/mbc.E05-09-0904. [DOI] [PMC free article] [PubMed] [Google Scholar]
- Jiang J, Chan H, Cash DD, Miracco EJ, Ogorzalek Loo RR, Upton HE, Cascio D, O’Brien Johnson R, Collins K, Loo JA, et al. Structure of Tetrahymena telomerase reveals previously unknown subunits, functions, and interactions. Science. 2015;350:aab4070. doi: 10.1126/science.aab4070. [DOI] [PMC free article] [PubMed] [Google Scholar]
- Knight SC, Xie L, Deng W, Guglielmi B, Witkowsky LB, Bosanac L, Zhang ET, El Beheiry M, Masson J-B, Dahan M, et al. Dynamics of CRISPR-Cas9 genome interrogation in living cells. Science. 2015;350:823–826. doi: 10.1126/science.aac6572. [DOI] [PubMed] [Google Scholar]
- Le Y, Miller JL, Sauer B. GFPcre fusion vectors with enhanced expression. Analytical Biochemistry. 1999;270:334–336. doi: 10.1006/abio.1999.4110. [DOI] [PubMed] [Google Scholar]
- Lee SS, Bohrson C, Pike AM, Wheelan SJ, Greider CW. ATM Kinase Is Required for Telomere Elongation in Mouse and Human Cells. Cell Rep. 2015;13:1623–1632. doi: 10.1016/j.celrep.2015.10.035. [DOI] [PMC free article] [PubMed] [Google Scholar]
- Liu Z, Legant WR, Chen BC, Li L, Grimm JB, Lavis LD, Betzig E, Tjian R. 3D imaging of Sox2 enhancer clusters in embryonic stem cells. Elife. 2014;3:e04236. doi: 10.7554/eLife.04236. [DOI] [PMC free article] [PubMed] [Google Scholar]
- Mattern KA, Swiggers SJJ, Nigg AL, Löwenberg B, Houtsmuller AB, Zijlmans JM. Dynamics of protein binding to telomeres in living cells: implications for telomere structure and function. Mol Cell Biol. 2004;24:5587–5594. doi: 10.1128/MCB.24.12.5587-5594.2004. [DOI] [PMC free article] [PubMed] [Google Scholar]
- Nandakumar J, Cech TR. Finding the end: recruitment of telomerase to telomeres. Nat Rev Mol Cell Biol. 2013;14:69–82. doi: 10.1038/nrm3505. [DOI] [PMC free article] [PubMed] [Google Scholar]
- Nandakumar J, Bell CF, Weidenfeld I, Zaug AJ, Leinwand LA, Cech TR. The TEL patch of telomere protein TPP1 mediates telomerase recruitment and processivity. Nature. 2012;492:285–289. doi: 10.1038/nature11648. [DOI] [PMC free article] [PubMed] [Google Scholar]
- Normanno D, Boudarene L, Dugast-Darzacq C, Chen J, Richter C, Proux F, Bénichou O, Voituriez R, Darzacq X, Dahan M. Probing the target search of DNA-binding proteins in mammalian cells using TetR as model searcher. Nature Communications. 2015;6:7357. doi: 10.1038/ncomms8357. [DOI] [PMC free article] [PubMed] [Google Scholar]
- Palm W, de Lange T. How shelterin protects mammalian telomeres. Annu Rev Genet. 2008;42:301–334. doi: 10.1146/annurev.genet.41.110306.130350. [DOI] [PubMed] [Google Scholar]
- Sauerwald A, Sandin S, Cristofari G, Scheres SHW, Lingner J, Rhodes D. Structure of active dimeric human telomerase. Nat Struct Mol Biol. 2013;20:454–460. doi: 10.1038/nsmb.2530. [DOI] [PMC free article] [PubMed] [Google Scholar]
- Schmidt JC, Cech TR. Human telomerase: biogenesis, trafficking, recruitment, and activation. Genes Dev. 2015;29:1095–1105. doi: 10.1101/gad.263863.115. [DOI] [PMC free article] [PubMed] [Google Scholar]
- Schmidt JC, Dalby AB, Cech TR. Identification of human TERT elements necessary for telomerase recruitment to telomeres. Elife. 2014;3:e03563. doi: 10.7554/eLife.03563. [DOI] [PMC free article] [PubMed] [Google Scholar]
- Sergé A, Bertaux N, Rigneault H, Marguet D. Dynamic multiple-target tracing to probe spatiotemporal cartography of cell membranes. Nat Meth. 2008;5:687–694. doi: 10.1038/nmeth.1233. [DOI] [PubMed] [Google Scholar]
- Stern JL, Theodorescu D, Vogelstein B, Papadopoulos N, Cech TR. Mutation of the TERT promoter, switch to active chromatin, and monoallelic TERT expression in multiple cancers. Genes Dev. 2015;29:2219–2224. doi: 10.1101/gad.269498.115. [DOI] [PMC free article] [PubMed] [Google Scholar]
- Stewart SA, Weinberg RA. Telomeres: cancer to human aging. Annu Rev Cell Dev Biol. 2006;22:531–557. doi: 10.1146/annurev.cellbio.22.010305.104518. [DOI] [PubMed] [Google Scholar]
- Takagi M, Absalon MJ, McLure KG, Kastan MB. Regulation of p53 translation and induction after DNA damage by ribosomal protein L26 and nucleolin. Cell. 2005;123:49–63. doi: 10.1016/j.cell.2005.07.034. [DOI] [PubMed] [Google Scholar]
- Takai KK, Hooper S, Blackwood S, Gandhi R, de Lange T. In vivo stoichiometry of shelterin components. Journal of Biological Chemistry. 2010;285:1457–1467. doi: 10.1074/jbc.M109.038026. [DOI] [PMC free article] [PubMed] [Google Scholar]
- Tarantino N, Tinevez JY, Crowell EF, Boisson B, Henriques R, Mhlanga M, Agou F, Israël A, Laplantine E. TNF and IL-1 exhibit distinct ubiquitin requirements for inducing NEMO-IKK supramolecular structures. J Cell Biol. 2014;204:231–245. doi: 10.1083/jcb.201307172. [DOI] [PMC free article] [PubMed] [Google Scholar]
- Teixeira MT, Arneric M, Sperisen P, Lingner J. Telomere length homeostasis is achieved via a switch between telomerase- extendible and nonextendible states. Cell. 2004;117:323–335. doi: 10.1016/s0092-8674(04)00334-4. [DOI] [PubMed] [Google Scholar]
- Tokunaga M, Imamoto N, Sakata-Sogawa K. Highly inclined thin illumination enables clear single-molecule imaging in cells. Nat Meth. 2008;5:159–161. doi: 10.1038/nmeth1171. [DOI] [PubMed] [Google Scholar]
- Tomlinson RL, Ziegler TD, Supakorndej T, Terns RM, Terns MP. Cell cycle-regulated trafficking of human telomerase to telomeres. Mol Biol Cell. 2006;17:955–965. doi: 10.1091/mbc.E05-09-0903. [DOI] [PMC free article] [PubMed] [Google Scholar]
- Tong AS, Stern JL, Sfeir A, Kartawinata M, de Lange T, Zhu XD, Bryan TM. ATM and ATR Signaling Regulate the Recruitment of Human Telomerase to Telomeres. Cell Rep. 2015;13:1633–1646. doi: 10.1016/j.celrep.2015.10.041. [DOI] [PMC free article] [PubMed] [Google Scholar]
- Traut TW. Physiological concentrations of purines and pyrimidines. Mol Cell Biochem. 1994;140:1–22. doi: 10.1007/BF00928361. [DOI] [PubMed] [Google Scholar]
- Venteicher AS, Abreu EB, Meng Z, McCann KE, Terns RM, Veenstra TD, Terns MP, Artandi SE. A human telomerase holoenzyme protein required for Cajal body localization and telomere synthesis. Science. 2009;323:644–648. doi: 10.1126/science.1165357. [DOI] [PMC free article] [PubMed] [Google Scholar]
- Wang X, Kam Z, Carlton PM, Xu L, Sedat JW, Blackburn EH. Rapid telomere motions in live human cells analyzed by highly time-resolved microscopy. Epigenetics Chromatin. 2008;1:4. doi: 10.1186/1756-8935-1-4. [DOI] [PMC free article] [PubMed] [Google Scholar]
- Weidenfeld I, Gossen M, Löw R, Kentner D, Berger S, Görlich D, Bartsch D, Bujard H, Schönig K. Inducible expression of coding and inhibitory RNAs from retargetable genomic loci. Nucleic Acids Res. 2009;37:e50. doi: 10.1093/nar/gkp108. [DOI] [PMC free article] [PubMed] [Google Scholar]
- Wong JMY, Kusdra L, Collins K. Subnuclear shuttling of human telomerase induced by transformation and DNA damage. Nat Cell Biol. 2002;4:731–736. doi: 10.1038/ncb846. [DOI] [PubMed] [Google Scholar]
- Wu RA, Dagdas YS, Yilmaz ST, Yildiz A, Collins K. Single-molecule imaging of telomerase reverse transcriptase in human telomerase holoenzyme and minimal RNP complexes. Elife. 2015;4:e08363. doi: 10.7554/eLife.08363. [DOI] [PMC free article] [PubMed] [Google Scholar]
- Xi L, Cech TR. Inventory of telomerase components in human cells reveals multiple subpopulations of hTR and hTERT. Nucleic Acids Res. 2014;42:8565–8577. doi: 10.1093/nar/gku560. [DOI] [PMC free article] [PubMed] [Google Scholar]
- Xi L, Schmidt JC, Zaug AJ, Ascarrunz DR, Cech TR. A novel two-step genome editing strategy with CRISPR-Cas9 provides new insights into telomerase action and TERT gene expression. Genome Biol. 2015;16:231. doi: 10.1186/s13059-015-0791-1. [DOI] [PMC free article] [PubMed] [Google Scholar]
- Zhang M, Chang H, Zhang Y, Yu J, Wu L, Ji W, Chen J, Liu B, Lu J, Liu Y, et al. Rational design of true monomeric and bright photoactivatable fluorescent proteins. Nat Meth. 2012;9:727–729. doi: 10.1038/nmeth.2021. [DOI] [PubMed] [Google Scholar]
- Zhao Y, Abreu E, Kim J, Stadler G, Eskiocak U, Terns MP, Terns RM, Shay JW, Wright WE. Processive and distributive extension of human telomeres by telomerase under homeostatic and nonequilibrium conditions. Mol Cell. 2011;42:297–307. doi: 10.1016/j.molcel.2011.03.020. [DOI] [PMC free article] [PubMed] [Google Scholar]
- Zhao Y, Sfeir AJ, Zou Y, Buseman CM, Chow TT, Shay JW, Wright WE. Telomere extension occurs at most chromosome ends and is uncoupled from fill-in in human cancer cells. Cell. 2009;138:463–475. doi: 10.1016/j.cell.2009.05.026. [DOI] [PMC free article] [PubMed] [Google Scholar]
- Zhong FL, Batista LFZ, Freund A, Pech MF, Venteicher AS, Artandi SE. TPP1 OB-Fold Domain Controls Telomere Maintenance by Recruiting Telomerase to Chromosome Ends. Cell. 2012;150:481–494. doi: 10.1016/j.cell.2012.07.012. [DOI] [PMC free article] [PubMed] [Google Scholar]
Associated Data
This section collects any data citations, data availability statements, or supplementary materials included in this article.
Supplementary Materials
Figure S1. Generation and analysis of genome-edited cell lines for live cell imaging of TERT (related to Fig. 1). (A) Genome editing strategy to replace the SNAP-tag with the HaloTag. Two sgRNAs were used to excise the SNAP-tag from the endogenous TERT locus. A homologous recombination (HR) donor plasmid was supplied including the HaloTag and a puromycin resistance cassette. After puromycin selection to enrich for cells that had undergone HR, eGFP-CRE was transiently expressed in the cells and single cell clones were generated from the eGFP-positive cell population. (B) Agarose gels of PCR products amplified from genomic DNA of genome-edited clones using the indicated primers. Expected product sizes are indicated. The two clones highlighted in red are referred to as clones 1 and 2 in the main figures. (C) Direct telomerase extension assay of endogenous telomerase purified with a TERT antibody and FLAG-HaloTag telomerase purified with a FLAG antibody in the absence and presence of the POT1/TPP1 complex. POT1/TPP1 enhances telomerase processivity to the same degree for endogenous and HaloTag telomerases. Processivity was calculated as ratio of the signals of all repeats > 6 to the total activity. (D) Western blot probed with an anti-TERT antibody of the protein samples used for the activity assay shown in S1C. (E) Direct telomerase extension assay of anti-FLAG purifications from the indicated cell lines. Telomerase activity is IP’d from genome-edited but not parental HeLa cell lines. LC1 and 2, loading controls.
Figure S2. Generation and analysis of genome-edited cell lines for live cell imaging of TRF2 (related to Fig. 1). (A) Diagram of the genome-edited TRF2 locus indicating the primers used to amplify the PCR product shown in the agarose gel below. (B) Agarose gel of PCR products amplified from the genomic DNA of the indicated cell lines using the primers shown in (A) (arrows). The genome-edited clone shows a PCR product with a size increase corresponding to the HA-mEOS3.2-tag introduced. (C) Cyto-localization of HA-mEOS3.2-TRF2 detected using an anti-HA antibody and telomeres marked with a Rap1 antibody. HA-mEOS3.2-TRF2 localizes to telomeres. (D) Imaging of telomeres, marked by TRF2, and sites of DNA-damage, marked by 53BP1, in parental and genome-edited cell lines to detect telomere dysfunction-induced foci. The average number of telomere dysfunction-induced foci per cell is indicated in white (N = 36 cells for all conditions).
Figure S3. Introduction and analysis of the FLAG-HaloTag and K78E mutation at the endogenous TERT locus (related to Fig. 5). (A) Genome editing strategy to replace the SNAP-tag with the HaloTag and introduce the K78E mutation in the TERT coding sequence. In addition to the procedure used for wild-type TERT, the right homology arm included a single base-pair change to introduce the K78E mutation in exon 2 of the TERT locus. (B) Agarose gels of PCR products amplified from genomic DNA of genome-edited clones using the indicated primers. Expected product sizes are indicated. The two clones highlighted in red are referred to as clones 1 and 2 in the main figures. (C) Sanger sequencing traces of a wild-type TERT and the two K78E clones generated from PCR products of the genomic DNA of the respective clones. Boxed in red is the sequence of the base triplet coding for lysine in the wild-type allele (AAG) and glutamic acid in the mutant allele (GAG). (D) Western blot and fluorescence imaging of TERT immuno-purified from genome-edited cells lines, using FLAG and TERT antibodies. The HaloTag and SNAP-tag were labeled with JF646. (E) Direct telomerase extension assay using immuno-purified TERT. LC1 and 2, labeled oligonucleotide loading controls. K78E FLAG-HaloTag telomerase has comparable activity and processivity to wild-type FLAG-HaloTag telomerase. (F-H) A second replicate of the data shown in Figure 5B–D (N = 8 cells for each TERT allele).
Table S1. Tracking Parameter for 2D single-particle tracking
Movie S1. Tracking of TERT in the nuclei of live HeLa cells (related to Fig. 2). 2D-tracking of FLAG-HaloTag-TERT (green, λex = 647 nm, λem = 670 nm) labeled with JF646 in the nucleus of a HeLa cell. The movie was acquired with an exposure time of 20 ms for an effective frame rate of 45 frames per second. HA-mEOS3.2-TRF2 signals (red, λex = 561 nm, λem = 590 nm) are a maximum intensity projection of the first 50 frames of the movie acquired simultaneously to TERT. TRF2 signals are static over the time course of the experiment (see Movie S2) allowing the use of a static image, avoiding the effects of photo-bleaching. BFP-coilin signals (blue, λex = 405 nm, λem = 450 nm) are maximum intensity projections of the first 50 frames of a movie acquired immediately before simultaneous tracking TERT and TRF2. Coilin signals are static over the time course of the experiment (see Movie S2) allowing the use of a static image, avoiding the effects of photo-bleaching (Scale bar = 5 μm, Timestamp in ms).
2D-tracking of HA-mEOS3.2-TRF2 in the nucleus of a living HeLa cell (λex = 561 nm, λem = 590 nm). The movie was acquired with an exposure time of 20 ms for an effective frame rate of 45 frames per second (Scale bar = 5 μm, Timestamp in ms).
2D-tracking of BFP-coilin (λex = 405 nm, λem = 450 nm) in the nucleus of a living HeLa cell. The movie was acquired with an exposure time of 50 ms for an effective frame rate of 13.9 frames per second (Scale bar = 5 μm, Timestamp in ms).
2D-tracking of FLAG-HaloTag-TERT (green, λex = 647 nm, λem = 670 nm) labeled with JF646 in the nucleus of a HeLa cell. The movie was acquired with an exposure time of 20 ms for an effective frame rate of 45 frames per second. HA-mEOS3.2-TRF2 signals (red, λex = 561 nm, λem = 590 nm) are a maximum intensity projection of the first 50 frames of the movie acquired simultaneously to TERT. TRF2 signals are static over the time course of the experiment (see Movie S2) allowing the use of a static image, avoiding the effects of photo-bleaching. GFP-nucleolin signals (blue, λex = 488 nm, λem = 525 nm) are maximum intensity projections of the first 50 frames of a movie acquired immediately after simultaneous tracking of TERT and TRF2. Nucleoli are static over the time course of the experiment, allowing the use of a static image, avoiding the effects of photo-bleaching (Scale bar = 5 μm, Timestamp in ms).
Simultaneous tracking of HA-mEOS3.2-TRF2 (top panel, red, λex = 561 nm, λem = 590 nm) and FLAG-HaloTag-TERT (middle panel, green, λex = 647 nm, λem = 670 nm). The movie was acquired with an exposure time of 20 ms for an effective frame rate of 45 frames per second. Bottom panel is a merge of TRF2 (red) and TERT (green) signals. Each panel is 30×30 pixels in size (4.8 μm × 4.8 μm).
Simultaneous tracking of HA-mEOS3.2-TRF2 (top panel, red, λex = 561 nm, λem = 590 nm) and FLAG-HaloTag-TERT (middle panel, green, λex = 647 nm, λem = 670 nm). The movie was acquired with an exposure time of 20 ms for an effective frame rate of 45 frames per second. Bottom panel is a merge of TRF2 (red) and TERT (green) signals. Each panel is 30×30 pixels in size (4.8 μm × 4.8 μm).
Three more examples of long-lasting static TERT-TRF2 interactions. Simultaneous tracking of HA-mEOS3.2-TRF2 (top panel, red, λex = 561 nm, λem = 590 nm) and FLAG-HaloTag-TERT (middle panel, green, λex = 647 nm, λem = 670 nm). The movie was acquired with an exposure time of 20 ms at a time interval of 1 frame per second (total movie length 8 minutes, sped up to 20 frames per second). Bottom panel is a merge of TRF2 (red) and TERT (green) signals. Each panel is 30×30 pixels in size (4.8 μm × 4.8 μm).
2D-tracking of K78E FLAG-HaloTag-TERT (green, λex = 647 nm, λem = 670 nm) labeled with JF646 in the nucleus of a HeLa cell. The movie was acquired with an exposure time of 20 ms for an effective frame rate of 45 frames per second. HA-mEOS3.2-TRF2 signals (red, λex = 561 nm, λem = 590 nm) are a maximum intensity projection of the first 50 frames of the movie acquired simultaneously to TERT. TRF2 signals are static over the time course of the experiment (see Movie S2) allowing the use of a static image, avoiding the effects of photo-bleaching. BFP-coilin signals (blue, λex = 405 nm, λem = 450 nm) are maximum intensity projections of the first 50 frames of a movie acquired immediately before simultaneous tracking of TERT and TRF2. Coilin signals are static over the time course of the experiment (see Movie S2) allowing the use of a static image, avoiding the effects of photo-bleaching (Scale bar = 5 μm, Timestamp in ms).