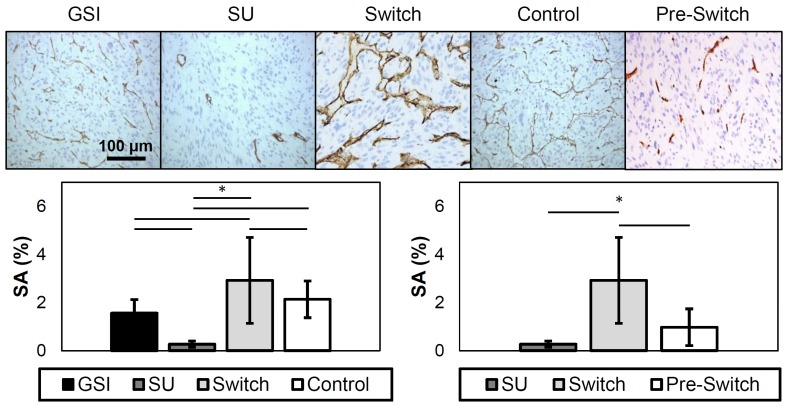
Figure 9.
Representative images of CD31 immunohistochemistry (top). The dark brown stains represent expression of CD31 in endothelial cells. SA results from CD31 staining (bottom). The plot on the left displays the SA of the different treatment groups, while the plot on the right only shows the SU, Switch, and the Pre-Switch cohorts. The SU group has significantly lower values from the other groups, while the Switch group showed significantly higher levels of patent vasculature. The Pre-Switch cohort is significant from the Switch group.

