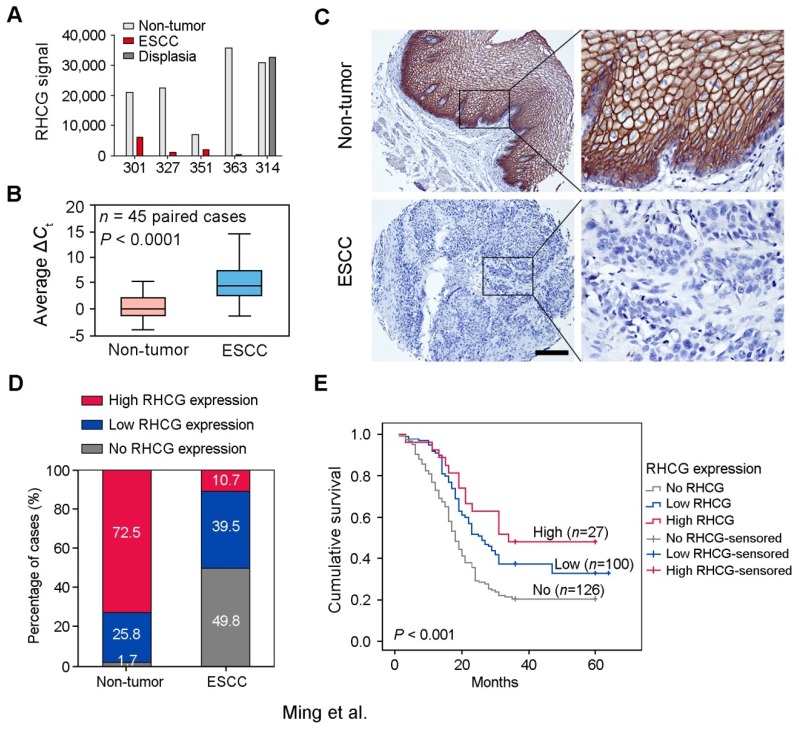
Figure 1.
Downregulation of RHCG in clinical ESCCs. (A) RHCG signal was detected by cDNA microarray in four paired ESCC/nontumor samples (#301, #327, #351 and #363), and one pair of esophageal dysplasia tissue and adjacent normal tissue (#314). (B) RHCG expression in matched nontumor and ESCC tumor samples (n = 45) as detected by qRT-PCR. GAPDH was used as an internal control. The data displayed as average ΔCt values. Boxes in the box plot contain the values between the 25th and 75th percentiles. The lines across the boxes indicate the median. (C) Representative IHC staining of RHCG in ESCC tumor and paired nontumor squamous epithelial tissue (Scale bar = 200 µm). (D) Bar chart summary of the distribution of different RHCG expression levels in nontumor versus tumor for all informative cases on the TMA. (E) Kaplan-Meier survival analysis comparing the overall survival time of ESCC patients with different RHCG expression levels. Statistics: B, paired t test; E, Kaplan-Meier analysis and log-rank test.

