Abstract
Harmonic imaging techniques have been applied in ultrasonic elasticity imaging to obtain higher quality tissue motion tracking data. However, harmonic tracking can be signal-to-noise ratio (SNR) and penetration depth (PD) limited during clinical imaging, resulting in decreased yield of successful shear wave speed (SWS) measurements. A logical approach is to increase the source pressure, but the in situ pressures used in diagnostic ultrasound have been subject to a de facto upper limit based upon the Food and Drug Administration (FDA) guideline for the Mechanical Index (MI < 1.9). A recent AIUM report concluded that an in situ MI up to 4.0 could be warranted without concern for increased risk of cavitation in non-fetal tissues without gas bodies if there were a concurrent clinical benefit. This work evaluates the impact of using elevated Mechanical Index (MI) in harmonic motion tracking for hepatic shear wave elasticity imaging (SWEI). The studies demonstrate that high MI harmonic tracking increased SWS estimation yield by 27% at a focal depth of 5 cm, with larger yield increase in more difficult-to-image patients. High MI tracking improved harmonic tracking data quality by increasing the signal-to-noise ratio (SNR) and decreasing jitter in the tissue motion data. We conclude that there is clinical benefit of using elevated acoustic output in shear wave tracking particularly in difficult-to-image patients.
Keywords: Elevated acoustic output, Shear wave elasticity imaging, Mechanical Index, Liver, Harmonic imaging
Introduction
Ultrasonic elasticity imaging methods have been developed over the last two decades to estimate tissue stiffness, which is often associated with underlying pathological conditions (Shiina et al., 2015). An increase in tissue stiffness can be caused by the presence of fibrotic tissue as occurs in liver cirrhosis, or by an increase of tissue cellular density as typically occurs with cancer. A number of ultrasonic elasticity imaging techniques have been proposed including acoustic radiation force impulse (ARFI) imaging (Nightingale et al., 2002) and shear wave elasticity imaging (SWEI) (Sarvazyan et al., 1998). These methods use long-duration focused ultrasound beams to induce tissue motion and standard ultrasound imaging techniques to track the resulting tissue motion. ARFI imaging measures on-axis tissue displacement to determine relative differences in tissue stiffness. SWEI monitors tissue motion at locations offset from the ARFI excitation to determine the propagation speed of the induced shear wave, which is related to the shear modulus of the material.
Tissue harmonic imaging (THI) has been widely used in diagnostic ultrasound since the late 1990s because it improves image quality compared to fundamental B-mode imaging mode. THI relies on nonlinear acoustic wave propagation, which generates harmonic signals as the transmitted sound wave travels through biological tissues. An ultrasound harmonic image is created from the harmonic signal instead of the transmitted fundamental signal. THI is reported to create higher quality images compared to fundamental imaging in regard to lesion visibility and diagnostic confidence (Thomas and Rubin, 1998), due to decreased sidelobe energy (Christopher, 1997, 1998) and decreased reverberation clutter (Pinton et al., 2011; Bradley, 2006). However, second harmonic pressure amplitude is generally 10–20 dB lower than the corresponding fundamental pressure (Desser and Jeffrey, 2001). Therefore, THI can be both signal-to-noise ratio (SNR) and penetration depth (PD) limited during clinical imaging, resulting in decreased diagnostic utility (Schuh et al., 2011; Klysik et al., 2014; de Moura Almeida et al., 2008).
THI techniques have been applied in tissue motion tracking in ultrasonic elasticity imaging methods to obtain higher quality tracking data utilizing the benefits of in vivo harmonic imaging (Hurlburt et al., 2007; Doherty et al., 2013; Amador et al., 2016). The ability to detect a shear wave signal is largely dependent on ultrasound image quality, which is susceptible to artifacts such as phase aberration and reverberation clutter. Harmonic tracking reduces the reverberation clutter in tissue displacement estimates, therefore improving the tracking data quality (Doherty et al., 2013). Harmonic tracking has been shown to improve SWEI measurements in myocardial tissue (Song et al., 2013) and in human livers (Amador et al., 2016). On the other hand, harmonic tracking has the challenge of low SNR and low penetration depth similar to B-mode THI. The low SNR in harmonic tracking can lead to higher jitter, i.e., the magnitude of the uncertainties in ultrasonic displacement estimation. Based upon the Cramér-Rao lower bound (CRLB), a theoretical lower limit of the jitter in ultrasonic correlation based time delay estimation can be expressed as (Walker and Trahey, 1995):
| (1) |
where fc is the center frequency, T is the correlation window length, BW is the fractional bandwidth, CC is the correlation coefficient between the signals, and SNR is the electronic signal-to-noise ratio. Due to the limited harmonic signal amplitude, CC and SNR can be lower for harmonic tracking, which can result in higher jitter. Herein, we test the hypothesis that using an elevated Mechanical Index (MI) in harmonic tracking will increase the SNR of the harmonic signal, therefore reducing jitter magnitude and increasing the measurement success of ARFI and SWEI imaging.
The acoustic output of diagnostic ultrasonic imaging systems in the United States has been subject to a de facto upper limit based upon the Food and Drug Administration (FDA) for the Mechanical Index (MI < 1.9) (Center for Devices and Radiological Health (CDRH), 1994). The MI is defined as:
| (2) |
where pr.3(zMI) is the attenuated (derated using an attenuation coefficient (α) of 0.3 dB/cm/MHz) peak-rarefactional pressure, zMI is depth from the transducer to the plane of the maximum attenuated pulse-intensity integral (which generally occurs near the focal depth (Center for Devices and Radiological Health (CDRH), 1994)), and fc is the center frequency of the transmitted wave (International Electrotechnical Commision (IEC), 2010). The MI guideline is intended to minimize the potential risk of inertial cavitation induced by diagnostic ultrasound exams. The MI is commonly further limited by commercial ultrasound vendors when a 20 – 30% safety buffer is applied to reduce the number of production transducers requiring quality assurance testing (Ziskin, 2003; American Institute of Ultrasound in Medicine/National Electrical Manufacturers Association (AIUM/NEMA), 1998), which results in most current commercial scanners using a maximum MI between 1.3 and 1.6. However, the FDA MI guideline for diagnostic ultrasound systems was based on substantial equivalence with commercial products on the market prior to 1976, rather than being linked to scientific evidence of bioeffects. A recent report from the American Institute of Ultrasound in Medicine (AIUM) concluded that exceeding the recommended maximum MI given in the FDA guidance up to an estimated in situ value of 4.0 could be warranted without concern for increased risk of cavitation in non-fetal tissues without gas bodies (Nightingale et al., 2015).
Our group has previously investigated the benefit of using elevated acoustic output in the ARFI excitation in shear wave imaging Deng et al. (2015). A clinical study was performed to evaluate hepatic SWEI measurement success as a function of push pulse energy using 2 MI values (1.6 and 2.2) over a range of pulse durations. The results indicated that the rate of successful SWS estimation is linearly proportional to the magnitude of the push energy. A higher push energy results in higher tissue displacement, which in turn leads to higher SNR of the tracking data. On the other hand, in our experience, the success of ultrasonic shear wave imaging largely depends on the ability to accurately track tissue motion. The impact of using elevated MIs in tissue motion tracking was not separately evaluated due to hardware limitations in the previous study.
The work described in this paper examines the use of elevated acoustic output in harmonic motion estimation in SWEI. This study evaluates SWS estimation yield and jitter amplitude for SWEI sequences using identical push beams, and either a typical MI value of 1.4 or an elevated MI value of 2.4 for motion tracking.
Methods
Data acquisition sequence and calibration
Group SWS was measured with a modified Siemens Acuson S2000 ultrasound scanner (Siemens Healthcare, Ultrasound Business Unit, Mountain View, CA, USA) and a 4C1 curvilinear array. The push and track pulses for each SWEI sequence had concurrent focal depths at 5 cm. An STL-SWEI (single track location) configuration was used for all sequences, with a single track beam located along the center axis of the transducer (0 mm), and eight evenly spaced push beams covering a lateral range of 1.0 – 10.2 mm (McAleavey et al., 2009; Hollender et al., 2015). Table 1 lists the track beam configurations.
Table 1.
Track beam configurations
| Transducer | Focal depth | Tx frequency | PRF | MI values |
|---|---|---|---|---|
| 4C1 | 5 cm | 1.8 MHz | 5.0 kHz | 1.4 and 2.4 |
Each measurement consisted of two sequentially acquired SWEI sequences with identical push configurations and two track configurations. One sequence had a track MI of 1.4 (typically used in commercial ultrasound scanner), and the other had an elevated track MI of 2.4. Fully sampled pulse inversion harmonic tracking followed by a bandpass filter around the harmonic frequency was used for all sequences (Doherty et al., 2013). The push configurations of the 4C1 transducer were the same as in a clinical study previously conducted by our group (Palmeri et al., 2011), which used 400-cycle push pulses at 2.2 MHz with an elevated push MI of 2.5.
Acoustic output measurements were conducted according to (American Institute of Ultrasound in Medicine/National Electrical Manufacturers Association (AIUM/NEMA), 1998) using a calibrated PVDF membrane hydrophone with a 0.6-mm spot size (Sonic Technologies, Wyndmoor, PA, USA). The pressure was estimated from the recorded voltage waveform using deconvolution based on the frequency dependent magnitude of the sensitivity of the hydrophone (Wear et al., 2014). After voltage-to-pressure conversion, the MI was computed using Equation (2).
SWS calculation and SWS yield
Beamformed radio-frequency (RF) data were obtained from each acquisition and the data from low and high MI tracking were processed identically to generate SWS estimates. Tissue displacement was estimated using normalized cross-correlation (Pinton et al., 2006). Temporal filtering is often used to reduce motion artifact and displacement jitter (Deng et al., 2017). A bandpass filter (BPF) with cut-off frequencies at 50 Hz and 1000 Hz was applied to the tissue displacement data before SWS estimation. Another BPF with cut-off frequencies at 50 Hz and 500 Hz was also applied for the purpose of jitter comparison. SWS was reconstructed using 2 algorithms: the random sample consensus (RANSAC) (Wang et al., 2010) algorithm applied to arrival times of the peak tissue displacements and the radon sum (Rouze et al., 2010) algorithm applied to displacement data averaged over the depth of field of the push beam (20 mm). A SWS measurement was considered unsuccessful and was rejected if there were less than 50% inliers in the RANSAC algorithm, consistent with previously published in vivo liver data (Wang et al., 2010). In addition, it has been reported that the RANSAC and radon sum algorithms reconstruct SWS estimates with good agreement, with a correlation coefficient of 0.91 (Rouze et al., 2010). Therefore, measurements were also rejected when the SWS estimates from the two algorithms differed by more than 15% (Deng et al., 2015).
Data quality metrics: SWS yield, correlation coefficient (CC), displacement jitter, and maximum displacement
In the context of liver fibrosis staging, current clinical SWEI protocols require 10 successful measurements for each patient, and record the median value of the 10 measurements (Sporea et al., 2014). Commercial SWEI systems have indications of measurement confidence (Ferraioli et al., 2015). Failure and unreliable results are typically associated with obesity and limited operator experience. To quantify the impact of different tracking MIs, we used the SWS yield as a metric to evaluate data quality.
The correlation coefficient (CC), displacement jitter and maximum displacement were used as metrics of the tracking data quality in this study. Each metric was compared between low and high MI tracking sequences using Wilcoxon rank sum tests without assuming normal distribution of these measurements. The CC is related to the signal-to-noise ratio (SNR) of the tracking data using Equation (3), as adapted from Equation (20) in (Friemel et al., 1998). The jitter represents the random errors in ultrasonic displacement estimation. A higher CC and lower jitter indicate higher tracking data quality. The correlation coefficient and displacement jitter were estimated from spatial locations away from the ARFI excitation and from temporal windows before the shear wave arrived where no motion is expected. The SNR of the tracking data was computed from the average CC for each MI configuration at both focal depths using Equation (3).
| ( Friemel et al., 1998) | (3) |
The jitter was calculated as the standard deviation of the displacement data when no shear wave was present. The frequency content of shear waves generated in human livers using a curvilinear array is typically centered near 200 Hz, and the bandwidth is 100 – 400 Hz (Palmeri et al., 2014). Because filtering is often used to reduce jitter, the jitter was computed for 3 different signal processing scenarios: no motion filter, BPF 50 – 1000 Hz (typically used in SWEI), and an aggressive motion filter of BPF 50 – 500 Hz.
Maximum displacement can be used to gauge the level of reverberation clutter present in the tracking data because a high level of stationary clutter leads to under-estimation of the tracked displacement (Pinton et al., 2006). It was calculated at each MI from the average displacement within the depth of the field at the closest recorded beam, which was 1.0 mm away from ARFI excitation measured at the focal depth.
Clinical study design and population
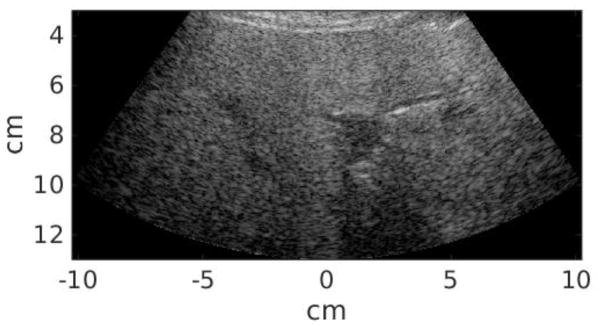
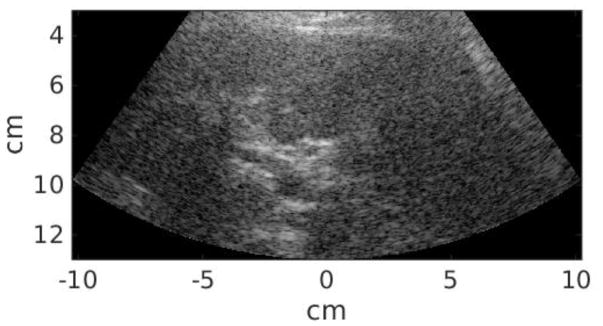
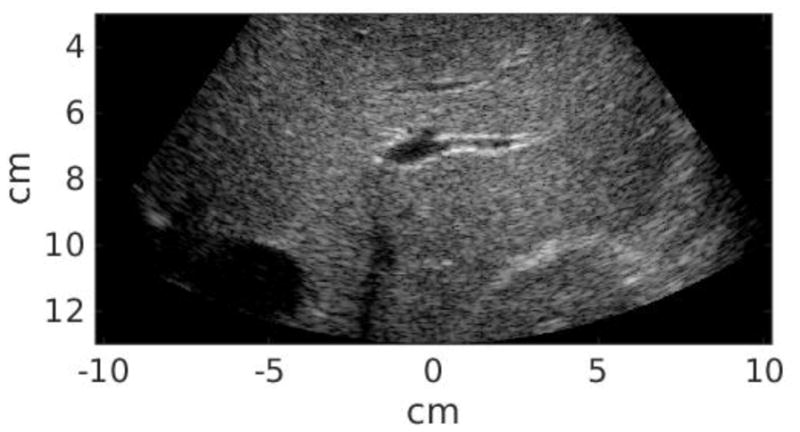
Twenty-five study subjects in total were recruited in this study, including 12 patients scheduled for abdominal ultrasound exams at Duke University Medical center and 13 healthy volunteers. This clinical study was approved by the institutional review board at Duke University, and each study subject provided written informed consent prior to enrollment. The Body Mass Index (BMI) of each subject was recorded. All data acquisitions were performed at the subcostal location. Commercial B-mode imaging was used to scan each subject’s liver and identify a homogeneous liver region devoid of vessels or other structures. The study subject was then asked to stop breathing during data acquisition, which lasted approximately 6 seconds and consisted of a pair of STL-SWEI measurements using low and high MI tracking. The study subject was instructed to resume breathing after each measurement. Within the 6-second breath hold, the majority of the time was taken by setting up imaging parameters and saving data. The data acquisition itself was completed in less than 1 second, and the time between low and high MI acquisitions was less than 2 seconds. Six repeated measurements were performed for each subject. Table 2 summarizes the subject demographics. Liver capsule depth was measured from the B-mode images for each study subject. The B-mode image quality of each subject was subjectively evaluated by the sonographer, and separated into scores 1–3 (1 - easy, 2 - medium, 3 - difficult). Figure 1 shows example B-mode images from easy, medium and difficult-to-image subjects. The liver boundary and hypoechoic vessels are clearly shown in the easy subject in Figure 1(a), and are less well delineated in the medium subject in Figure 1(b). On the other hand, It is difficult to observe any anatomical feature from Figure 1(c) from the difficult subject. The B-mode image quality was significantly correlated with liver capsule depth (R = 0.73, P < 0.01).
Table 2.
Subject demographics, 25 subjects in total
| Gender | Total # |
|---|---|
| Male | 13 |
| Female | 12 |
| BMI (kg/m2) | Total # |
| ≤ 24.9 | 8 |
| 25.0–29.9 | 8 |
| 30.0–39.9 | 6 |
| ≥ 40.0 | 3 |
| Liver capsule depth | Total # |
| 10 –24 mm | 9 |
| 25 – 39 mm | 14 |
| ≥ 40 mm | 2 |
| Image quality | Total # |
| 1 (easy) | 9 |
| 2 (medium) | 9 |
| 3 (difficult) | 7 |
Figure 1.
Example B-mode images from easy (a), medium (b), and difficult-to-image (3) subjects.
Results
Figure 2 shows the total percentage yield of successful SWS measurements for low and high MI tracking across all subjects. The number of successful SWS estimations was summed over six repeated measurements from each study subject to determine the total yield for each sequence. The percent yield was then calculated by dividing the total yield by the total number of measurements (6 repeated measurements × 25 study subjects = 150). Going from low to high MI tracking, the percent yield increased from 43.3% to 70.7%.
Figure 2.
Percent yield of successful SWS measurements across all study subjects for low and high MI tracking. Going from low to high MI tracking, the percent yield increased from 43.3% to 70.7%.
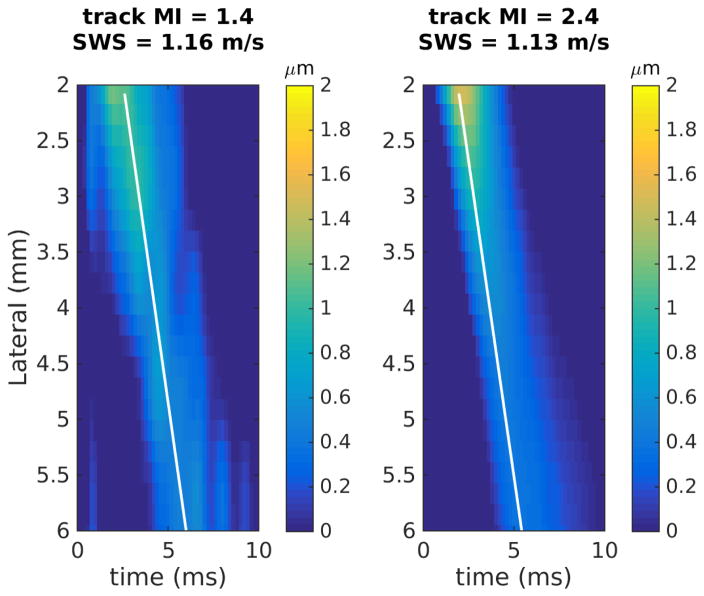
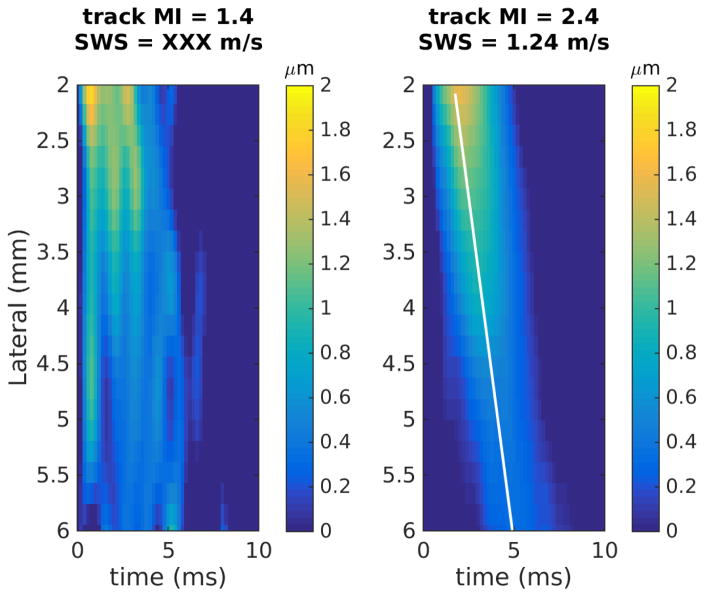
Figure 3 shows two example pairs of the shear wave trajectories using low and high MI tracking from (a) an easy-to-image volunteer and (b) a difficult-to-image patient. In the easy volunteer, both low and high MI tracking yielded successful estimates and resulted in similar SWS values (Figure 3a, 1.16 and 1.13 m/s). Low MI tracking failed to produce a successful SWS estimate in the difficult patient (Figure 3b). The high MI tracking in both cases visually has a more well defined trajectory of the propagating shear wave, suggesting that high MI tracking reduces the jitter noise in the shear wave signal.
Figure 3.
Example shear wave trajectories using low and high MI tracking focused at 5 cm. (a) An easy-to-image volunteer (BMI = 20.9 kg/m2), where both low and high MI tracking yield successful SWS estimates and similar SWS values. (b) A difficult-to-image patient (BMI = 31.8 kg/m2), where low MI tracking failed to produce a successful SWS estimate.
The SWS values for all 25 subjects ranged between 0.93 and 2.34 m/s, with a median value of 1.34 m/s. The SWS ratio between high and low MI tracking across all 25 subjects was 1.06 ± 0.21, indicating that the speeds were not significantly different between low and high MI tracking (p = 0.39).
Figure 4 shows the correlation coefficients (CC) from locations away from the ARFI excitation where we expect zero displacement, averaged across all acquisitions from all 25 subjects. The error-bars reflect the inter-subject variability. High MI tracking results in significantly higher CC with a p-value < 0.01. The CC as well as the corresponding SNR of the tracking data are listed in Table 3. High MI tracking increased the mean SNR of the tracking data by 6.5 dB.
Figure 4.
Correlation coefficients (CC) estimated from locations away from the shear wave where zero motion is expected. CC was averaged across all acquisitions from all 25 subjects at low and high MI tracking. The ‘x’ and error-bars reflect the median and interquartile range (IQR) from inter-subject variability, which was smaller at the higher MI. High MI tracking results in significantly higher CC with a p-value < 0.01.
Table 3.
Correlation coefficients (CC) and Signal-to-noise ratio (SNR) of the tracking data at both MI values
| Focal depth | 5 cm | |
| Track MI | 1.4 | 2.4 |
| CC | 0.980 ± 0.020 | 0.996 ± 0.006 |
| SNR (dB) | 16.911 ± 0.002 | 23.444 ± 0.000 |
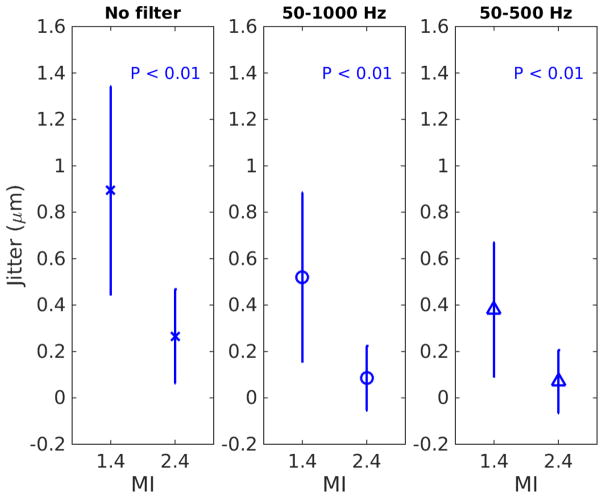
Figure 5 shows displacement jitter computed from all acquisitions. Jitter was computed from raw displacement data through time, as well as filtered data with different cut-off frequencies. The error-bars reflect the inter-subject variability. In all cases, using the same push configurations, high MI tracking results in significantly lower jitter (p < 0.01). In addition, the SWS values obtained with the 2 filters (50 – 1000 Hz and 50 – 500 Hz) were not significantly different in the same data from each subject (p ≥ 0.7).
Figure 5.
Displacement jitter computed from low and high MI tracking. The ‘x’ and error-bars reflect the median and IQR from inter-subject variability. The title of each sub-figure in the top row indicates the data/filtering type. In all cases, high MI tracking results in significantly lower jitter with p-values < 0.01.
Maximum displacement at around 1 mm from the push measured at the focal depth was estimated for each measurement. The maximum displacement ratio between high and low MI tracking across all 25 subjects was 1.02 ± 0.14. The maximum displacement is not significantly different between low and high MI tracking (p = 0.68).
Figure 6 plots the percent SWS yield data with respect to B-mode image quality. From these data we observe that high MI tracking increases SWS yield for all image qualities. SWS yield is lower in difficult-to-image subjects, and the yield improvement going from low to high MI tracking is higher in difficult-to-image subjects. Using elevated MI tracking, SWS yield improved by 1.5x, 1.7x, and 1.9x in easy, medium and difficult subjects respectively.
Figure 6.
Percent SWS yield at various image qualities. The image quality is represented by scores 1–3 (1 - easy, 2 - medium, 3 - difficult).
Discussion
This paper evaluates the benefit of using elevated acoustic output for harmonic motion tracking in SWEI. SWS estimation yield increased significantly going from low to high MI tracking as shown in Figures 2 and 6.
In the context of liver fibrosis staging, current clinical protocols require 10 successful SWEI measurements for each patient. Our data suggest that in the clinical setting, using elevated acoustic output in shear wave tracking would increase the yield of successful SWS measurements. This would potentially decrease the number of repeated acquisitions necessary to obtain the 10 successful measurements to meet the clinical standard. In addition, in two of 25 subjects in this study, we had zero yield using low MI tracking, but were able to obtain successful SWS estimates using high MI tracking. Therefore, we conclude that there would be clinical benefit to using elevated acoustic output for shear wave tracking in these patients.
High MI tracking significantly improves the tracking data quality by increasing SNR and the correlation coefficient (CC) in motion estimation as shown in Figure 4 and Table 3. The SNR of harmonic tracking data increased on the order of 6 dB going from low to high MI tracking. The increase in SNR and CC results in the reduction of displacement jitter as described by the CRLB. Figure 5 shows that high MI tracking decreases jitter in raw (left) and filtered (center and right) tissue motion data. The BPF with cut-off frequencies 50 – 1000 Hz in the center column of Figure 5 is typically applied to tissue motion data in hepatic SWEI to reduce background motion artifact and jitter noise (Deng et al., 2017), and was included in the data processing pipeline to estimate SWS in this study. As expected, the jitter amplitude is lower in the filtered data than in the raw data at both focal depths and at both tracking MI values. On the other hand, high MI tracking has lower displacement jitter after the BPF, indicating that high MI tracking still provides the benefit of lower jitter and higher tracking data quality after the post-acquisition data filtering. The right column of Figure 5 shows the jitter amplitude after the displacement data was filtered with cut-off frequencies 50 – 500 Hz. The jitter amplitude of high MI tracking is still significantly lower than that of low MI tracking after this aggressive filter. These results indicate that the benefit of lower jitter provided by high MI tracking is present in raw data as well as in filtered data after post-acquisition data processing.
As shown in Figure 6, SWS yield is directly related to image quality, with lower SWS yield observed from more difficult-to-image subjects. High MI tracking leads to higher SWS yield for all image qualities. In addition, the relative SWS yield improvement going from low to high MI tracking is higher for more difficult-to-image subjects. This indicates that difficult-to-image patients are less likely to produce successful SWS measurements under the current FDA MI guideline, and are more likely to benefit from using elevated acoustic output in shear wave tracking to obtain reliable SWS measurements. These findings suggest that B-mode image quality could be used prospectively to identify patients who would be likely to have low SWS estimation yield, and would potentially benefit from using elevated acoustic output in shear wave tracking.
A limitation of this study was the use of a single track focal configuration, which employs focused harmonic tracking. This method affords the highest quality data at the expense of frame rate. Alternative tracking methods include plane wave imaging, which has been used extensively in SWEI (multiple track location) (Bercoff et al., 2004; Hollender et al., 2015). Future work will be directed to evaluate the impact of using elevated acoustic output between different track focal configurations, particularly between focused harmonic tracking and plane wave harmonic tracking as well as plane wave coherent compounding (Montaldo et al., 2009). In addition, we also used elevated acoustic output in the push pulse in this study to examine the tracking data quality under sufficient displacement amplitude. Future work will be directed to optimize the distribution of acoustic energy between push and track pulses, in order to consistently measure SWS while minimizing the total energy delivered to each patient.
Conclusions
This study investigated the clinical benefit of using elevated acoustic output in shear wave harmonic tracking. SWS measurements were acquired from 25 subjects at a focal depth of 5 cm. High MI tracking resulted in higher data quality with lower jitter in tissue motion data. The yield of successful SWS reconstruction increased when going from low to high MI tracking in all subjects, with larger SWS yield improvements in difficult-to-image subjects. This suggests that B-mode image quality could be used as an indicator to predict patients who would have low SWS estimation yield and would benefit significantly from using elevated MI to obtain reliable SWS measurements. We thus conclude that there is clinical benefit of using elevated MI in harmonic shear wave tracking.
Acknowledgments
The authors would like to thank Laura Street and Dr. Rendon Nelson for their help on patient recruitment and data collection during the study, as well as Siemens Healthcare USA, Ultrasound Division for their in-kind technical support. This work was supported by NIH Grant R01EB022106.
Footnotes
Publisher's Disclaimer: This is a PDF file of an unedited manuscript that has been accepted for publication. As a service to our customers we are providing this early version of the manuscript. The manuscript will undergo copyediting, typesetting, and review of the resulting proof before it is published in its final citable form. Please note that during the production process errors may be discovered which could affect the content, and all legal disclaimers that apply to the journal pertain.
References
- Amador C, Song P, Meixner DD, Chen S, Urban MW. Improvement of Shear Wave Motion Detection Using Harmonic Imaging in Healthy Human Liver. Ultrasound in Medicine & Biology. 2016;42:1–11. doi: 10.1016/j.ultrasmedbio.2015.12.012. [DOI] [PMC free article] [PubMed] [Google Scholar]
- American Institute of Ultrasound in Medicine/National Electrical Manufacturers Association (AIUM/NEMA) Acoustic output measurement standard for diagnostic ultrasound equipment. 1998. [Google Scholar]
- Bercoff J, Tanter M, Fink M. Supersonic shear imaging: A new technique for soft tissue elasticity mapping. IEEE Transactions on Ultrasonics, Ferroelectrics, and Frequency Control. 2004;51:396–409. doi: 10.1109/tuffc.2004.1295425. [DOI] [PubMed] [Google Scholar]
- Bradley C. Mechanisms of image quality improvement in tissue harmonic imaging. AIP Conference Proceedings; 2006. pp. 247–254. [Google Scholar]
- Center for Devices and Radiological Health (CDRH) 510(k) Guide for Measuring and Reporting Acoustic Output of Diagnostic Ultrasound Medical Devices. US Dept of Health and Human Services; 1985. Rev. 1993, 1994. [Google Scholar]
- Christopher T. Finite amplitude distortion-based inhomogeneous pulse echo ultrasonic imaging. IEEE Transactions on Ultrasonics, Ferroelectrics, and Frequency Control. 1997;44:125–139. doi: 10.1109/58.585208. [DOI] [PubMed] [Google Scholar]
- Christopher T. Experimental investigation of finite amplitude distortion-based, second harmonic pulse echo ultrasonic imaging. IEEE Transactions on Ultrasonics, Ferroelectrics, and Frequency Control. 1998;45:158–162. doi: 10.1109/58.646920. [DOI] [PubMed] [Google Scholar]
- de Moura Almeida A, Cotrim HP, Barbosa DBV, de Athayde LGM, Santos AS, Bitencourt AGaV, de Freitas LAR, Rios A, Alves E. Faculdade de Medicina da Bahia, Universidade Federal da Bahia, Avenida Tancredo Neves, editor. Tech Rep 9. Salvador Trade Center; Torre Norte-Sala 717, Salvador, Bahia 41830-020, Brazil: 2008. Fatty liver disease in severe obese patients: diagnostic value of abdominal ultrasound. [Google Scholar]
- Deng Y, Palmeri ML, Rouze NC, Rosenzweig SJ, Abdelmalek MF, Nightingale KR. Analyzing the Impact of Increasing Mechanical Index and Energy Deposition on Shear Wave Speed Reconstruction in Human Liver. Ultrasound in Medicine & Biology. 2015;41:1948–1957. doi: 10.1016/j.ultrasmedbio.2015.02.019. [DOI] [PMC free article] [PubMed] [Google Scholar]
- Deng Y, Rouze NC, Palmeri ML, Nightingale KR. Ultrasonic Shear Wave Elasticity Imaging (SWEI) Sequencing and Data Processing Using a Verasonics Research Scanner. IEEE Transactions on Ultrasonics, Ferroelectrics, and Frequency Control. 2017;64:164–176. doi: 10.1109/TUFFC.2016.2614944. [DOI] [PMC free article] [PubMed] [Google Scholar]
- Desser TS, Jeffrey RB. Tissue harmonic imaging techniques: physical principles and clinical applications. Seminars in ultrasound, CT, and MR. 2001;22:1–10. doi: 10.1016/s0887-2171(01)90014-9. [DOI] [PubMed] [Google Scholar]
- Doherty JR, Dahl JJ, Trahey GE. Harmonic tracking of acoustic radiation force-induced displacements. IEEE Transactions on Ultrasonics, Ferroelectrics, and Frequency Control. 2013;60:2347–2358. doi: 10.1109/TUFFC.2013.6644738. [DOI] [PMC free article] [PubMed] [Google Scholar]
- Ferraioli G, Filice C, Castera L, Choi BI, Sporea I, Wilson SR, Cosgrove D, Dietrich CF, Amy D, Bamber JC, Barr R, Chou YH, Ding H, Farrokh A, Friedrich-Rust M, Hall TJ, Nakashima K, Nightingale KR, Palmeri ML, Schafer F, Shiina T, Suzuki S, Kudo M. WFUMB Guidelines and Recommendations for Clinical Use of Ultrasound Elastography: Part 3: Liver. Ultrasound in medicine & biology. 2015;41:1161–79. doi: 10.1016/j.ultrasmedbio.2015.03.007. [DOI] [PubMed] [Google Scholar]
- Friemel BH, Bohs LN, Nightingale KR, Trahey GE. Speckle decorrelation due to two-dimensional flow gradients. IEEE Transactions on Ultrasonics, Ferroelectrics, and Frequency Control. 1998;45:317–327. doi: 10.1109/58.660142. [DOI] [PubMed] [Google Scholar]
- Hollender PJ, Rosenzweig SJ, Nightingale KR, Trahey GE. Single- and multiple-track-location shear wave and acoustic radiation force impulse imaging: matched comparison of contrast, contrast-to-noise ratio and resolution. Ultrasound in medicine & biology. 2015;41:1043–57. doi: 10.1016/j.ultrasmedbio.2014.11.006. [DOI] [PMC free article] [PubMed] [Google Scholar]
- Hurlburt HM, Aurigemma GP, Hill JC, Narayanan A, Gaasch WH, Vinch CS, Meyer TE, Tighe DA. Direct ultrasound measurement of longitudinal, circumferential, and radial strain using 2-dimensional strain imaging in normal adults. Echocardiography. 2007;24:723–731. doi: 10.1111/j.1540-8175.2007.00460.x. [DOI] [PubMed] [Google Scholar]
- International Electrotechnical Commision (IEC) IEC 62359: Ultrasonics - Field characterization - Test methods for the determination of thermal and mechanical indices related to medical diagnostic ultrasonic fields. 2. International electrotechnical commision; Geneva, Switzerland: 2010. [Google Scholar]
- Klysik M, Garg S, Pokharel S, Meier J, Patel N, Garg K. Challenges of Imaging for Cancer in Patients with Diabetes and Obesity. Diabetes technology & therapeutics. 2014 doi: 10.1089/dia.2014.0026. [DOI] [PubMed] [Google Scholar]
- McAleavey S, Menon M, Elegbe E. Shear modulus imaging with spatially-modulated ultrasound radiation force. Ultrasonic imaging. 2009;31:217–234. doi: 10.1177/016173460903100401. [DOI] [PMC free article] [PubMed] [Google Scholar]
- Montaldo G, Tanter M, Bercoff J, Benech N, Fink M. Coherent plane-wave compounding for very high frame rate ultrasonography and transient elastography. IEEE Transactions on Ultrasonics, Ferroelectrics, and Frequency Control. 2009;56:489–506. doi: 10.1109/TUFFC.2009.1067. [DOI] [PubMed] [Google Scholar]
- Nightingale K, Soo MS, Nightingale R, Trahey G. Acoustic radiation force impulse imaging: In vivo demonstration of clinical feasibility. Ultrasound in Medicine and Biology. 2002;28:227–235. doi: 10.1016/s0301-5629(01)00499-9. [DOI] [PubMed] [Google Scholar]
- Nightingale KR, Church CC, Harris G, Wear Ka, Bailey MR, Carson PL, Jiang H, Sandstrom KL, Szabo TL, Ziskin MC. Conditionally Increased Acoustic Pressures in Nonfetal Diagnostic Ultrasound Examinations Without Contrast Agents: A Preliminary Assessment. Journal of Ultrasound in Medicine. 2015;34:1–41. doi: 10.7863/ultra.34.7.15.13.0001. [DOI] [PMC free article] [PubMed] [Google Scholar]
- Palmeri ML, Deng Y, Rouze NC, Nightingale KR. Dependence of shear wave spectral content on acoustic radiation force excitation duration and spatial beamwidth. IEEE International Ultrasonics Symposium: [proceedings]. IEEE International Ultrasonics Symposium; 2014; pp. 1105–1108. [Google Scholar]
- Palmeri ML, Wang MH, Rouze NC, Abdelmalek MF, Guy CD, Moser B, Diehl AM, Nightingale KR. Noninvasive evaluation of hepatic fibrosis using acoustic radiation force-based shear stiffness in patients with nonalcoholic fatty liver disease. Journal of Hepatology. 2011;55:666–672. doi: 10.1016/j.jhep.2010.12.019. [DOI] [PMC free article] [PubMed] [Google Scholar]
- Pinton GF, Dahl JJ, Trahey GE. Rapid tracking of small displacements with ultrasound. IEEE Trans Ultrason, Ferroelec, Freq Contr. 2006;53:1103–1117. doi: 10.1109/tuffc.2006.1642509. [DOI] [PubMed] [Google Scholar]
- Pinton GF, Trahey GE, Dahl JJ. Sources of image degradation in fundamental and harmonic ultrasound imaging using nonlinear, full-wave simulations. IEEE Transactions on Ultrasonics, Ferroelectrics, and Frequency Control. 2011;58:754–765. doi: 10.1109/TUFFC.2011.1868. [DOI] [PMC free article] [PubMed] [Google Scholar]
- Rouze NC, Wang MH, Palmeri ML, Nightingale KR. Robust estimation of time-of-flight shear wave speed using a Radon sum transformation. IEEE Trans Ultrason, Ferroelec, Freq Contr. 2010;57:2662–2670. doi: 10.1109/TUFFC.2010.1740. [DOI] [PMC free article] [PubMed] [Google Scholar]
- Sarvazyan AP, Rudenko OV, Swanson SD, Fowlkes JB, Emelianov SY. Shear wave elasticity imaging: A new ultrasonic technology of medical diagnostics. Ultrasound in Medicine and Biology. 1998;24:1419–1435. doi: 10.1016/s0301-5629(98)00110-0. [DOI] [PubMed] [Google Scholar]
- Schuh S, Man C, Cheng A, Murphy A, Mohanta A, Moineddin R, Tomlinson G, Langer JC, Doria AS. Predictors of non-diagnostic ultrasound scanning in children with suspected appendicitis. Journal of Pediatrics. 2011;158:123–129. doi: 10.1016/j.jpeds.2010.07.035. [DOI] [PubMed] [Google Scholar]
- Shiina T, Nightingale KR, Palmeri ML, Hall TJ, Bamber JC, Barr RG, Castera L, Choi BI, Chou YH, Cosgrove D, Dietrich CF, Ding H, Amy D, Farrokh A, Ferraioli G, Filice C, Friedrich-Rust M, Nakashima K, Schafer F, Sporea I, Suzuki S, Wilson S, Kudo M. WFUMB Guidelines and Recommendations for Clinical Use of Ultrasound Elastography: Part 1: Basic Principles and Terminology. Ultrasound in Medicine & Biology. 2015;41:1126–1147. doi: 10.1016/j.ultrasmedbio.2015.03.009. [DOI] [PubMed] [Google Scholar]
- Song P, Zhao H, Urban M, Manduca A, Pislaru S, Kinnick R, Pislaru C, Greenleaf J, Chen S. Improved Shear Wave Motion Detection Using Pulse-Inversion Harmonic Imaging with a Phased Array Transducer. IEEE transactions on medical imaging. 2013;32:2299–2310. doi: 10.1109/TMI.2013.2280903. [DOI] [PMC free article] [PubMed] [Google Scholar]
- Sporea I, Bota S, Sftoiu A, Sirli R, Gradinaru-Tascau O, Popescu A, Lupsor Platon M, Fierbinteanu-Braticevici C, Gheonea DI, Sandulescu L, Badea R. Romanian national guidelines and practical recommendations on liver elastography. Medical ultrasonography. 2014;16:123–38. doi: 10.11152/mu.201.3.2066.162.is1sb2. [DOI] [PubMed] [Google Scholar]
- Thomas JD, Rubin DN. Tissue harmonic imaging: Why doesit work? Journal of the American Society of Echocardiography. 1998;11:803–808. doi: 10.1016/s0894-7317(98)70055-0. [DOI] [PubMed] [Google Scholar]
- Walker WF, Trahey GE. Fundamental limit on delay estimation using partially correlated speckle signals. IEEE Transactions on Ultrasonics, Ferroelectrics, and Frequency Control. 1995;42:301–308. [Google Scholar]
- Wang MH, Palmeri ML, Rotemberg VM, Rouze NC, Nightingale KR. Improving the robustness of time-of-flight based shear wave speed reconstruction methods using RANSAC in human liver in vivo. Ultrasound in Medicine and Biology. 2010;36:802–813. doi: 10.1016/j.ultrasmedbio.2010.02.007. [DOI] [PMC free article] [PubMed] [Google Scholar]
- Wear KA, Gammell PM, Maruvada S, Liu Y, Harris GR. Improved measurement of acoustic output using complex deconvolution of hydrophone sensitivity. IEEE transactions on ultrasonics, ferroelectrics, and frequency control. 2014;61:62–75. doi: 10.1109/TUFFC.2014.6689776. [DOI] [PMC free article] [PubMed] [Google Scholar]
- Ziskin MC. Specification of acoustic output level and measurement uncertainty in ultrasonic exposimetry. IEEE Transactions on Ultrasonics, Ferroelectrics, and Frequency Control. 2003;50:1023–1034. doi: 10.1109/tuffc.2003.1226546. [DOI] [PubMed] [Google Scholar]


